• Blog
  • Docs
  • Careers
  • Get Support
  • Contact Sales
DigitalOcean
  • Featured AI Products

    Compute

    Build, deploy, and scale cloud compute resources

    Containers and Images

    Safely store and manage containers and backups

    Managed Databases

    Fully managed resources running popular database engines

    Management and Dev Tools

    Control infrastructure and gather insights

    Networking

    Secure and control traffic to apps

    Security

    Help protect your account and resources with these security features

    Storage

    Store and access any amount of data reliably in the cloud

    Browse all products

  • AI/ML

    CMS

    Data and IoT

    Developer Tools

    Gaming and Media

    Hosting

    Security and Networking

    Startups and SMBs

    Web and App Platforms

    See all solutions

  • Community

    Documentation

    Developer Tools

    Get Involved

    Utilities and Help

  • Become a Partner

    Marketplace

  • Pricing
  • Log in
  • Sign up
  • Log in
  • Sign up

Company

  • About
  • Leadership
  • Blog
  • Careers
  • Customers
  • Partners
  • Referral Program
  • Affiliate Program
  • Press
  • Legal
  • Privacy Policy
  • Security
  • Investor Relations

Products

  • GPU Droplets
  • Bare Metal GPUs
  • Inference Engine
  • Data & Learning
  • Model Library
  • Droplets
  • Kubernetes
  • Functions
  • App Platform
  • Load Balancers
  • Managed Databases
  • Spaces
  • Block Storage
  • Network File Storage
  • API
  • Uptime
  • Cloud Security Posture Management (CSPM)
  • Identity and Access Management (IAM)
  • Cloudways
  • View all Products

Resources

  • Community Tutorials
  • Community Q&A
  • CSS-Tricks
  • Write for DOnations
  • Currents Research
  • DigitalOcean Startups
  • Wavemakers Program
  • Compass Council
  • Open Source
  • Newsletter Signup
  • Marketplace
  • Pricing
  • Pricing Calculator
  • Documentation
  • Release Notes
  • Code of Conduct
  • Shop Swag

Solutions

  • AI Training GPU
  • GPU Inference
  • VPS Hosting
  • Website Hosting
  • VPN
  • Docker Hosting
  • Node.js Hosting
  • Web Mobile Apps
  • WordPress Hosting
  • Virtual Machines
  • View all Solutions

Contact

  • Support
  • Sales
  • Report Abuse
  • System Status
  • Share your ideas
© 2026 DigitalOcean, LLC.Sitemap.
Product updates

Improved Graphs: Powered by the Open Source DO Agent

author

By Carlos Amedee

  • Published: January 3, 2017
  • 3 min read
<- Back to blog home

At DigitalOcean, we want to make monitoring the services you’ve deployed simple and easy. As engineers, we know that having greater insight into the machines running in your fleet increases the speed at which you can troubleshoot issues.

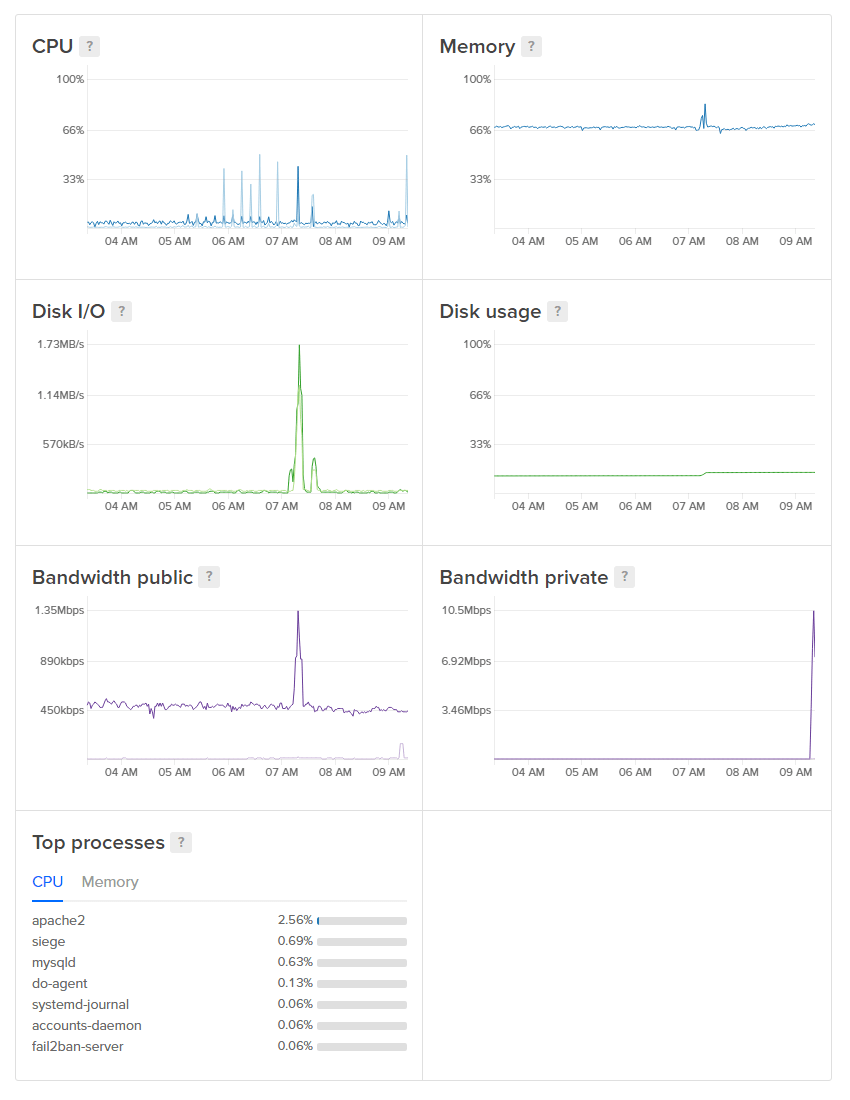
That’s why we’re excited to launch new and improved memory and disk space graphs! We’ve gathered the knowledge that we’ve learned involving telemetry and performance observability and poured it into an open-source project called `do-agent`. This monitoring application helps you get a better picture of the health of your Droplets by adding several new graphs to the Droplet graphs page and making the existing graphs much more precise.

new graphs

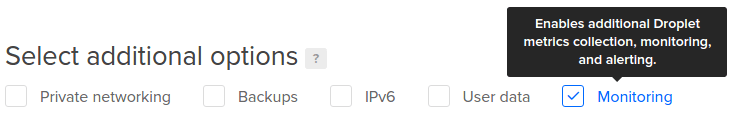
To get these graphs, you’ll need to have the new agent. On new Droplets, just click the **Monitoring** checkbox during Droplet creation.

select monitoring

On existing Droplets, you can install the agent by running:

curl -sSL https://agent.digitalocean.com/install.sh | sh

Or get all the details in this tutorial on the DigitalOcean community site.

How Does do-agent Work?

`do-agent` is a lightweight application which runs on Droplets and periodically collects system performance/state metrics. The collected metrics are immediately transmitted to the monitoring API endpoints and made available to you via the Droplet graphs page.

When we began thinking of `do-agent`, security was one of our top priorities; we wanted to take great care not to collect any data that may be considered private. How could we collect the metrics we felt were necessary with an agent that would require the minimum amount of resources and security privileges?

We chose to collect system information from the `/proc` pseudo filesystem, which contains everything from CPU metrics to Linux kernel versions. In true Unix fashion, `/proc` presents system information laid out as files on the filesystem; the hierarchy determines the information you are attempting to access. The greatest benefit we gain from using `/proc` is the ability to access this information as a very low-privileged user.

The `/proc` files are read and converted into metrics that are transmitted via gRPC to a metrics endpoint. The agent authenticates as belonging to your Droplet and tags all of your data with the Droplet ID.

What’s Next?

This new agent opens up many possibilities for future tools that will provide insight into Droplet performance. We’re not stopping here! Currently, we’re working on a suite of tools which will enable engineers to collectively monitor groups of Droplets instead of individual Droplets.

`do-agent` also has a plugin architecture built in. We don’t have any plugins written yet, but this architecture enables us to create them to observe more than just Droplet metrics; you could potentially collect other software performance metrics running on or alongside your software.

The Prometheus project was a great inspiration and model for this project (and is used in the agent itself), and the ability for you to install plugins to collect arbitrary metrics was inspired by the Munin open-source project. `do-agent` is itself open source, and we welcome contributions!

We’re excited about the possibilities these graphs and this agent open up for us. If you are too, sign up to be the first to know as we begin to roll out new monitoring and alerting features early this year.

By Carlos Amedee

About the author

Carlos Amedee
Carlos Amedee
Author

Share

  • Product Updates

Start building today

From GPU-powered inference and Kubernetes to managed databases and storage, get everything you need to build, scale, and deploy intelligent applications.
Sign up

Related Articles

Run Codex in the cloud – DigitalOcean for Codex is now available
Product updates

Run Codex in the cloud – DigitalOcean for Codex is now available

Ari Sigal
  • June 25, 2026
  • 3 min read

Read more

Server-Side Tools Are Now Available for DigitalOcean Inference Engine
Product updates

Server-Side Tools Are Now Available for DigitalOcean Inference Engine

Grace Morgan
  • June 17, 2026
  • 3 min read

Read more

Model Evaluations: Prove Your Routing Policy Actually Works
Product updates

Model Evaluations: Prove Your Routing Policy Actually Works

Sathish Jothikumar

  • June 4, 2026
  • 7 min read

Read more