Beyond the Abyss Project Poseidon’s Quest for Zero-Downtime Reliability
Software Engineer
- Published:
- 7 min read
In large-scale cloud environments, unpredictable hypervisor crashes carry real operational cost. While traditional reactive monitoring that relies on static thresholds and post-hoc alerts were once the industry standard, this monitoring misses the non-linear, stochastic signals that precede hardware failure. In an era where high availability is the norm, the transition from reactive observation to proactive decisions is an architectural necessity.
This challenge has taken on new dimensions as DigitalOcean scales its investment in GPU accelerated infrastructure. Our new AI-optimized data centers in Richmond and Atlanta house the latest silicon, including NVIDIA’s H100 (Hopper) and Blackwell (B300), alongside AMD Instinct MI350X accelerators. These GPU Droplets power critical Large Language Model (LLM) training pipelines and inference engines, workloads where even a single node failure can slow or derail important ML workloads for our customers. In this high-stakes environment, standard monitoring thresholds are no longer sufficient.
To move beyond reactive mitigation, we are developing Poseidon: a multi-stage, hybrid internal intelligence system that leverages Machine Learning (ML) and Generative AI (GenAI) to help identify “at-risk” nodes before an imminent server crash. Poseidon runs behind the scenes across our global fleet, sifting telemetry and system event logs to help surface the small fraction of nodes showing real signs of hardware distress.
The Challenge of High-Cardinality Telemetry
The primary hurdle in predictive modeling for cloud infrastructure is the “data vs cost” paradox. Our infrastructure consists of thousands of hypervisors that generate huge amounts of data, and processing the sheer amount of data makes it computationally expensive.
Poseidon helps solve this by using a tiered investigative approach and focusing computational resources only where they are needed most.
Architecture Diagram
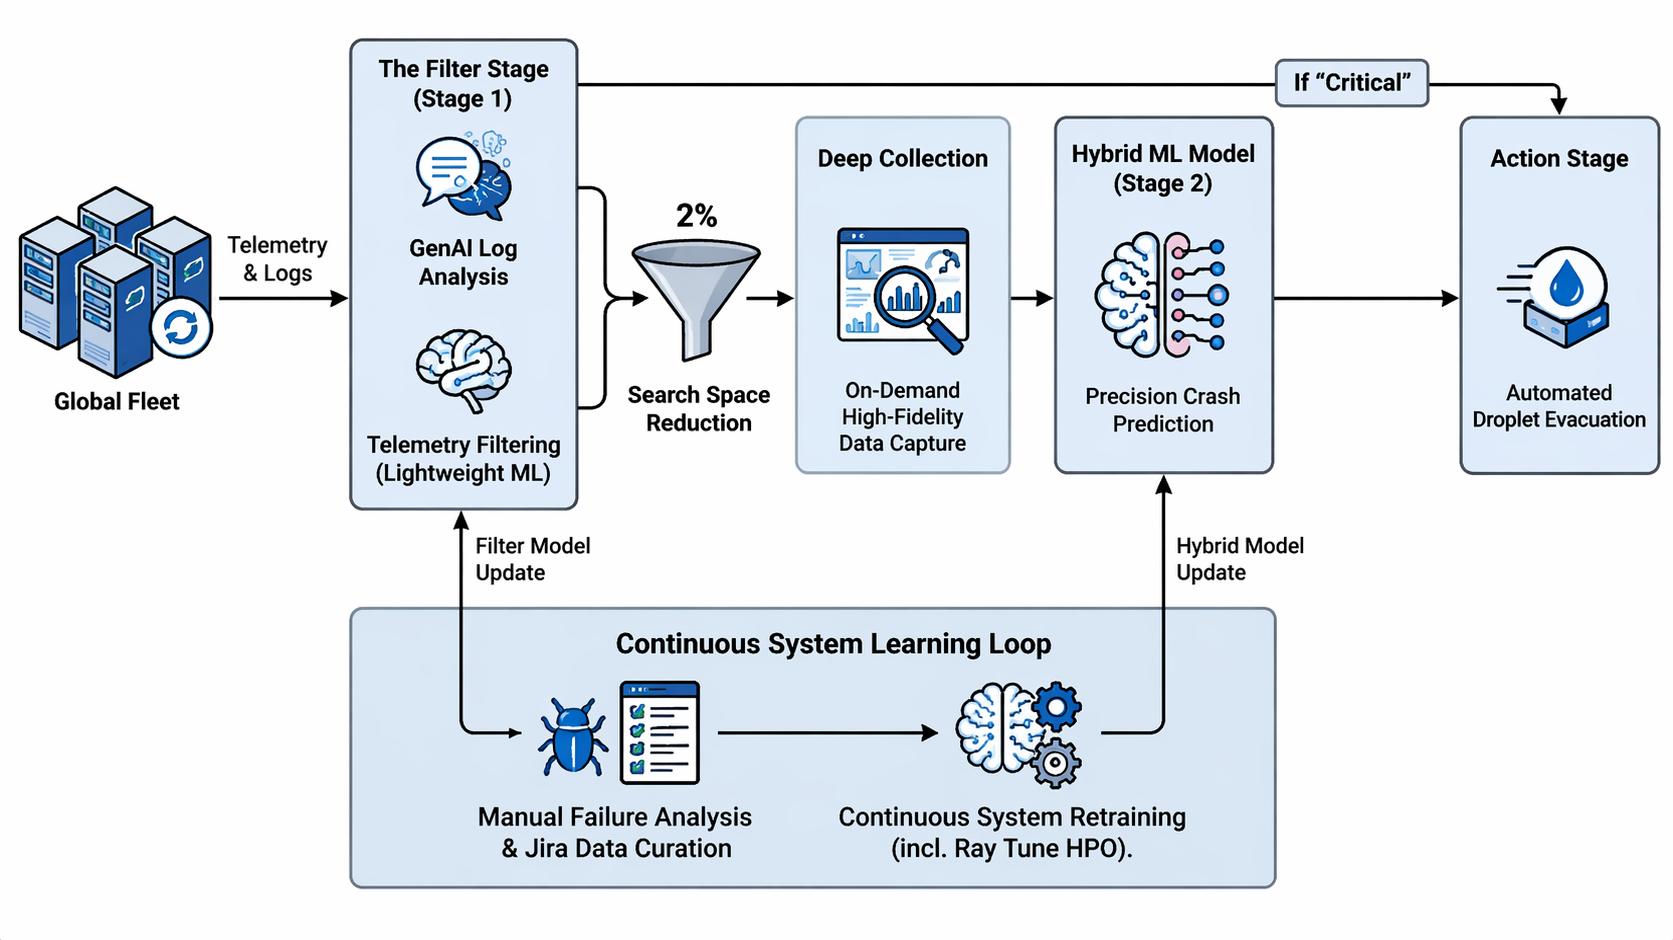
The Tiered Approach
Stage 1: The Filter
The first stage of Poseidon is a two part filter that acts as a gatekeeper. By combining lightweight statistical ML models with GenAI-based semantic log analysis, we can effectively eliminate more than ~98%* of the search space. This allows the system to focus its ‘Deep Collection’ resources exclusively on any remaining tiny, shifting fraction of nodes that actually require deeper investigation.
* The ~98% reduction reflects our internal findings that the “at-risk” node list after Stage 1 comprises less than 2% of total nodes.
1. Telemetry Filtering
The first line of defense in the Poseidon funnel is a high-velocity telemetry filter designed for maximum computational economy. We leverage our existing observability platform to execute a curated suite of targeted PromQL queries that act as a tripwire for hardware instability.
These queries are designed to extract high-signal, low-latency metrics, focusing on data points such as rapid delta changes in CPU and GPU temperatures, non-linear spikes in CPU and memory utilization, PSU instability, etc.
Sample Targeted PromQL Queries:
- Average CPU Temperature Query (5m):
avg_over_time(
          temperature_celsius{instance="{serial_number}",sensor="CPU Temp"}[5m]
      )
This acts as a rapid thermal tripwire. By averaging the CPU temperature over a tight 5-minute rolling window, the filter quickly gauges the node’s immediate thermal condition.
- Average CPU Frequency Query (10m):
avg_over_time(
        avg by (instance) (
          cpu_frequency_hertz{instance="{serial_number}"}
        )[10m]
      ) / 1e9
This query calculates the average clock speed across processor cores over the last 10 minutes, dividing by 109 to convert the raw data from Hertz into readable Gigahertz (GHz). We use this lightweight metric to catch “thermal throttling”, the exact moment a distressed CPU intentionally bottlenecks its own performance to survive an overheating event.
By using such tight temporal windows, these queries provide a near-instantaneous report of node health without taxing the network. This raw telemetry is then streamed into a lightweight ML model specifically optimized for inference speed. Rather than attempting a full diagnosis, this model is trained to detect the subtle, stochastic patterns that traditional static thresholds miss. If this model detects a signature of risk, the node is flagged and passed forward.
2. Log Analysis via GenAI
Present in every server in our fleet is the Baseboard Management Controller (BMC) , a dedicated, autonomous microcontroller that acts as the hardware’s source of truth. The BMC operates independently of the host CPU and operating system, providing a continuous monitoring layer for the physical health of the machine. It captures these observations in the System Event Log (SEL), a granular, time-stamped ledger that records everything from subtle voltage fluctuations and fan speed deviations to catastrophic memory failures.
While SEL logs are highly valuable for hardware forensics they are challenging to parse at scale. Log formats vary wildly between manufacturers and even between firmware versions. Traditional regex-based parsers often fall short under this heterogeneity or miss critical context because they lack a “semantic” understanding of the error.
Poseidon proposes to solve this by streaming these log streams through a fine-tuned, custom LLM. Rather than searching for literal strings, the LLM interprets the intent and severity of the hardware’s distress signals. By understanding the context of the logs, Poseidon categorizes nodes into one of the following:
- Critical: If the LLM identifies a known fatal error pattern.
- Risky: If the logs show signs of instability.
- Healthy: If the node continues normal operation.
If the model predicts the node to be critical, we immediately send it ahead to our automation system. If the model predicts the node to be risky, we forward the node to Phase 2 for a deeper analysis.
By separating the signal from the noise in this way, we are able to concentrate our efforts on the much smaller subset of nodes that might need corrective action.
Phase 2: Deep Collection and Hybrid Modeling
Once the candidate list is narrowed, Poseidon initiates a “Deep Collection” event for the flagged at-risk nodes. In this stage, we execute high-resolution PromQL queries over extended time windows to capture granular metrics like CPU frequency, memory utilization, network throughput, etc. While such telemetry is collected fleet-wide, synthesizing such a massive volume of raw data into a form ready for deep analysis is traditionally too computationally expensive to perform at scale. This high-fidelity dataset helps the system to detect subtle anomalies and transient spikes that the initial filter might have missed.
What does “High Resolution” mean here?
In this context, “high resolution” refers to extracting highly granular, continuous time-series data over an extended lookback window (like 60 minutes or 12 hours or even 24 hours). While Stage 1 relies on short, lightweight snapshots to detect immediate danger, high-resolution queries pull a deep, dense history of metrics. This gives the ML model the exact fidelity it needs to analyze subtle micro-trends, slow-building thermal degradation, and transient spikes that a quick health check would miss.
Sample High Resolution PromQL queries:
- CPU Utilization (12h)
cpu_utilization{instance="{serial_number}", sensor="CPU Util"}[12h]
Captures the compute load of a CPU over a 12-hour window. Instead of averaging the data, this query pulls every individual data point to map out the true shape of the processor’s workload. Feeding this high-fidelity curve into the Hybrid ML model helps it spot erratic usage patterns, sudden micro-spikes, or prolonged max-utilization events.
- External Temp (60m)
temperature_celsius{instance="{serial_number}", sensor="Exhaust Temp"}[60m]
Tracks the raw exhaust temperature over the last hour. Supplying a continuous, unaggregated stream of environmental data enables the system to differentiate between internal hardware stress and external cooling failures. The model uses these granular readings to identify drops in cooling performance or localized bottlenecks in the data center rack.
Such high-resolution telemetry is then ingested by a Hybrid ML Model, which fuses the deep data stream with the broader behavioral context gathered in Phase 1. The model calculates a precise probability score for an imminent crash within the next observation window. If this confidence score breaches our safety threshold, the node is immediately handed off to our automation system.
The Feedback Loop: Continuous Evolution
A predictive model is only as good as its last training set. To ensure Poseidon evolves alongside our infrastructure, we implement a continuous improvement pipeline:
- Automated Dataset Curation: A recurring Kubernetes cron job correlates nodes that crashed in production with their corresponding logs and historical telemetry.
- Experimentation & Tuning: Using Ray Tune, we perform hyperparameter optimization across various model architectures (e.g., XGBoost, LSTMs, and Transformers).
- A/B Evaluation: Newer filter versions are shadowed against the production model. We only promote a model to the “Filter” or “Deep-Dive” stage once it demonstrates a superior F1-score or improved recall without significantly increasing the false-positive rate.
Design Decisions Worth Naming
1. Localized Inference, Centralized Intelligence
Poseidon operates as a distributed system with local execution across each of our 14 global data centers. This “edge-first” approach ensures minimal latency, allowing the system to react to instability in near real-time. While inference happens locally, the data curation and model retraining are performed at a central hub. Once a new model is validated, it is automatically distributed fleet-wide, ensuring every data center benefits from global insights.
2. Prioritizing Recall Over Accuracy
For the Filter Stage, we intentionally optimized our models for recall rather than raw accuracy. By biasing for recall, we cast a wide net to ensure that no subtle indicator of instability slips through the cracks.
3. Combatting Data Drift with Continuous Retraining
Infrastructure is never static. As we introduce new hardware and firmware, the signatures of failure inevitably evolve, a phenomenon known as data drift. To stay ahead, we maintain a frequent retraining loop. This process is governed by strict “safety gates”: every updated model must pass automated benchmarks for F1 Score and Recall before being promoted to production, helping to ensure that our predictive standards don’t waver.
Looking Ahead
Project Poseidon is a fundamental shift from monitoring what has happened to forecasting what will happen. By fusing the semantic intuition of GenAI with the statistical precision of traditional ML, we are building an infrastructure that doesn’t just report failure, but is designed to outpace it. Our goal is simple: we handle the complexity of next-gen hardware and the turbulence of hypervisor stability, so our customers can stay focused on building the future of AI.
Poseidon is an ongoing project at DigitalOcean. If you are interested in working on problems like this—predictive infrastructure, hardware reliability at cloud scale, or ML systems that get smarter over time—we are hiring. Take a look at our career page.
About the author
Related Articles

The Inference Alpha: Maximizing Frontier Models on AMD
Balaji Varadarajan
- June 10, 2026
- 12 min read

The Inference Tax: How Prefix-Aware Routing Eliminates the Hidden Cost of LLMs at Scale
- June 1, 2026
- 13 min read

DigitalOcean Serverless Inference: A Deep Dive
- June 1, 2026
- 17 min read