10 Best LLM Observability Tools for AI Agents in 2027

By Jesse Sumrak
Sr. Content Marketing Manager
- Updated:
- 20 min read
Traditional software application monitoring doesn’t work for AI agents. Your agents could be up, running, and giving your users the wrong answers, but legacy systems wouldn’t necessarily flag anything out of order. Uptime and CPU charts won’t tell you that your agent used the wrong tool or pulled outdated context, and they also can’t tell you which model call is eating up the bulk of your tokens.
When it comes to monitoring AI agents, you need purpose-built LLM observability tools. Solutions can include open-source tracing projects, eval-first platforms, enterprise APM suites, and AI platforms. Let’s compare the best LLM observability tools across approach, features, pricing, and fit.
Key takeaways:
- LLM observability tools trace model calls, tool calls, and agent steps, then help you measure latency, cost, and output quality in production.
- They help you debug multi-step agents faster, catch quality regressions before users do, and see which models and requests drive your token spend.
- Choose a tool based on the metrics you need to measure (latency metrics like TTFT, cost, and tracing depth), OpenTelemetry support, self-hosting requirements, and whether observability should live inside the platform that runs your inference.
- The best LLM observability tools include DigitalOcean, Langfuse, Arize Phoenix, Laminar, Traceloop (OpenLLMetry), LangSmith, Braintrust, Splunk Agent Observability, Datadog, and Dynatrace.
What are LLM observability tools?
An LLM observability tool is software that collects and analyzes telemetry from applications built on large language models (LLMs). This includes traces of model calls, tool calls, and agent steps, along with latency, token usage, cost, and output quality. It captures this data through SDKs or OpenTelemetry instrumentation and pairs it with evaluations that score responses, so teams can see why an application or AI agent behaved the way it did.
These tools provide observability for LLM applications, which is different from AIOps tools that use LLMs to analyze infrastructure data.
LLM observability vs. traditional monitoring and MLOps
Traditional application monitoring only tracks whether a service is up, fast, and error-free. LLM applications can be checking all the traditional uptime boxes while still failing the task at hand. That’s because the output itself can be wrong, unsafe, or more expensive than it should be. MLOps monitoring focuses on training pipelines and model drift, but it doesn’t analyze prompts, tool calls, or multi-step agent runs. LLM observability looks at what the model was asked, its response, the cost, and whether the answer was actually correct.
What metrics matter for LLM inference observability?
LLM applications use different metrics than typical web services. That’s because a single response is generated token by token, and an agent can chain dozens of model calls together. We recommend using the following metric groups to monitor AI agents in production.
Latency metrics
LLM latency isn’t a single number. Some responses start quickly and then stall mid-stream. Others stream smoothly but make you wait a long time for the first token. Factors like model size, prompt length, and GPU load can shift each of these separately, which is why one number can’t capture how responsive your application feels.
Here’s how each factor impacts the user experience:
- Time to first token (TTFT): How long a user waits between sending a request and seeing the first token. It includes queueing and prompt processing. This is what your users experience in chat and streaming interfaces.
- Time per output token (TPOT): The average time to generate each token after the first one. It sets the pace at which text streams in once the response starts.
- Inter-token latency (ITL): The time gap between streaming individual tokens. A healthy average TPOT can still hide ITL spikes that show up as visible stutter in streamed text.
- End-to-end latency: The total time to complete a response. This matters for agents and non-streaming calls, where each step waits for the previous one to finish-any delays compound.
Throughput and reliability
Throughput shows how much work your system handles in terms of:
- Tokens per second across all requests
- Requests per second at the endpoint
Reliability metrics cover success and error rates, ideally split between client errors such as rate limits (4xx) and server errors (5xx), plus timeouts. When one model or provider’s error rate starts climbing, shift traffic to a backup model or provider before failed requests reach your users.
Cost and token usage
Much of your LLM bill is driven by token usage. You’ll want to track:
- Input tokens and output tokens per request
- Cost per request
- Cost by model
AI agents muddy this information because one user action can trigger multiple model calls. Narrow down your spend insights by looking at cost attribution by feature, customer, or agent run.
Quality and behavior
It doesn’t matter how fast or cheap your agent responses are if they’re ultimately wrong. Quality comes first, and then you can pull the appropriate levers to improve speed and cost.
Evaluation scores (such as LLM-as-a-judge ratings for correctness, faithfulness, or relevance) measure output quality, while step-level traces show which tools an agent called, with what arguments, and where a run went off track. Look at the other end by monitoring user feedback signals: corrections, retries, and abandoned sessions.
Want to measure TTFT, TPOT, and ITL under real load? Read our guide to LLM inference benchmarking.
Benefits of LLM observability tools
LLM observability tools let you proactively debug features based on your own collected data rather than waiting for eventual user complaints.
Here’s how a dedicated tool helps your team once a feature is in production:
- Faster debugging for multi-step agents: A trace (a step-by-step record of everything that happened during a single request or agent run) shows every model call, tool call, and intermediate result in order, so you can determine exactly where a run went wrong. This turns vague failure reports into something specific you can fix.
- Visibility into token spend: Per-request and per-model cost tracking shows which features, customers, or agent runs drive your bill. You can then route simpler requests to cheaper models or trim bloated prompts.
- Latency you control: Metrics like TTFT and end-to-end latency show whether slowdowns come from the model, the provider, or your own code. You need to keep tabs on these because users notice delays here immediately.
- Continuous quality checks: Evaluations score outputs for correctness, faithfulness, or safety against datasets and live traffic. Regressions show up in a dashboard or a failed continuous integration (CI) check.
- Record for audits and reviews: Stored traces show what a model was asked, what it returned, and which tools it used. That history helps with incident reviews, compliance questions, and conversations with stakeholders about how your AI features behave.
How to choose an LLM observability tool
Most LLM observability tools can trace a model call and log its latency and token count. Features are less important than product fit.
You’ll want to choose a tool that works with how your application is built, what you already run, and which metrics your users feel:
- If your agents call many tools, prioritize step-level tracing of each model and tool call in your agent harness. Look for trace views that show each tool call with its arguments and results, session grouping for multi-turn conversations, and evals that score whole runs rather than single responses.
- If you already run Datadog, Dynatrace, or Splunk, start with their LLM modules. Keeping LLM traces next to your existing APM and infrastructure data saves a context switch during incidents, though dedicated tools usually go deeper on evals and prompt management.
- If you need self-hosting or vendor portability, check the license and OpenTelemetry support first. Open-source tools you can run yourself keep data in your environment, and instrumentation built on OpenTelemetry facilitates changing backends later without re-instrumenting.
- If you serve latency-sensitive streaming features, confirm the tool reports TTFT. Few tools break out TPOT or ITL by name, so check whether you can derive them from collected timing data.
- If you want observability bundled with the platform that runs your inference, consider AI platforms like DigitalOcean that collect metrics, logs, and traces automatically. You skip the SDK setup and get cost and latency data tied directly to the models and agents you deploy.
Still deciding where your agents will run? Our guide to the best inference providers for AI agents compares model access, latency, and pricing structure.
Best LLM observability tools in 2027
The best LLM observability tools are grouped below by approach: AI platforms with built-in observability, open-source tools, commercial platforms, and enterprise observability suites. Each entry covers the tool’s focus, key features, latency metrics, and pricing.
Pricing and feature information in this article are based on publicly available documentation as of October 27, 2026, in US dollars and exclusive of taxes and may vary by region, configuration and workload; all pricing is subject to change. For the most current pricing and availability, please refer to each provider’s official documentation.
| Solution | Best for* (use cases) | Key features | Pricing |
|---|---|---|---|
| DigitalOcean | Building, monitoring, and evaluating agents in one platform | Built-in metrics, logs, and traces; TTFT and per-request cost for Serverless Inference; Signals; Evaluations and Simulations | No additional charge during public preview without a service level agreement and subject to the DigitalOcean preview terms. |
| Langfuse | Self-hosting open-source tracing, prompts, and evals | Tracing with TTFT and cost, prompt management, evals, monitors; MIT license | Free to self-host; Hobby free; Core $29/month; Pro $199/month; Enterprise $2,499/month |
| Arize Phoenix | Debugging LLM apps locally with OpenTelemetry-native tooling | OpenTelemetry tracing, span replay, evals and experiments; Elastic License 2.0 | Free to self-host; AX Free; AX Pro $50/month; AX Enterprise custom |
| Laminar | Tracing and debugging long-running AI agents | Signals, browser-agent recordings, run replay; Apache 2.0 | Free to self-host; Starter $30/month; Pro $150/month; Enterprise custom |
| Traceloop | Instrumenting LLM apps with vendor-neutral OpenTelemetry | OpenLLMetry SDK (Apache 2.0), TTFT for OpenAI streaming, evaluators and monitors | OpenLLMetry free (open source); Free Forever; Enterprise custom (includes on-prem) |
| LangSmith | Tracing and evaluating LangChain and LangGraph apps | Native LangChain tracing, TTFT dashboards, online evals, annotation queues | Developer free; Plus $39/seat/month; Enterprise custom includes self-hosting) |
| Braintrust | Running evals and gating deploys in CI/CD | CI eval gates, TTFT charts, online scoring, Loop AI agent | Starter free; Pro $249/month; Enterprise custom includes self-hosting) |
| Datadog | Tracing and evaluating agents with full-stack APM context | APM-linked traces, TTFT and TPOT on streaming spans, token and cost metrics, LLM-as-a-judge evals | Free (40K LLM spans); Pro $200/month or $160/month billed annually; On-demand $240/month |
| Dynatrace | Correlating AI workloads with full-stack Dynatrace monitoring | OpenTelemetry-first ingestion, agent topology, prompt A/B tests, TTFT and TPOT metrics | Usage-based through a Dynatrace Platform Subscription |
| Splunk Agent Observability | Scoring production agent traffic with small evaluator models | Luna-2 evaluators, Signals failure detection, Agent Control guardrails, TTFT on spans | Free Edition access; from $100/month billed annually; Enterprise custom |
AI platforms with built-in observability and evals
Instead of adding an observability tool on top of your stack, observability and evaluation are part of the platform your models and agents run on, so telemetry flows in with no SDKs or collectors to set up.
1. DigitalOcean for monitoring, evaluating, and improving agents in one platform
DigitalOcean is the AI-native Cloud that builds observability and evaluation into the same platform that runs your models and agents. DigitalOcean Insights (public preview) collects metrics, logs, and traces from Droplets and GPU Droplets running the Observability agent, and it’s enabled for Managed Agents without additional configuration. Traces follow an agent turn from the model call through each tool it invoked. Serverless Inference reports TTFT, end-to-end latency, success and error rates, token usage, and per-request cost through the platform’s built-in instrumentation. When something goes wrong, Signals (public preview) flags production sessions where users got frustrated or tools failed, and Evaluations scores the fix with LLM-as-a-judge metrics before it ships.
During the preview, Insights covers DigitalOcean resources only and doesn’t support trace export. Pair it with an OpenTelemetry-based tool if you need to trace code running elsewhere.
DigitalOcean key features:
- Simulations run a candidate change through realistic multi-turn scenarios (generated from flagged production sessions or described in plain language) in an isolated sandbox before it reaches users.
- Inference Router traces every routing decision with the model it selected and the task it detected to tell you why a request went where it did.
- Metric alerts route to the notification channels your team already uses, and the DigitalOcean API lets you query metrics and logs and manage alert rules programmatically.
DigitalOcean pricing:
- Insights: No additional cost during public preview.
- Serverless Inference: From ~$0.05 USD per million input tokens, depending on the model, exclusive of taxes and subject to change.
- Evaluations: Billed at the same per-token rates as the models used, with no separate evaluation fee.
- Inference Router: No additional cost during public preview; you pay for the model that serves each request.
Wondering where agent traces live long term? DigitalOcean Agent Data Services (private preview) stores agent sessions, tool calls, and execution traces in one queryable catalog that feeds the same Signals and Evaluations loop.
Open-source LLM observability tools
Open-source LLM observability tools publish their source code and can run on your own infrastructure. This keeps trace data in your environment. Langfuse, Laminar, and OpenLLMetry use permissive open-source licenses, but Phoenix is source-available under the Elastic License 2.0.
2. Langfuse for self-hosting tracing, prompts, and evals under an MIT license
Langfuse is an open-source LLM engineering platform that combines tracing, prompt management, and evaluations in one project. It’s available as a self-hosted deployment or a managed cloud service. The self-hosted version runs under the MIT license, which is a suitable option if you need to keep trace data in your own environment. It’s built on OpenTelemetry and integrates with most major frameworks and model providers, so it isn’t tied to one stack. Langfuse joined ClickHouse in January 2026, and the team says licensing and the cloud product continue unchanged. The trade-off is that a production self-hosted deployment also manages Postgres, ClickHouse, Redis, and object storage alongside the app.
Langfuse key features:
- Traces record TTFT, tokens per second, and P95 and P99 latency. Token usage and cost are broken down by usage type.
- Monitors alert on cost, quality, and latency thresholds through Slack, webhooks, or GitHub Actions.
- Prompt versions are tagged in Langfuse, so you can promote or roll back a prompt in production without touching your code.
- Self-hosted - Free. Includes all core features under the MIT license.
- Hobby - Free. Includes 50,000 units per month, two users, and 30-day retention.
- Core - $29/month. Includes 100,000 units ($8 per additional 100,000), unlimited users, and 90-day retention.
- Pro - $199/month. Adds three-year retention.
- Enterprise - $2,499/month. Adds custom SLOs and rate limits.
3. Arize Phoenix for debugging LLM apps locally with OpenTelemetry-native tooling
Arize Phoenix is a source-available AI observability and evaluation tool built on OpenTelemetry and the OpenInference conventions. Unlike most tools on this list, it runs as a single application with a built-in database, so you can start it on a laptop or in a notebook and see what an agent is doing without creating an account, sending data to a vendor, or setting up a database. Arize itself is now part of Dynatrace (as of October 1, 2026), but it says Arize AX will remain available as a standalone offering and Phoenix will remain freely available.
Arize Phoenix key features:
- Project dashboards show latency quantiles, token usage, cost, and error rates, with cost calculated from a built-in model pricing table.
- Span replay loads a traced LLM call into the prompt playground, so you can rerun it with different prompts or parameters.
- LLM-as-a-judge and code-based evaluators run against datasets, and experiments compare prompt or model changes side by side.
- Phoenix (self-hosted) - Free. Runs on your own infrastructure.
- AX Free - Free. Includes 25,000 spans per month, 1 GB of ingestion, 15-day retention, and unlimited users.
- AX Pro - $50/month. Includes 50,000 spans per month, 10 GB of ingestion, and 30-day retention.
- AX Enterprise - Custom pricing. Offers SaaS or self-hosted deployment.
4. Laminar for tracing and debugging long-running AI agents

Laminar is an open-source, Apache 2.0-licensed observability platform built specifically for AI agents. Its OpenTelemetry-native SDK pulls in traces from common frameworks with minimal setup, and its Rust-based backend stores them in ClickHouse and Postgres. You can run it locally with a single Docker Compose command or use the managed cloud. Laminar lists fewer integrations in its published documentation than Langfuse or Phoenix.
Laminar key features:
- Signals lets you describe a failure in plain English, like an agent calling the same tool in a loop, and flags every matching trace, with Slack or email alerts.
- Browser-agent session recordings stay in sync with the trace timeline for tools like Browser Use, Playwright, and Stagehand.
- The Debugger replays a recorded run from cache up to a chosen step, so you can test a fix without rerunning the whole agent.
- Free. Includes 1 GB of data, 7-day retention, one project, and one seat.
- Starter - $30/month. Includes 3 GB of data ($2 per additional GB), 30-day retention, and unlimited seats, with Signals analysis billed by token.
- Pro - $150/month. Includes 10 GB of data ($1.50 per additional GB), six-month retention, and Slack support.
- Enterprise - Custom pricing. Offers on-premises deployment.
5. Traceloop for instrumenting LLM apps with vendor-neutral OpenTelemetry
Traceloop maintains OpenLLMetry, an Apache 2.0-licensed set of OpenTelemetry instrumentations. Because OpenLLMetry emits standard OpenTelemetry data, you can send the same traces to Traceloop’s own platform or to nearly 30 other observability backends, including Datadog, Dynatrace, Splunk, and Langfuse. Traceloop’s commercial platform builds on that data with dashboards, prompt management, and team features. ServiceNow acquired Traceloop in March 2026 to power observability in its AI Control Tower, but Traceloop says OpenLLMetry will remain open source.
Traceloop key features:
- Traceloop Hub, an open-source LLM gateway written in Rust, gives you a single OpenAI-compatible API across model providers, with built-in OpenTelemetry tracing.
- The OpenAI instrumentation records TTFT for streaming completions, and the platform’s cost API groups spend by user, session, or other properties.
- Prebuilt evaluators (including agent tool-selection and goal-accuracy checks) can run as real-time monitors on live spans, as CI checks, or as guardrails.
- Free Forever. Includes up to 50,000 spans per month, up to five seats, and 24-hour data retention.
- Enterprise - Custom pricing. Adds unlimited seats, custom retention, SOC 2 compliance, and on-premises deployment.
Commercial LLM observability platforms
The following managed platforms focus on the development loop of tracing, evals, and prompt iteration. They’re the fastest to adopt if you don’t need to self-host and want evaluation workflows built in from the start.
6. LangSmith for tracing and evaluating LangChain and LangGraph apps
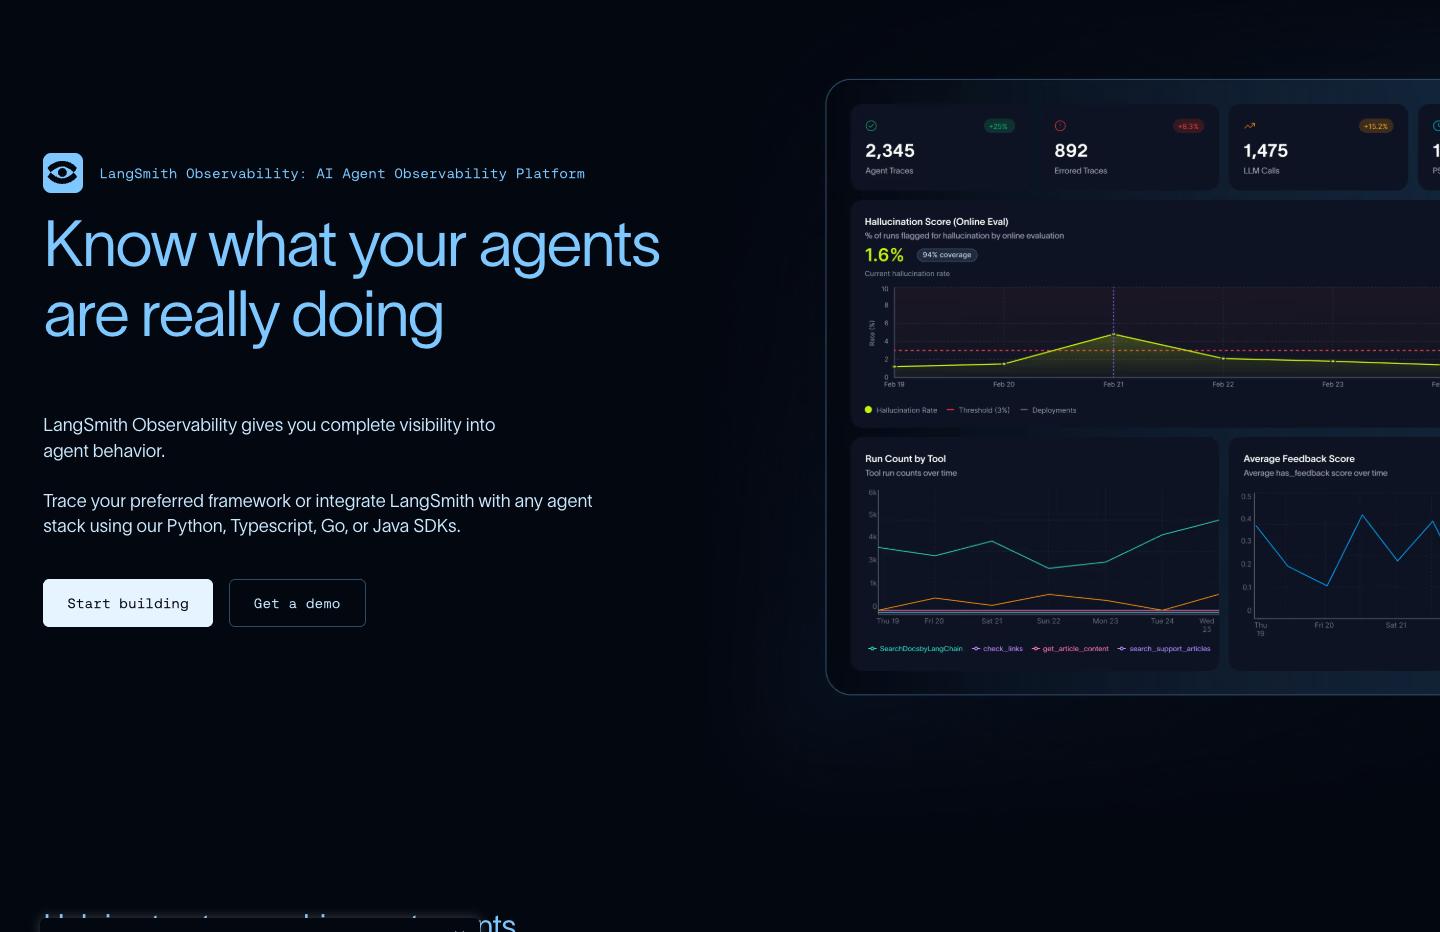
LangSmith is LangChain’s platform for tracing, evaluating, and monitoring LLM applications and agents. LangChain and LangGraph apps send traces with almost no setup, but LangSmith also supports OpenTelemetry end-to-end and works with the OpenAI and Anthropic SDKs, CrewAI, the Vercel AI SDK, and Pydantic AI. Unlike the rest of this list, which prices by usage or flat monthly tiers, LangSmith charges per seat, so costs scale with team size as well as trace volume. Usage beyond the included 10,000 traces per month is billed in LangChain Standard Units (LSUs), a credit that covers extra traces, deployments, and evaluator runs. It’s a natural default for LangChain and LangGraph teams. On other frameworks, you lose the zero-setup tracing that sets it apart, so a framework-neutral tool can be a better fit.
LangSmith key features:
- Dashboards chart trace and LLM latency, TTFT, tokens, and cost, with cost tracked automatically for OpenAI, Anthropic, and Gemini calls.
- Online evaluators score a sample of production traces in real time, and annotation queues route traces to human reviewers, including side-by-side pairwise comparisons.
- LangSmith Engine (public beta) clusters production failures into named issues and can propose evaluators or open fix pull requests.
- Developer - Free. Includes one seat and 5,000 base traces per month.
- Plus - $39/seat/month. Includes 10,000 base traces per month and up to three workspaces.
- Enterprise - Custom pricing. Offers self-hosted, hybrid, or bring-your-own-cloud deployment, invoiced annually.
Building on LangChain or LangGraph? Our tutorial on debugging and evaluating LLM agents with LangSmith walks through tracing, debugging, and scoring agent runs.
7. Braintrust for running evals and gating deploys in CI/CD
Braintrust is an AI evaluation and observability platform built around the eval loop. If quality drops, the change doesn’t ship. Its GitHub Action posts eval results on every pull request, and its CLI can block a merge when scores fall. This process works for teams that treat prompt and model changes like code changes. Braintrust is closed source, so you can’t inspect or extend the platform yourself.
Braintrust key features:
- Preset charts track latency, TTFT, token counts, and total LLM cost.
- Online scoring evaluates production traces as they’re logged, and any log can be added to a dataset so real failures become test cases.
- Loop, Braintrust’s built-in AI agent, investigates logs and drafts prompts, scorers, datasets, and dashboards with your approval.
- Starter - Free. Includes 1 GB of processed data, 10,000 scores, 14-day retention, and unlimited users.
- Pro - $249/month. Includes 5 GB of processed data ($3 per additional GB), 50,000 scores, and 30-day retention.
- Enterprise - Custom pricing. Offers hosted or on-premises deployment.
Enterprise observability platforms with LLM monitoring
These enterprise observability suites added LLM and agent monitoring to their existing products. They’re a good fit if your team is already invested in one and wants AI traces next to the rest of its telemetry.
8. Datadog for adding agent observability to an existing Datadog APM stack

Datadog Agent Observability (formerly Datadog LLM Observability) records each request to your AI application as a trace, with a span for every agent decision, tool call, or workflow step. Its SDK is built on Datadog APM’s tracer, so you can move from an LLM span to the backend service behind it without switching tools. It auto-instruments common model providers and frameworks in Python and Node.js, with Java support limited to OpenAI. It also accepts OpenTelemetry spans that follow the GenAI semantic conventions. It works for teams already running Datadog APM, but in our opinion the setup and span-based pricing may be less suitable for LLM tracing alone.
Datadog key features:
- Token metrics break usage down into input, output, reasoning, and prompt-cache tokens, with estimated cost reported per span.
- Streaming root spans record TTFT and time per output token (TPOT).
- Managed and custom LLM-as-a-judge evaluations check for hallucination, prompt injection, tool selection, and goal completion, while Sensitive Data Scanner redacts PII from prompt-response pairs.
- Free. Includes up to 40,000 LLM spans per month (tool, workflow, and agent spans aren’t billed).
- Pro - $200/month or $160/month billed annually ($1,920/year). Includes the first 100,000 LLM spans with 15-day retention, with additional spans from $3.50 per 10,000 on annual billing.
- On-demand - $240/month. Includes the first 100,000 LLM spans with 15-day retention, with additional spans from $5 per 10,000.
9. Dynatrace for correlating AI workloads with full-stack Dynatrace monitoring
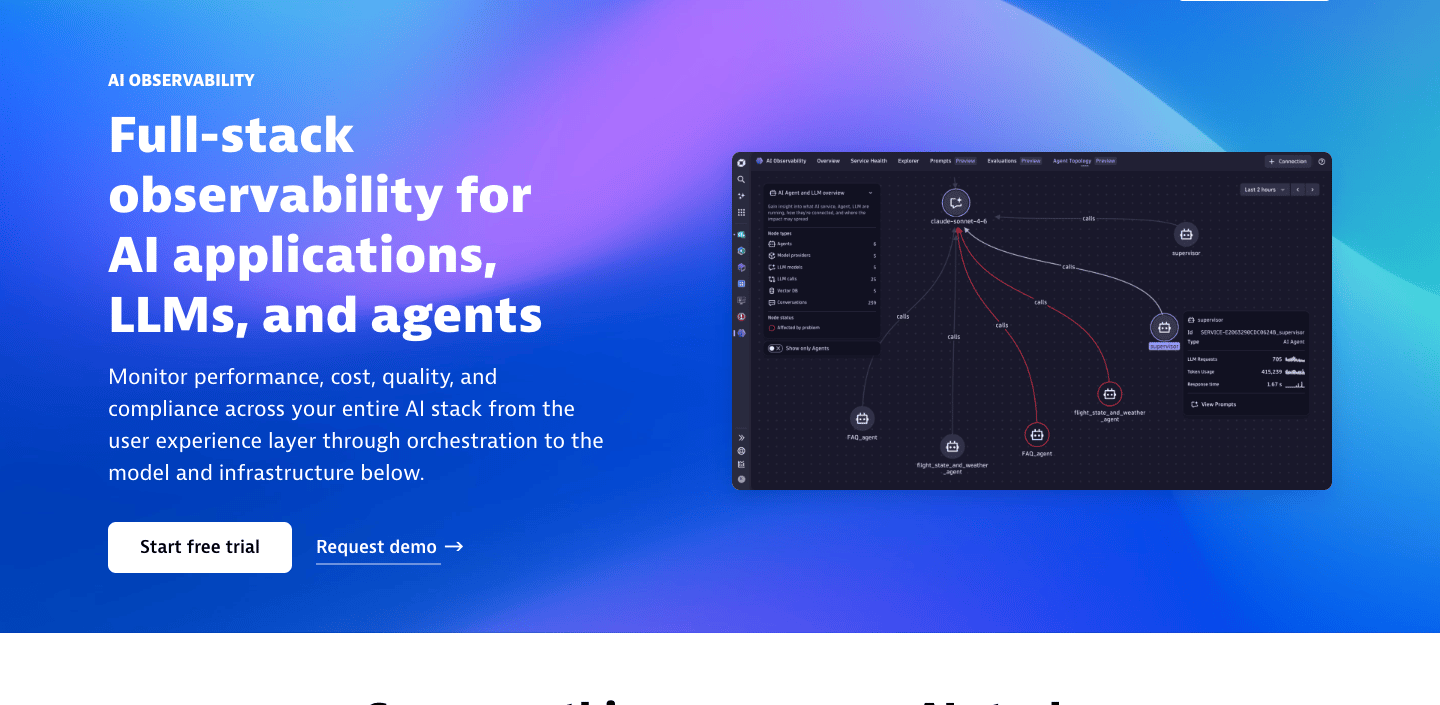
Dynatrace AI Observability extends the Dynatrace platform to LLMs, AI agents, and the services and infrastructure underneath them. It’s OpenTelemetry-first, meaning you send spans that follow the GenAI semantic conventions (or instrument with OpenLLMetry or OpenInference), and Dynatrace normalizes them. LLM signals then appear next to the problems, pods, and clusters that Dynatrace monitors with AI-driven root-cause analysis on top. It’s built for existing Dynatrace customers and requires a Dynatrace Platform subscription, so in our opinion, it is less suitable as a standalone LLM tool. Evaluations are still in preview, and Dynatrace reports guardrail activity from model providers rather than enforcing guardrails itself. Dynatrace completed its acquisition of Arize in October 2026 and plans to integrate Arize’s capabilities over time.
Dynatrace key features:
- Agents topology view maps handovers between agents, models, providers, and services.
- Prompts view compares prompt versions and supports A/B tests on spans that follow the GenAI conventions.
- Token usage feeds cost views and a token usage forecast alert, and the metrics reference includes TTFT and TPOT histograms.
- $0.20 per GiB of traces ingested and processed
- $0.0007 per GiB-day of trace retention
- $0.0035 per GiB of traces scanned by queries
- $0.15 per 100,000 metric data points ingested and processed
10. Splunk Agent Observability for scoring production agent traffic with small evaluator models

Splunk Agent Observability (formerly Galileo) is an AI observability and evaluation platform. It traces agent runs, scores them, and supports both SaaS and self-hosted deployment. It provides a family of small fine-tuned evaluator models (Luna-2) designed to score production traffic at a fraction of the cost and latency of large judge models. It accepts OpenTelemetry and OpenInference traces through an OTLP endpoint and now sits alongside the rest of Splunk Observability Cloud.
Splunk Agent Observability key features:
- Signals analyzes every production trace to surface unknown failure patterns, ranks them by priority, and lets you turn one into a custom metric.
- Agent Control, an open-source guardrail layer, applies policies for prompt injection, PII, and harmful content without redeploying your agent.
- LLM spans record TTFT, duration, and token counts, and cost tracking breaks down spend by request, model, agent, and workflow.
Splunk Agent Observability pricing:
- Free. Included in the Splunk Observability Cloud Free Edition (up to 15 hosts), though span limits for Agent Observability aren’t published.
- Paid - From $100/month per 1.2 million spans, billed annually ($1,200/year). Includes 500 million Luna tokens and five Luna fine-tuning runs per year.
- Enterprise - Custom pricing. Adds extra Luna tokens and extended data retention.
LLM observability tools FAQ
What metrics matter for LLM inference observability (TTFT, TPOT, ITL)?
Time to first token (TTFT) measures how long a user waits for the first token, time per output token (TPOT) measures the average time to generate each token after that, and inter-token latency (ITL) measures the gap between individual tokens. Consider these metrics alongside end-to-end latency, error rates, token usage, and cost per request for a complete look at how fast your application feels and what each response costs. DigitalOcean Serverless Inference reports TTFT, end-to-end latency, error rates, and per-request cost without extra instrumentation.
Which inference platforms have built-in evaluation tools?
If your inference provider doesn’t include evaluations, you’ll need a separate tool such as Braintrust or Langfuse to score model outputs. DigitalOcean builds Evaluations into the same platform as Serverless Inference, scoring agent responses with LLM-as-a-judge metrics and billing only the token rates of the models used. DigitalOcean Signals (public preview) flags production sessions where users got frustrated or tools failed, so you know what to test next.
What is LLM observability?
LLM observability traces and measures applications built on large language models, including individual model calls and multi-step agent runs. It covers latency, token usage, cost, and output quality to help teams see why an application behaved the way it did. Unlike traditional monitoring, it looks at what the model was asked and what it returned instead of just whether the service stayed online.
How do I standardize LLM observability across multiple frameworks and SDKs?
Instrument with OpenTelemetry and follow its GenAI semantic conventions. These define standard attribute names for model, token, and request details. Libraries such as OpenLLMetry add that instrumentation for popular frameworks and model providers, and many tools on this list can ingest the resulting traces. That lets you send the same data to one or more backends and switch tools later without re-instrumenting.
Are there open-source LLM observability tools I can self-host?
Yes. Langfuse, Arize Phoenix, and Laminar can all be self-hosted, and OpenLLMetry provides open-source instrumentation that sends traces to any OpenTelemetry-compatible backend. You can run them on DigitalOcean Droplets or DigitalOcean Kubernetes, with Managed Databases handling the database layer.
Does DigitalOcean have built-in observability for LLM apps and agents?
Yes. DigitalOcean Insights (public preview) collects metrics, logs, and traces for supported DigitalOcean resources (including Managed Agents) at no additional cost during the preview. Signals flags agent sessions that went wrong, and Evaluations scores fixes before they ship.
Build, monitor, and evaluate agents in one platform with DigitalOcean
You don’t have to stitch together separate vendors for all your inference, tracing, evals, and alerting. DigitalOcean builds observability and evaluation into the same platform that runs your models and agents, so you spend less time wiring up telemetry and more time shipping. DigitalOcean Insights collects the data, Signals shows you where agents go wrong, and Evaluations tests the fix before your users see it.
Key features include:
- Metrics, logs, and traces for supported DigitalOcean resources, with no separate SDK or collector required
- Measure TTFT, end-to-end latency, error rates, token usage, and per-request cost for Serverless Inference
- Signals to flag frustrated users, failing tools, and infrastructure issues in production sessions
- Evaluations and Simulations to score changes with LLM-as-a-judge metrics and multi-turn scenarios
- No additional cost for Insights during public preview
Get started with DigitalOcean ->
This “best for” information reflects an opinion based solely on publicly available third-party commentary and user experiences shared in public forums. It does not constitute verified facts, comprehensive data, or a definitive assessment of the service.
Any references to third-party companies, trademarks, or logos in this document are for informational purposes only; all trademarks are the property of their respective owners and are used nominatively and do not imply any affiliation with, sponsorship by, or endorsement of those third parties. Comparative statements about third-party products reflect our opinion based on each provider’s publicly available documentation as of October 27, 2026, and publicly available third-party commentary. They are not a verified or definitive assessment.
About the author

Hi. My name is Jesse Sumrak. I’m a writing zealot by day and a post-apocalyptic peak bagger by night (and early-early morning). Writing is my jam and content is my peanut butter. And I make a mean PB&J.
Start building today
From GPU-powered inference and Kubernetes to managed databases and storage, get everything you need to build, scale, and deploy intelligent applications.