By Chris Ganga and Vinayak Baranwal

Introduction
By the end of this tutorial you will be able to set breakpoints, step through Go code, inspect variables, and debug tests in Visual Studio Code using the Go extension and Delve.
You will install the Go extension and Delve (or use the extension’s automatic install), create a launch.json configuration, then run through breakpoints, conditional breakpoints, and debugging a test function.
Prerequisites
To complete this tutorial, you need:
- Basic knowledge of Go. For more, see the How To Code in Go series.
- Visual Studio Code installed.
- The Go extension for VS Code installed.
Key Takeaways
- Install the Go extension for VS Code and Delve (manually with
go install github.com/go-delve/delve/cmd/dlv@latestor via the extension’s first-run prompt). - Use a full
launch.jsonwith"program":"${workspaceFolder}"and"configurations"(plural). Avoid deprecated"${workspaceRoot}"and single-file-only"${fileDirname}"for multi-package projects. - Set breakpoints in the gutter, use F5 to continue and F10 / F11 / Shift+F11 to step over, into, or out. Use the Watch panel for expressions.
- Conditional breakpoints stop only when their expression is true; use Edit Breakpoint to add a condition.
- For tests, use debug test above the test function; the same Delve backend runs both application and test debugging.
Note: Delve supports Go 1.18 and later. Ensure your Go version meets this for debugging.
Open any .go file in VS Code. The status bar may prompt you to Install Analysis Tools. Click that link to install the Go packages the extension needs.
Step 1: Installing the Go Extension and Delve
Delve is the debugger the Go extension uses. Go’s default go run does not keep the symbol table and line information needed for interactive debugging, so Delve is required for breakpoints and stepping.
You can install Delve in two ways.
Option A: Let the Go extension install Delve
When you start a debug session (e.g., press F5) for the first time without dlv in your PATH, the Go extension can prompt you to install Delve. Accept the prompt; it will run the install and place the dlv binary in your Go bin directory.
Option B: Install Delve manually
Run:
- go install github.com/go-delve/delve/cmd/dlv@latest
When downloading, you may see output similar to:
go: downloading github.com/go-delve/delve v1.x.x
go: downloading github.com/some/dependency v0.x.x
On a cached or already-installed system, go install produces no output on success.
Verify installation:
- dlv version
Delve version: 1.x.x
Ensure $GOPATH/bin or $HOME/go/bin is in your PATH so the dlv command is found. For platform-specific steps, see Delve installation.
Step 2: Creating a Sample App
This section uses two examples: a Go program that outputs JSON, and a test you will debug in VS Code.
Create a file main.go:
- nano main.go
Add the following content:
package main

import (
    "encoding/json"
    "fmt"
    "log"
)

// Avenger represents a single hero
type Avenger struct {
    RealName string `json:"real_name"`
    HeroName string `json:"hero_name"`
    Planet   string `json:"planet"`
    Alive    bool   `json:"alive"`
}

func (a *Avenger) isAlive() {
    a.Alive = true
}

func main() {
    avengers := []Avenger{
        {
            RealName: "Dr. Bruce Banner",
            HeroName: "Hulk",
            Planet:   "Midgard",
        },
        {
            RealName: "Tony Stark",
            HeroName: "Iron Man",
            Planet:   "Midgard",
        },
        {
            RealName: "Thor Odinson",
            HeroName: "Thor",
            Planet:   "Midgard",
        },
    }

    avengers[1].isAlive()

    jsonBytes, err := json.Marshal(avengers)
    if err != nil {
        log.Fatalln(err)
    }
    fmt.Println(string(jsonBytes))
}
The code defines an Avenger struct, builds a slice, marks one Avenger as alive, marshals to JSON, and prints it.
Run the app:
- go run main.go
[{"real_name":"Dr. Bruce Banner","hero_name":"Hulk","planet":"Midgard","alive":false},{"real_name":"Tony Stark","hero_name":"Iron Man","planet":"Midgard","alive":true},{"real_name":"Thor Odinson","hero_name":"Thor","planet":"Midgard","alive":false}]
Step 3: Debugging with Breakpoints
To debug, you need a launch configuration. In the left sidebar, click the Run and Debug (bug) icon, then click the gear icon to create a configuration.
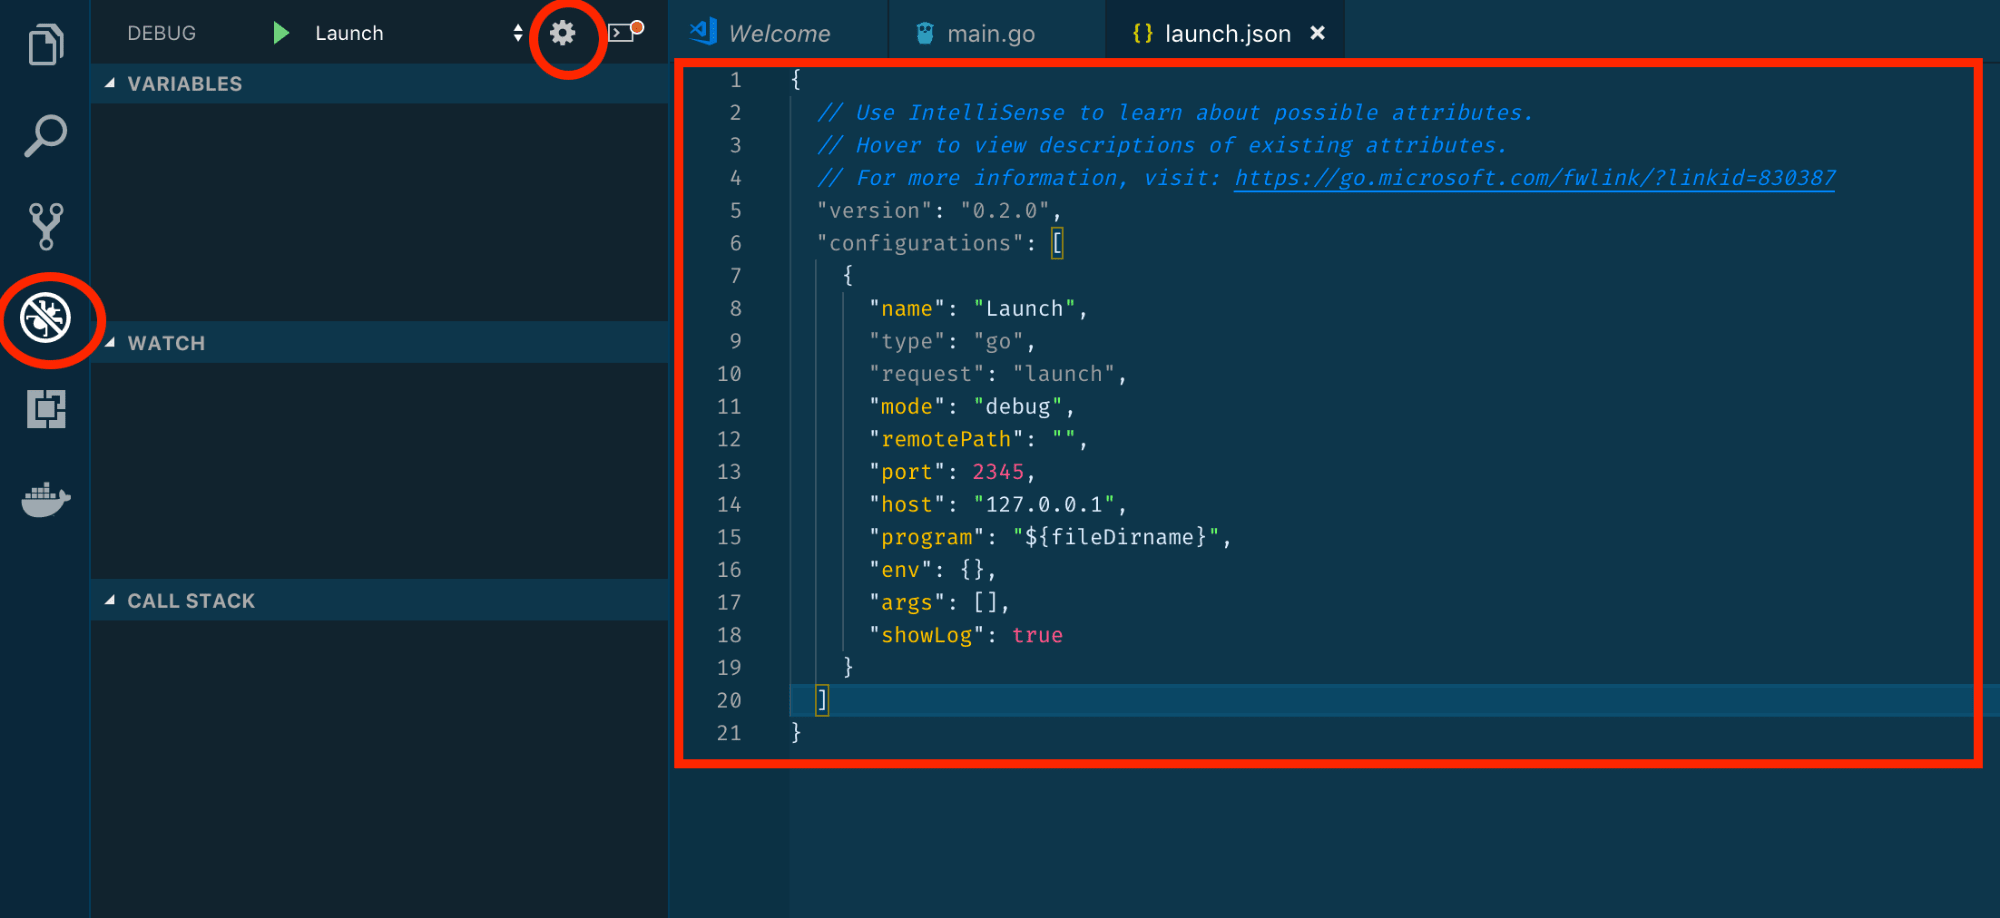
Note: This screenshot shows an older auto-generated launch.json with "program":"${fileDirname}" and no "console" key. The current Go extension generates "program":"${workspaceFolder}" by default. Replace "${fileDirname}" with "${workspaceFolder}" and add "console":"integratedTerminal" to match the configuration in this tutorial.
A .vscode/launch.json file is created. Use a full configuration so the debugger targets your workspace correctly.
Note: Do not use the deprecated "${workspaceRoot}". Use"${workspaceFolder}" so paths resolve correctly in VS Code.
Replace the contents of .vscode/launch.json with this complete scaffold:
{
  "version": "0.2.0",
  "configurations": [
    {
      "name": "Launch",
      "type": "go",
      "request": "launch",
      "mode": "auto",
      "program": "${workspaceFolder}",
      "env": {},
      "args": [],
      "showLog": true,
      "console": "integratedTerminal"
    }
  ]
}
Note: The screenshot above shows an older version of launch.json with "program": "${fileDirname}". The current Go extension generates"program": "${workspaceFolder}" by default. "${fileDirname}" targets the directory of the currently open file, which works for single-file projects but breaks for multi-package layouts. Use "${workspaceFolder}" for all new projects.
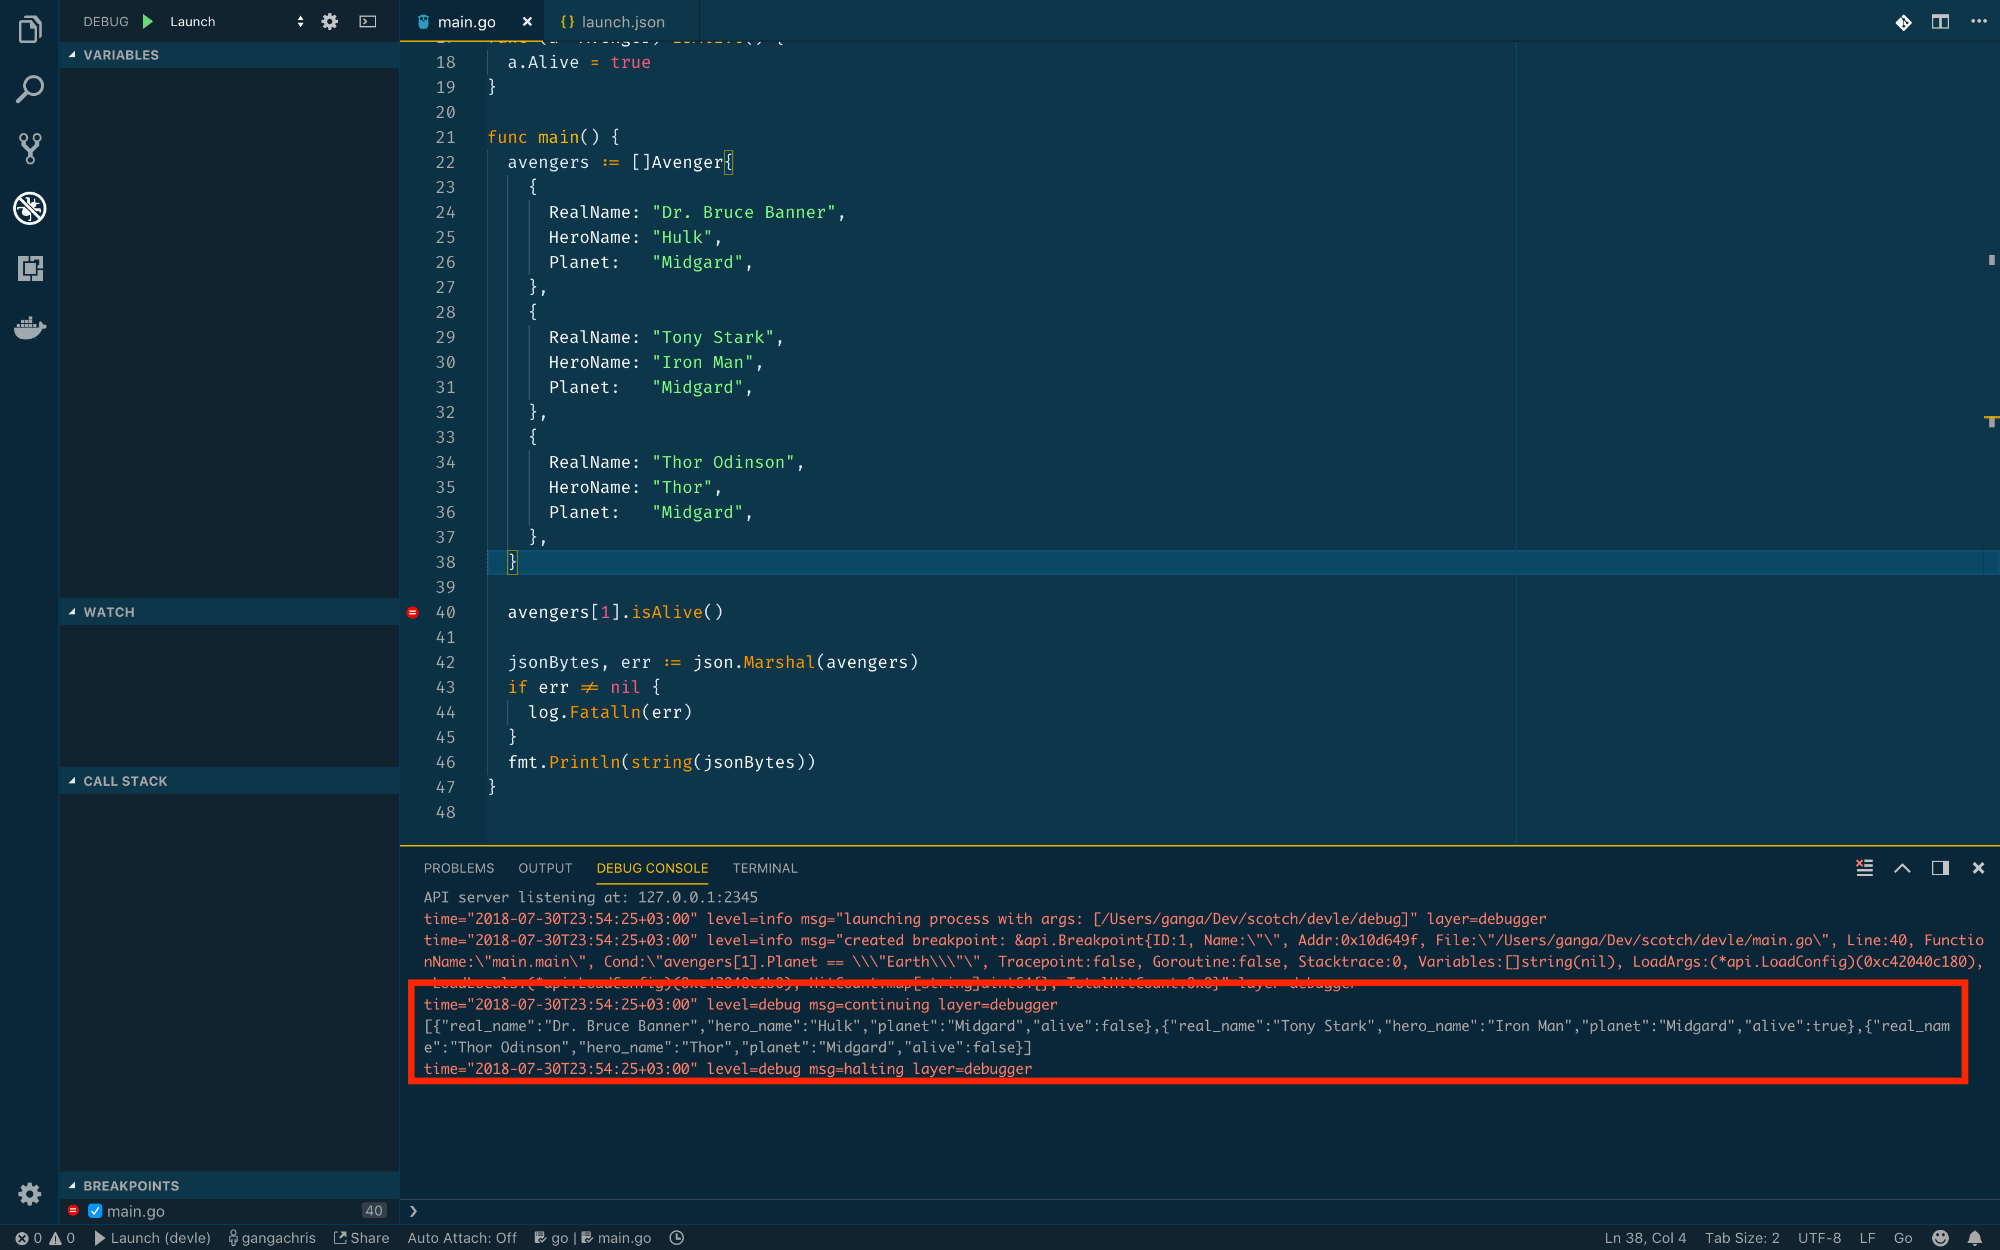
Add a breakpoint on line 21 (func main()) by clicking in the gutter to the left of the line number. A red dot appears.
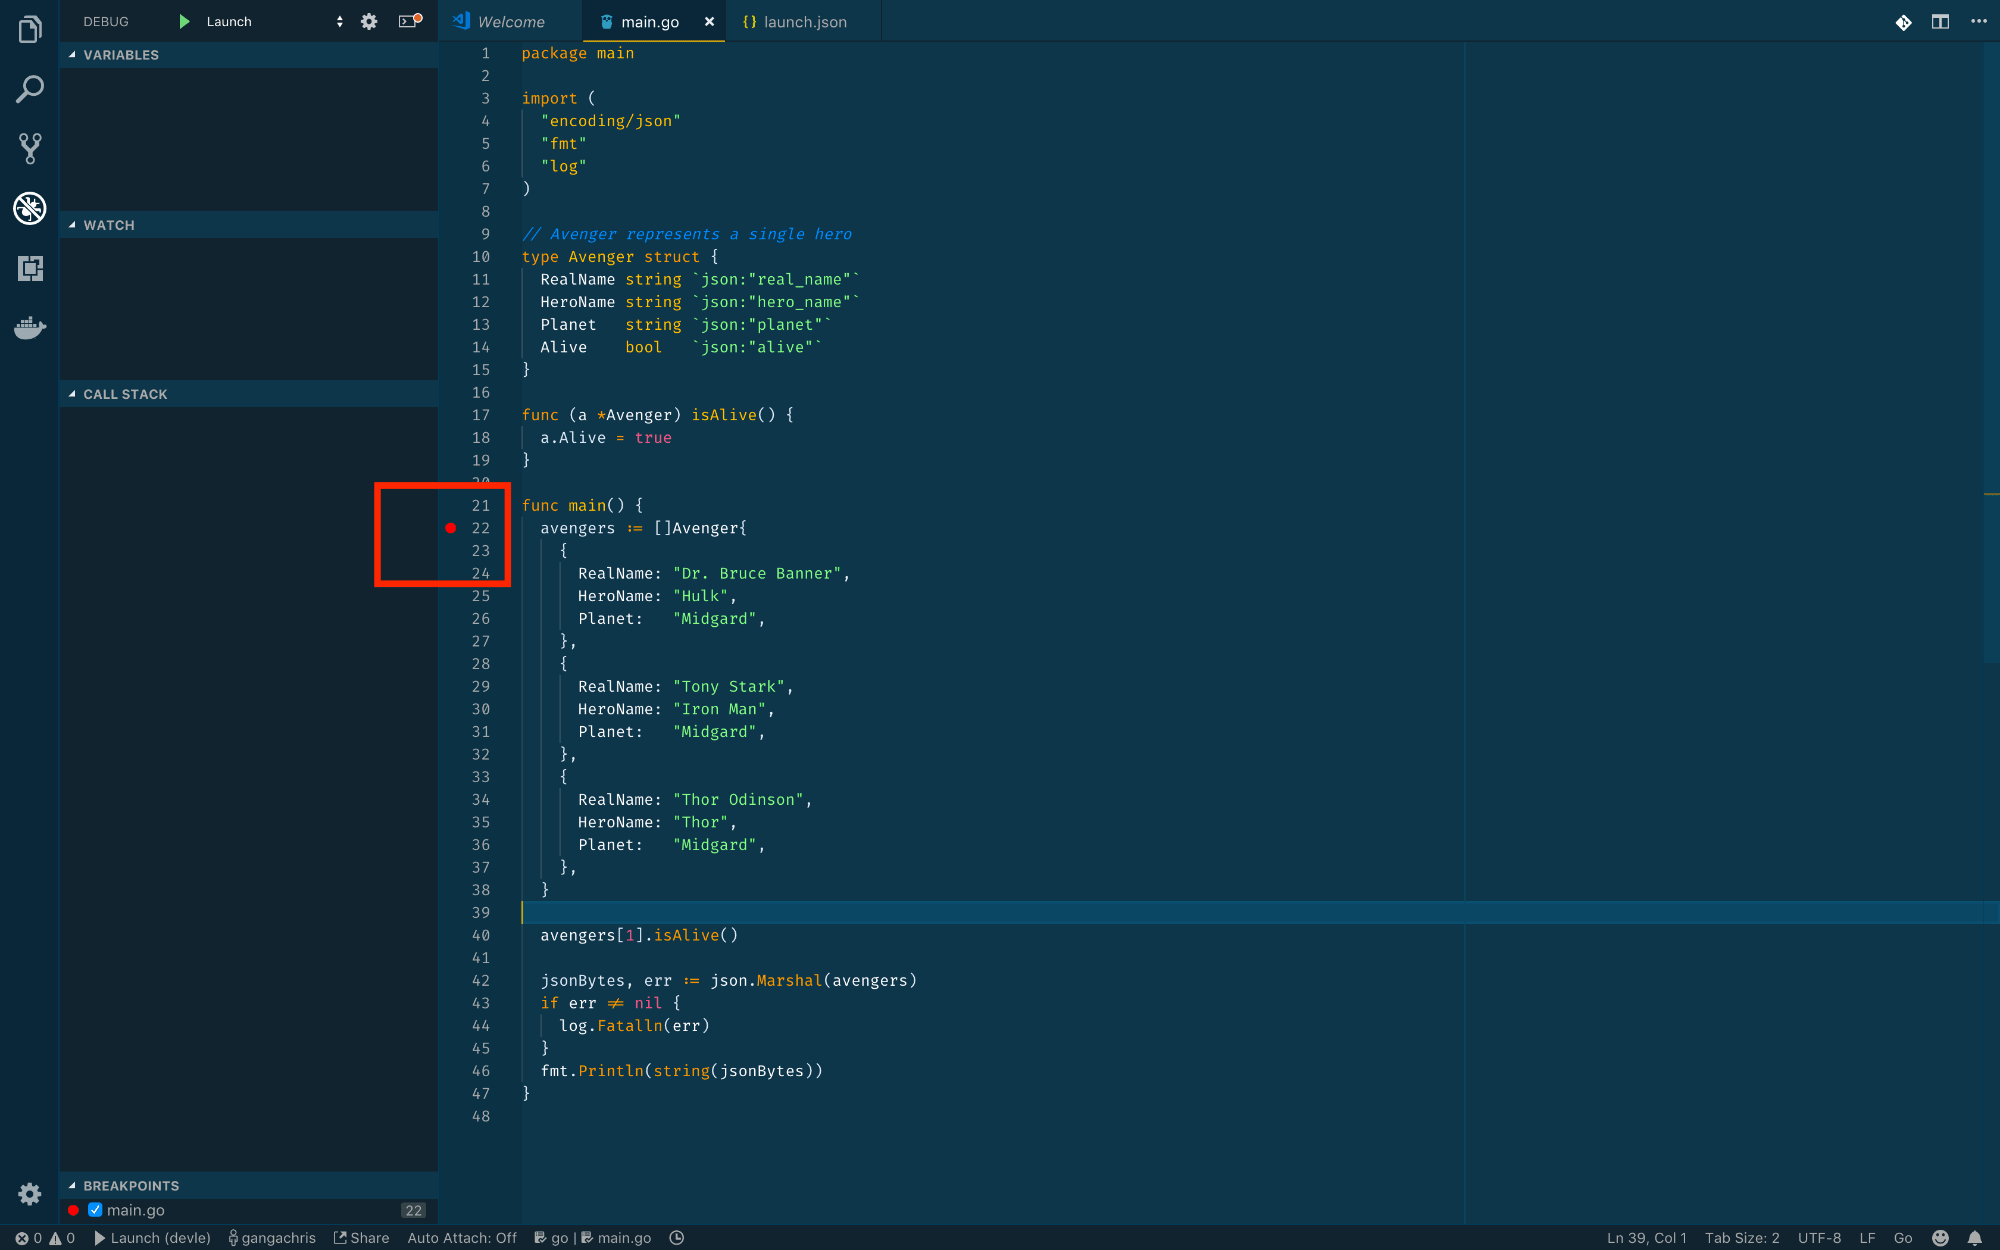
Image note: The screenshot shows the breakpoint on line 22 (avengers := []Avenger{). In this tutorial, the breakpoint is set on line 21 (func main()). The behavior is identical: the debugger pauses before executing the marked line. Set your breakpoint on whichever line you want execution to pause before.
Press F5 or click the green Launch button in the Run and Debug view to start debugging.
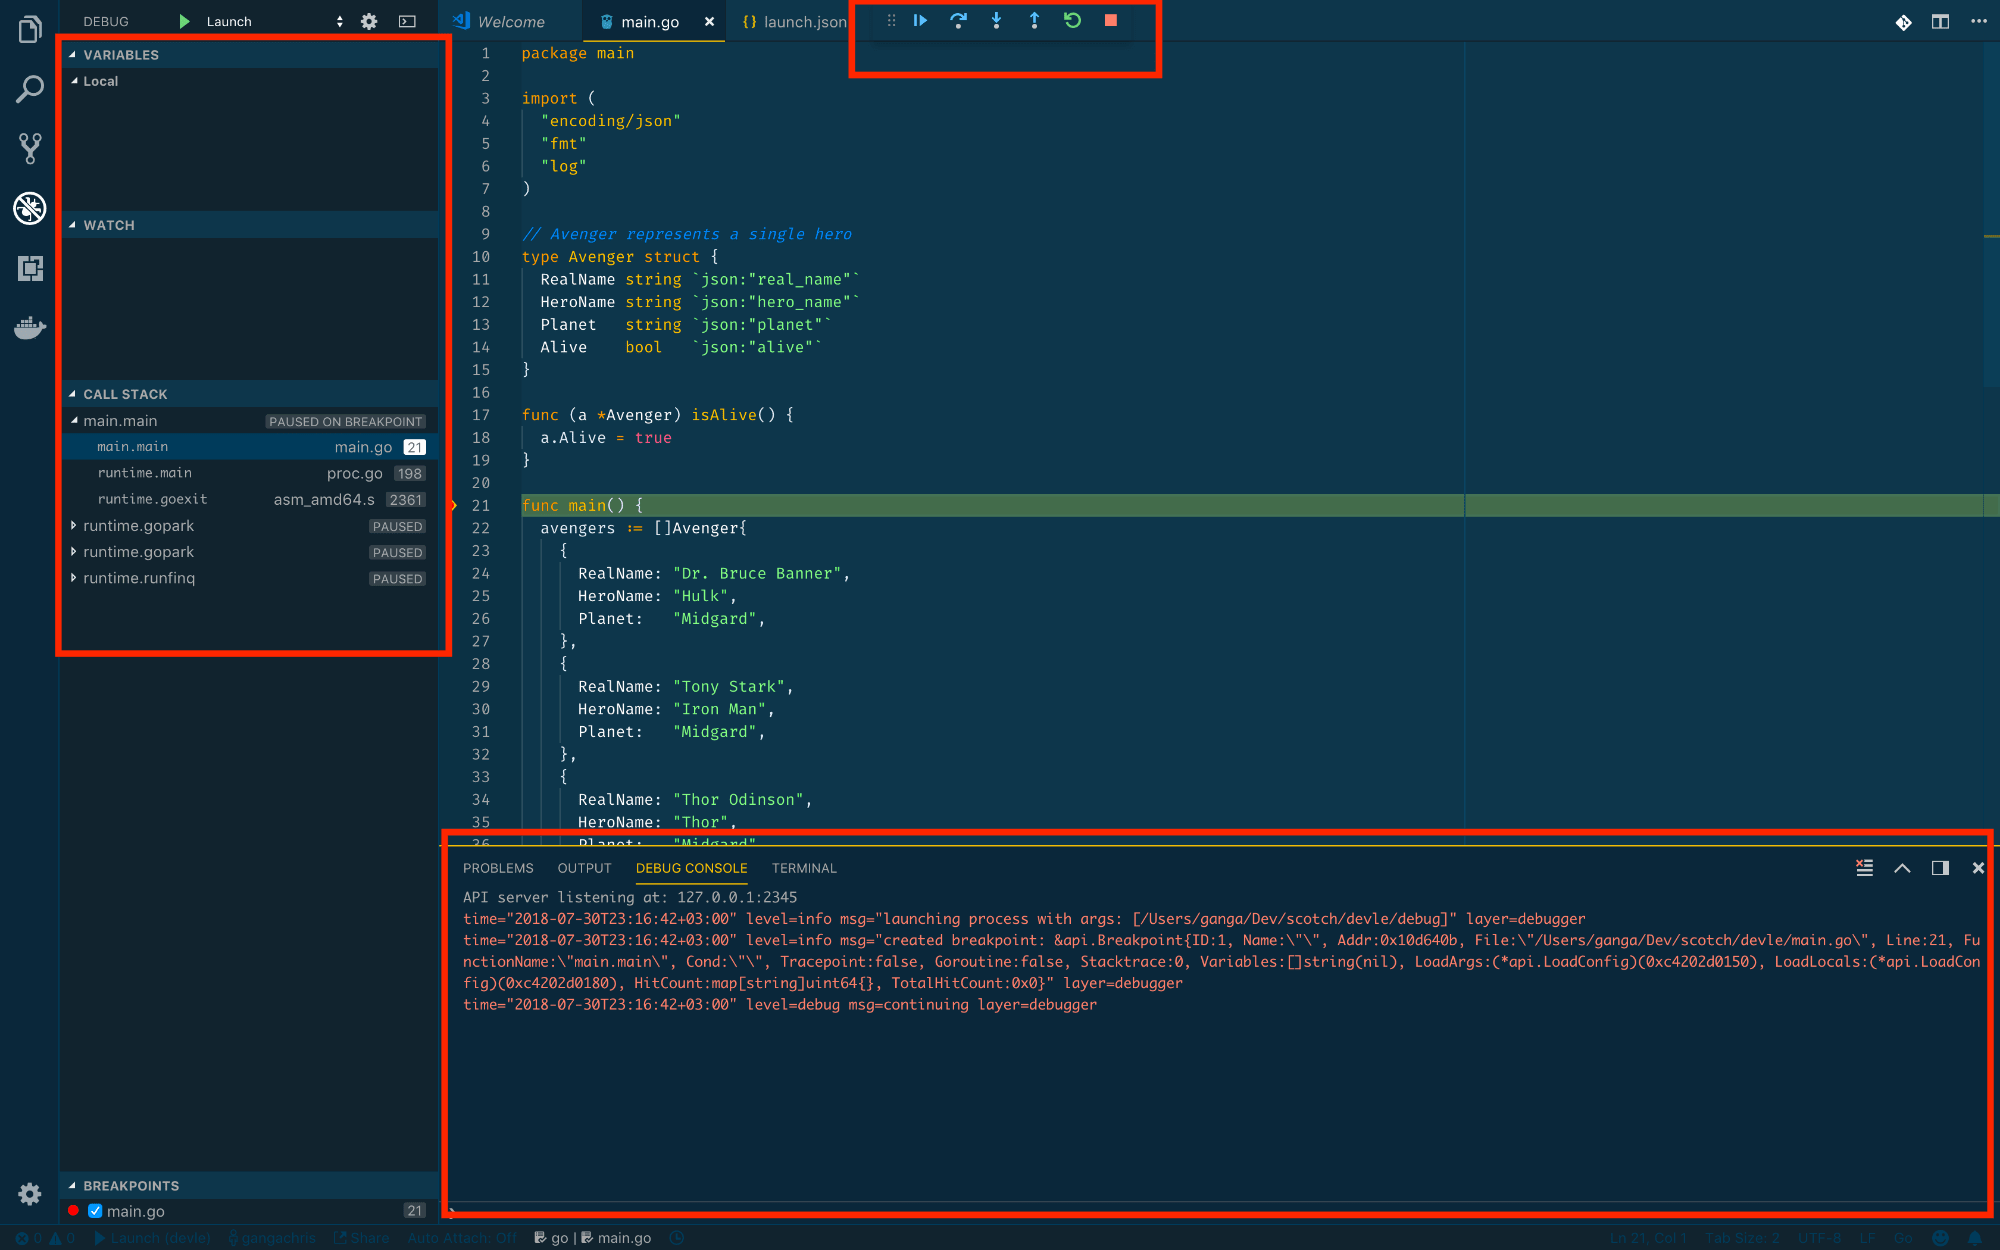
Image note: The Debug Console output in this screenshot is from an earlier Delve version. The log format has changed in recent releases, but the key line to look for is API server listening at: 127.0.0.1:2345, which confirms Delve started successfully.
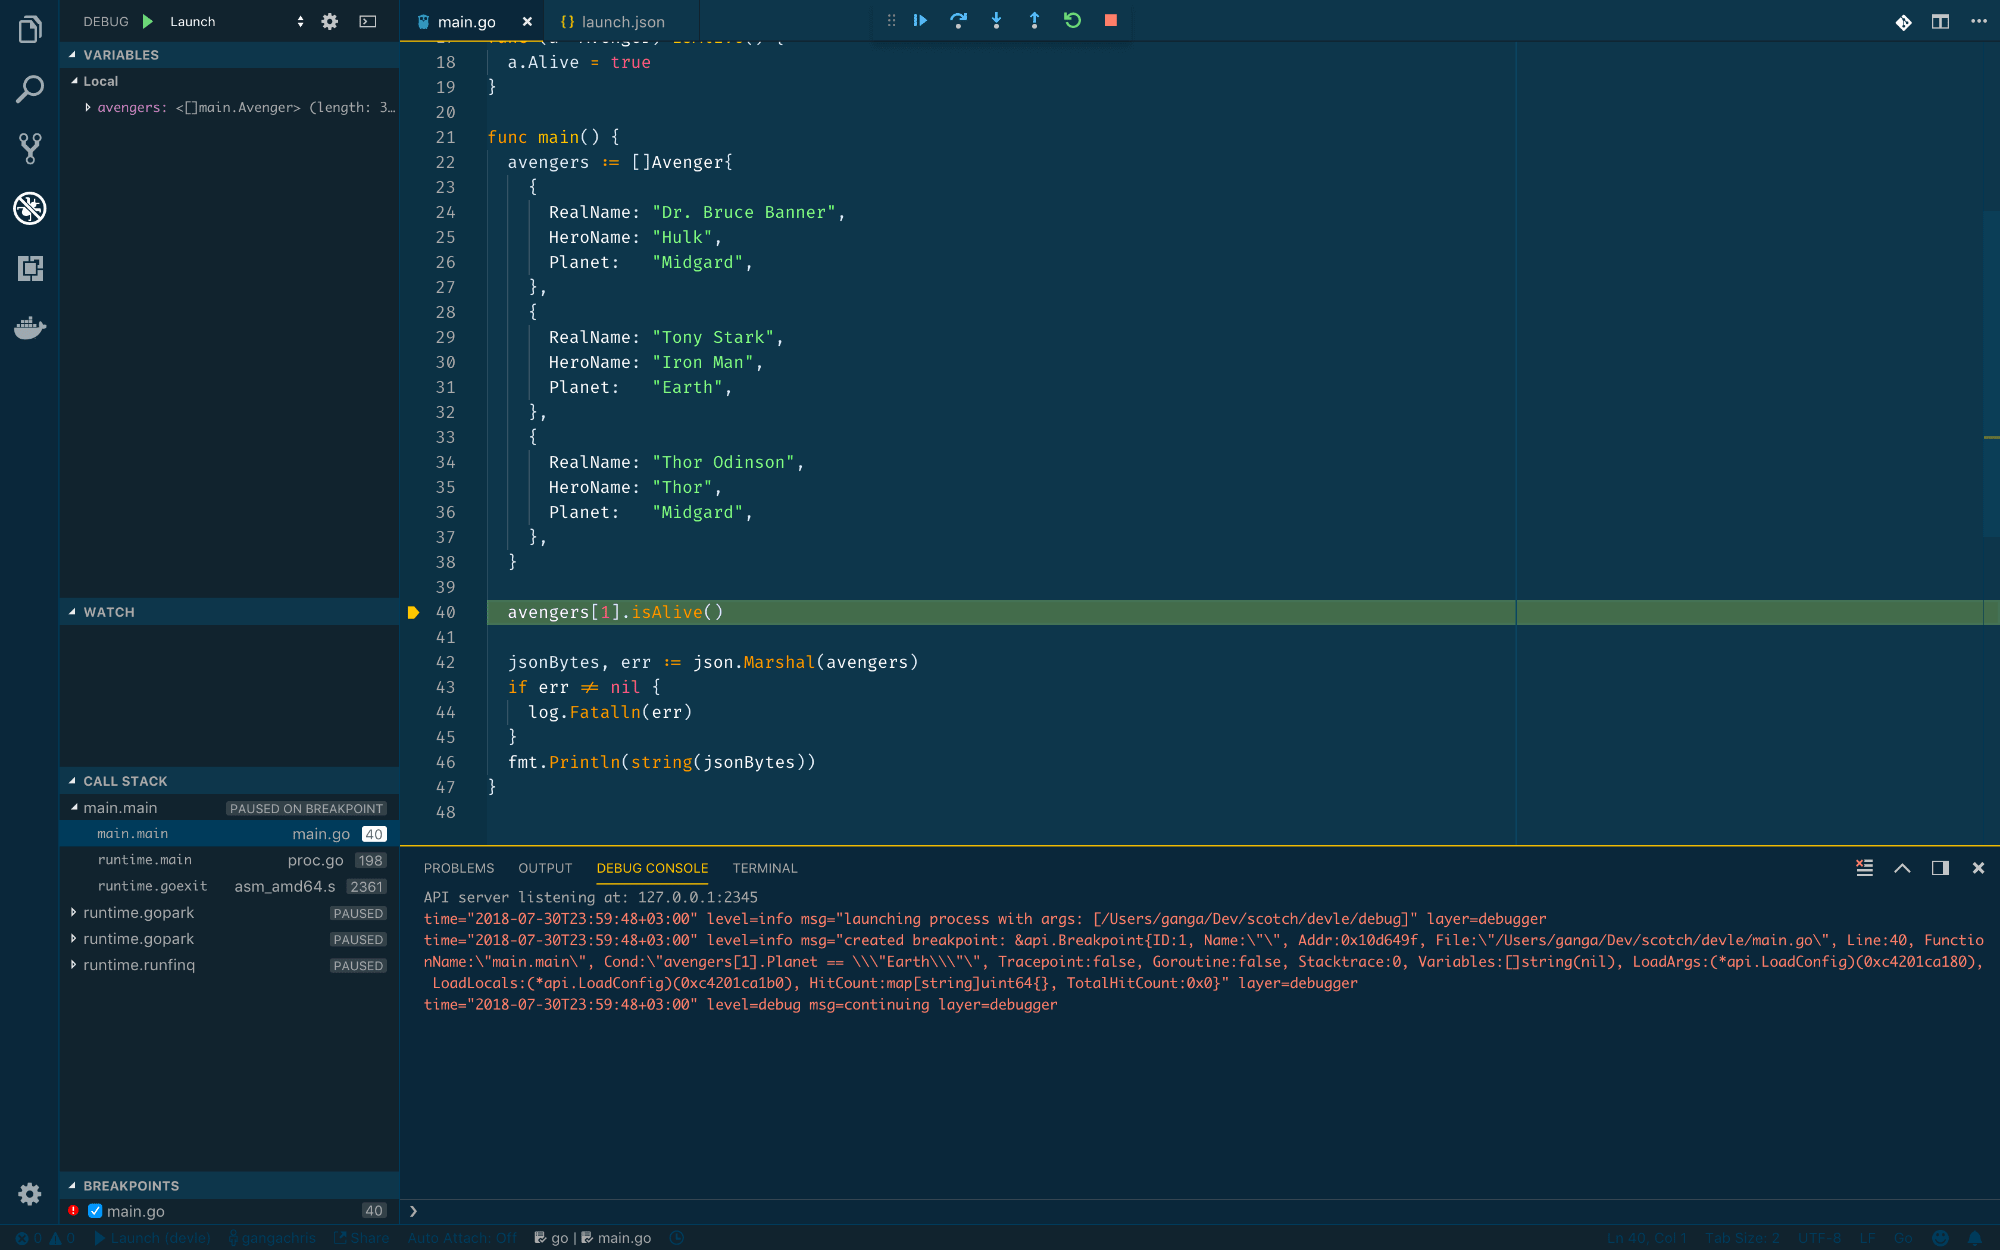
Click Step Over on the debug toolbar (or press F10) repeatedly. Execution advances one line at a time and eventually reaches line 40.
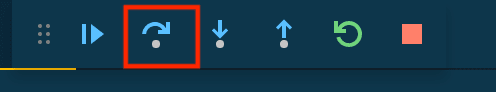
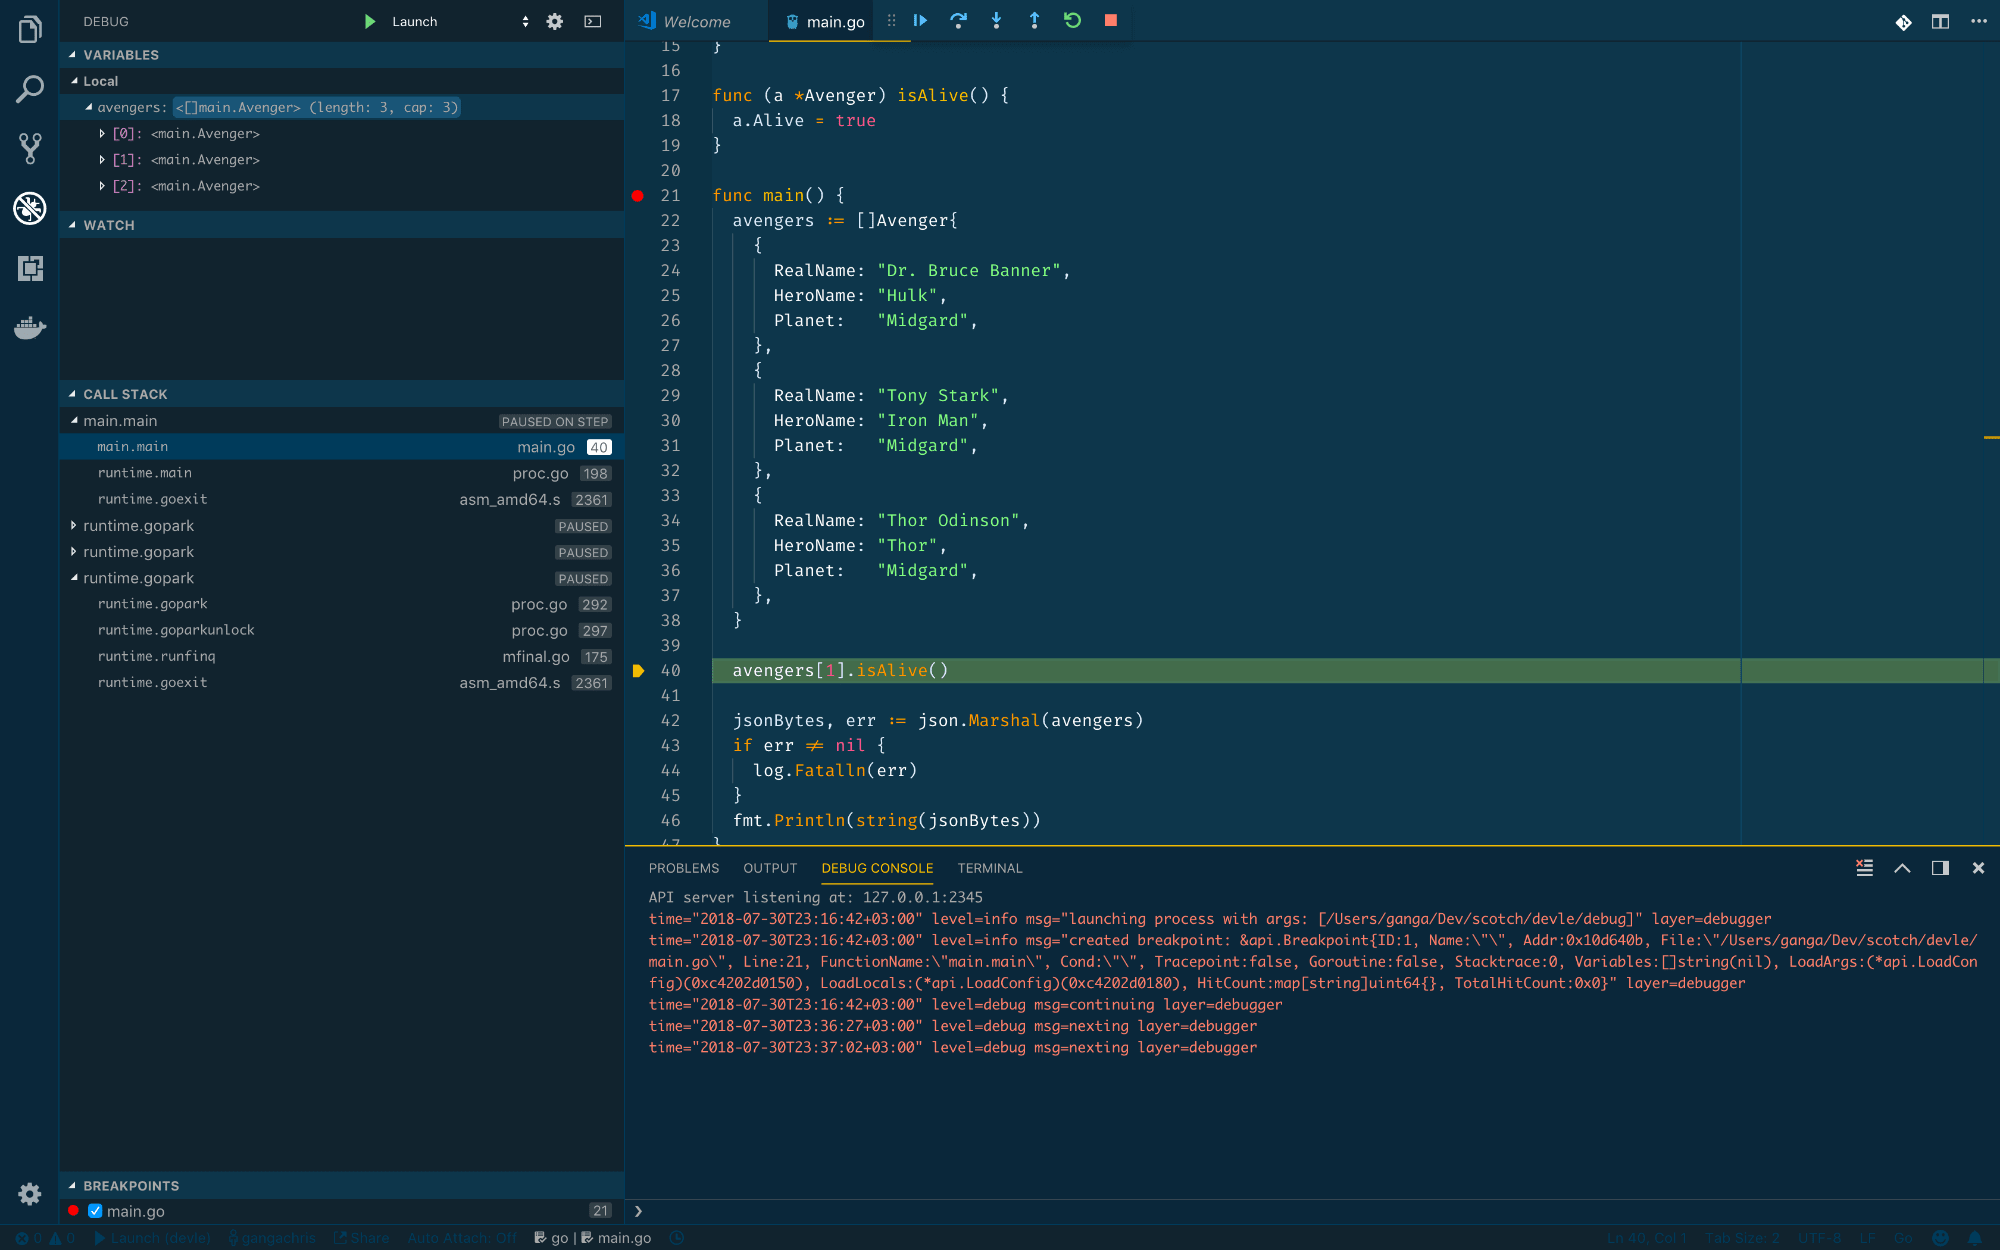
Image note: The Debug Console timestamps in this screenshot reflect a historical session. The variable state and line positions shown are accurate and match the current behavior of the Go extension and Delve.
The Run and Debug sidebar shows the state at the current line: variables and call stack.
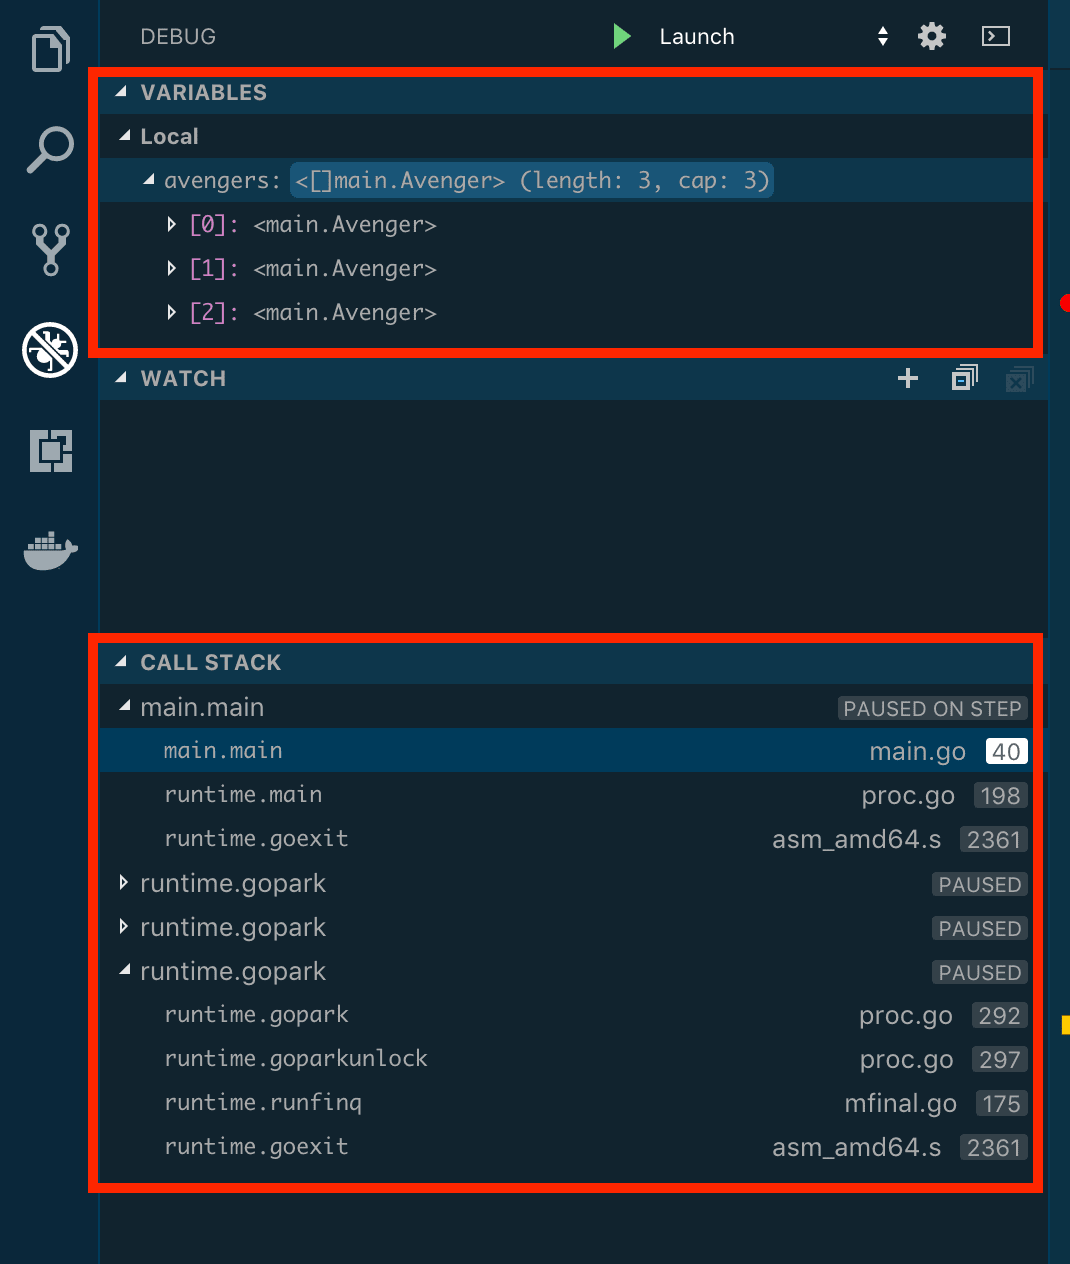
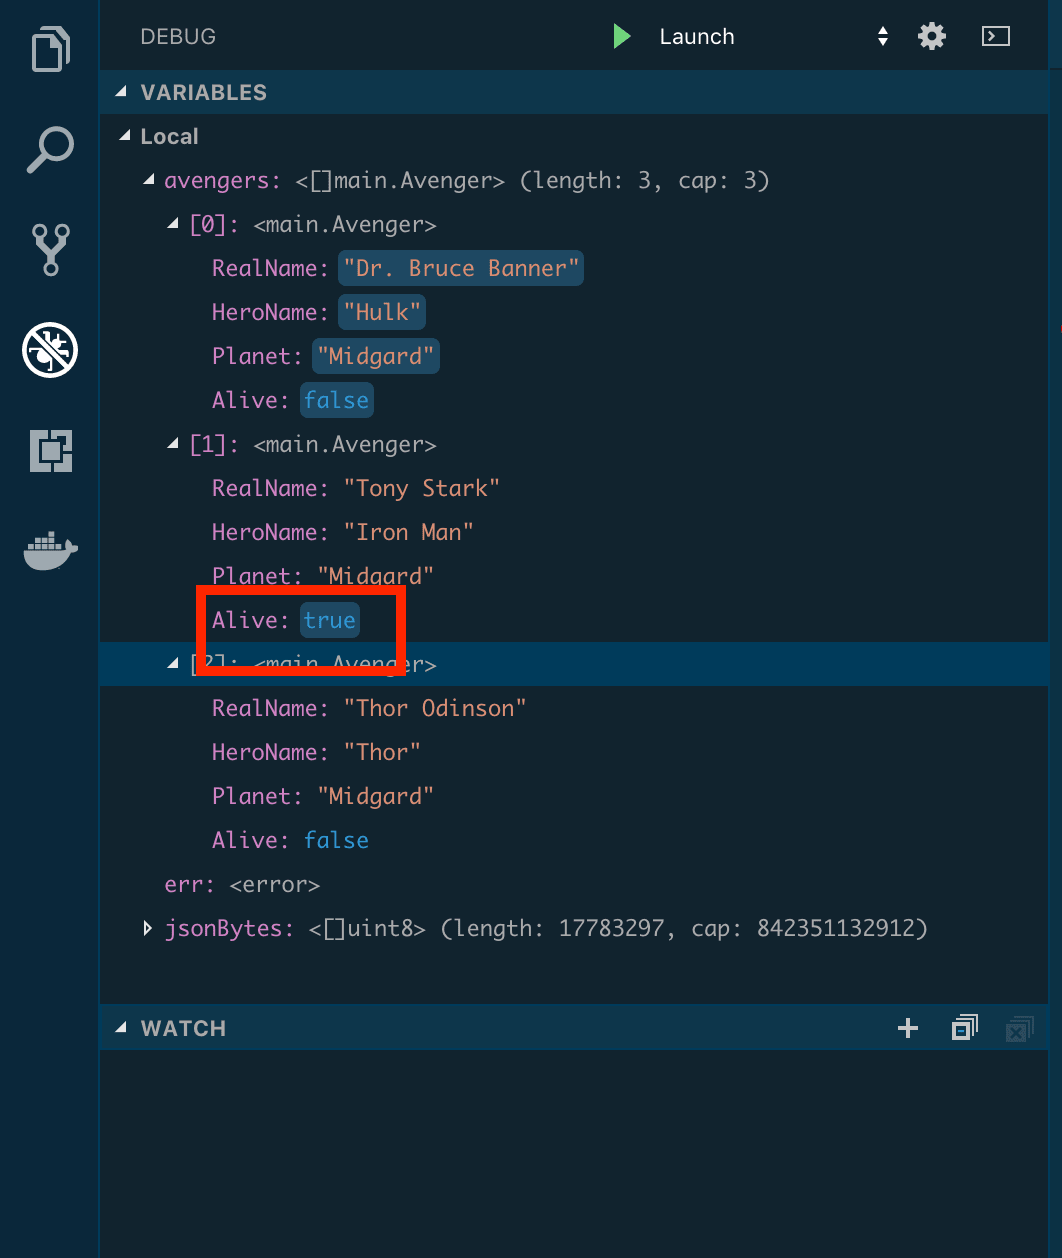
In Variables you see the values at that point. The call stack shows the current function (main) and line. As you keep stepping, you can confirm that after the relevant line, avengers[1] (Tony Stark) has Alive set to true.
Debugger Actions Reference
Use the toolbar or shortcuts to control execution:
| Debugger Action | Keyboard Shortcut | When to Use |
|---|---|---|
| Continue | F5 | Resume execution to the next breakpoint |
| Step Over | F10 | Execute the current line, stay in the current function |
| Step Into | F11 | Enter the function called on the current line |
| Step Out | Shift+F11 | Finish the current function and return to the caller |
| Stop | Shift+F5 | End the debug session |
Step Over runs the current line without entering function calls. Step Into stops inside the function invoked on that line (e.g., avengers[1].isAlive()). Step Out runs until the current function returns.
Watching Variables and the Watch Panel
The Watch panel evaluates expressions each time execution pauses. Use it to track specific values without scrolling Variables.
To add a watch: open the Watch section in the Run and Debug sidebar, click +, and enter an expression. For example, while paused in main with avengers in scope, add:
avengers[1].Alive
As you step, the Watch panel shows the current value (e.g., false before avengers[1].isAlive() and true after). You can add any valid Go expression that is in scope at the current frame.
Step 4: Adding Conditional Breakpoints
Conditional breakpoints only stop when a given expression is true. Right-click in the gutter next to a line and choose Edit Breakpoint (or Add Conditional Breakpoint if there is no breakpoint yet).
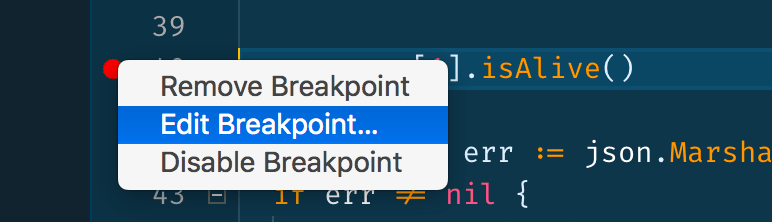
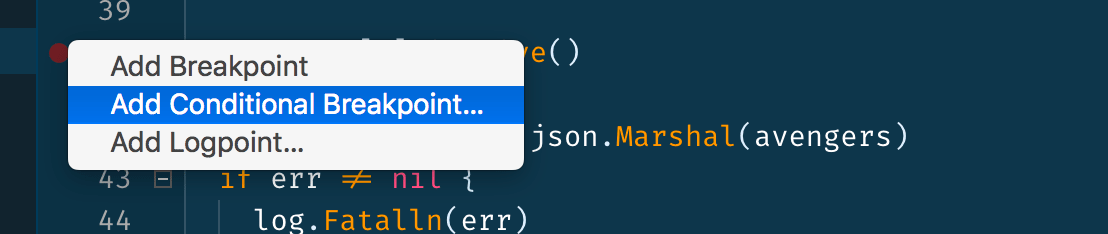
On line 40 (avengers[1].isAlive()), add a condition such as avengers[1].Planet == "Earth".
![Adding condition 'avengers[1].Planet == "Earth"'](https://assets.digitalocean.com/articles/debugging-go-code-with-visual-studio-code/10.png)
Launch with F5. The program runs without stopping at that breakpoint because the condition is false (planet is "Midgard"). Output appears in the Debug Console.
Change Tony Stark’s planet to "Earth" in main.go:
{
    RealName: "Tony Stark",
    HeroName: "Iron Man",
    Planet:   "Earth",
},
Run the debugger again with F5. Execution stops at the conditional breakpoint and the JSON output is not yet printed in the Debug Console.
Step 5: Debugging Test Functions
You can run and debug Go tests from the editor. Add a helper and a test in the same package.
Add this function to main.go:
func add(a, b int) int {
    return a + b
}
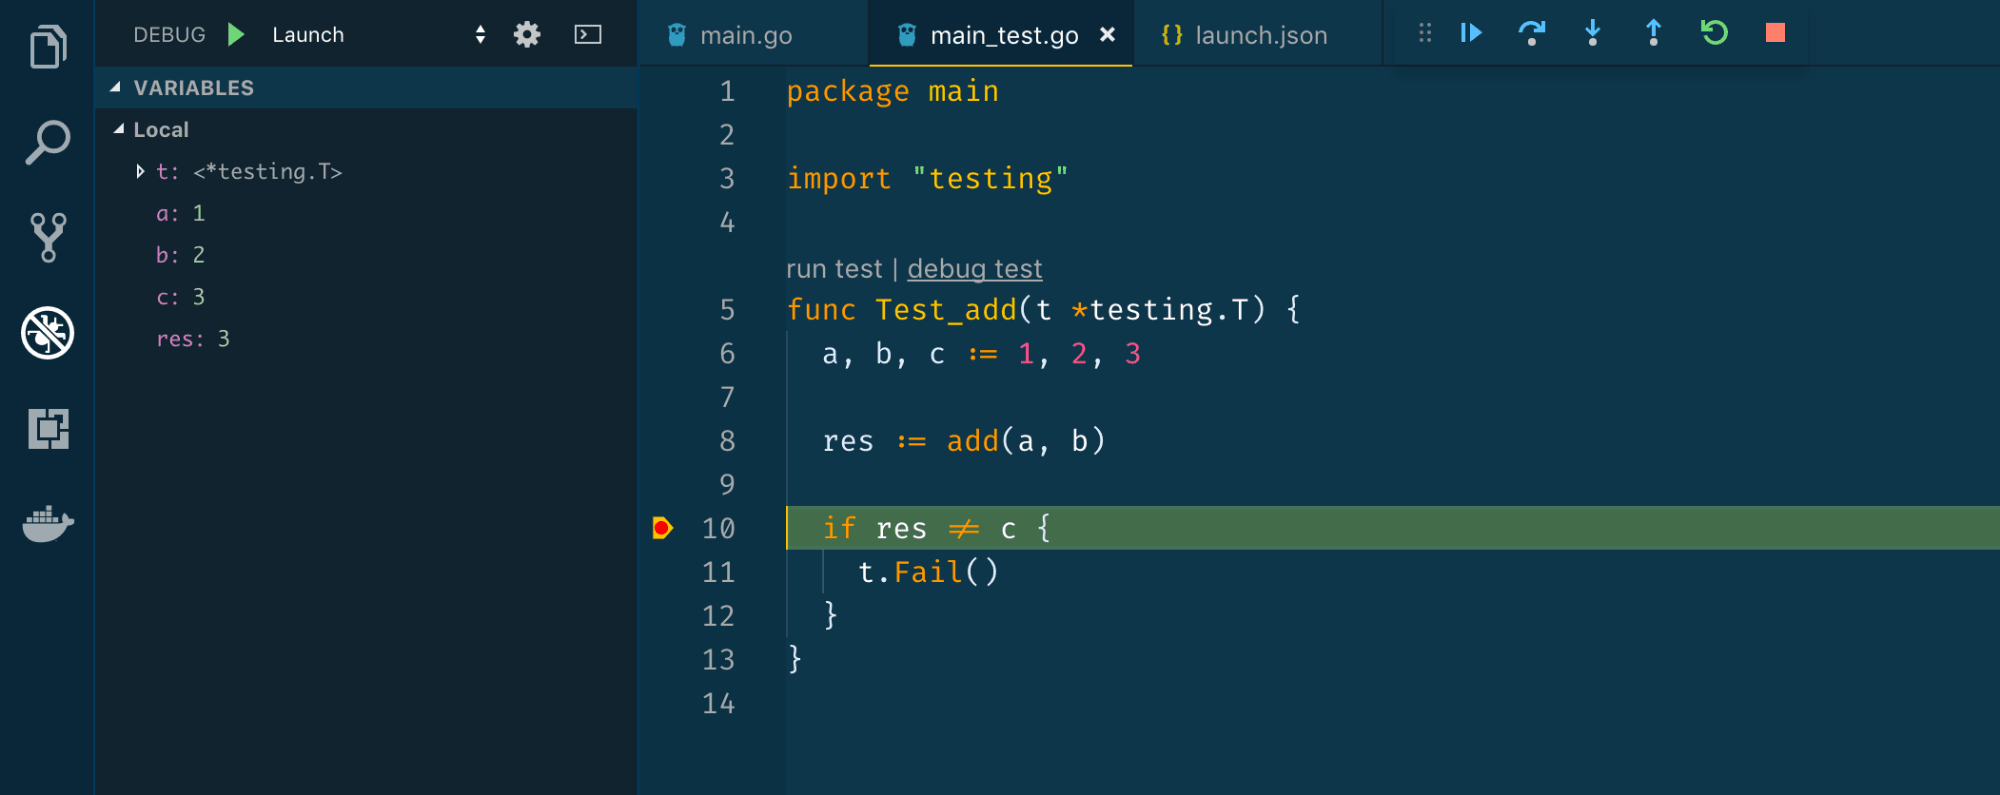
Create main_test.go in the same directory:
package main

import "testing"

func Test_add(t *testing.T) {
    a, b, c := 1, 2, 3

    res := add(a, b)

    if res != c {
        t.Fail()
    }
}
With the Go extension installed, you see run test and debug test above the test function.
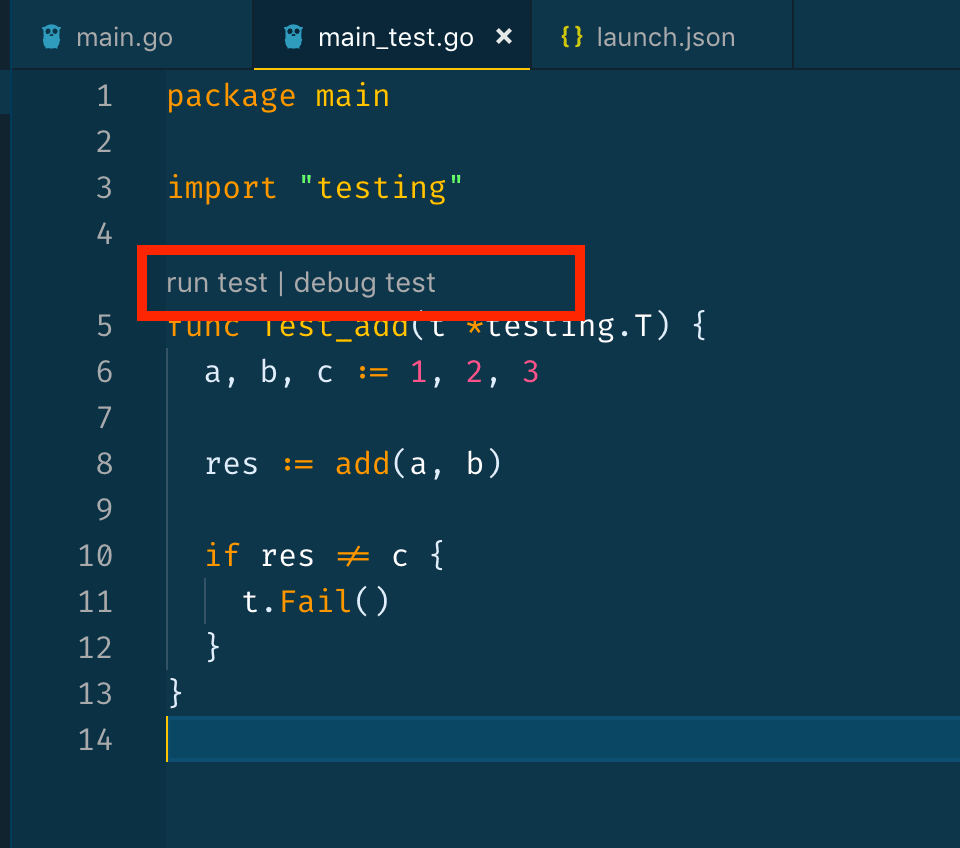
Click run test to run the test and see results in the Output panel. To debug, add a breakpoint on line 10 (if res != c) and click debug test. The debugger starts and you can step and inspect variables as in the main program.
Troubleshooting Common Errors
1. Delve Not Found
If you encounter the error message:
could not launch process: exec: "dlv": executable file not found in $PATH
it means the dlv binary is not available in your PATH. To fix this, add the directory where Go installs binaries ($GOPATH/bin or $HOME/go/bin) to your PATH. On Unix-like systems, you can add the following line to your shell profile:
- export PATH=$PATH:$(go env GOPATH)/bin
2. Breakpoint Not Binding (Gray or Hollow Circle)
A gray or hollow breakpoint icon generally means that the running binary was not built with debugging symbols. Make sure your launch.json configuration includes "mode": "auto" so that the extension compiles your code with symbols. Avoid attaching to binaries built with go build unless you used -gcflags="all=-N -l" to include debug info, and always run your code through the debugger for breakpoints to work.
3. F5 Starts Then Exits Immediately
If pressing F5 (Start Debugging) causes the program to start and then exit immediately, check the "program" path in your launch.json. It should point to a directory containing main.go (or your main package), not to a single file. Use "${workspaceFolder}" if main.go is at the workspace root, or specify a directory like "${workspaceFolder}/cmd/myapp" if your main package is inside a subdirectory.
FAQ
Do I need to install Delve separately if I use the Go extension?
You can install Delve yourself with go install github.com/go-delve/delve/cmd/dlv@latest and ensure dlv is on your PATH. Alternatively, the Go extension can install Delve when you first start a debug session (F5) if it detects that dlv is missing.
Can I debug Go tests without the VS Code Go extension?
Yes. You can run Delve from the terminal, for example: dlv test -- -test.run Test_add. The Go extension adds the debug test button and integrates the same Delve backend into the VS Code UI.
What is the difference between dlv debug and VS Code’s debugger?
dlv debug is the command-line interface to Delve. VS Code’s Go debugger uses Delve under the hood and talks to it via the DAP (Debug Adapter Protocol). The behavior (breakpoints, stepping, variable inspection) is the same; VS Code provides the UI and keybindings.
Why does my breakpoint appear as a hollow circle instead of a solid red dot?
A hollow or gray breakpoint means it is not yet bound. Common causes: the binary was built without debug symbols (e.g., an optimized release build), or the debug session has not started. Use "mode": "auto" in launch.json so the extension builds with debug info, and start the session with F5.
Conclusion
You configured the Go extension and Delve, created a launch.json, and used breakpoints, stepping, the Watch panel, and conditional breakpoints to debug a sample app and a test. The same Delve engine is available from the terminal via dlv debug for environments without a GUI; see Delve CLI usage for command-line options.
Thanks for learning with the DigitalOcean Community. Check out our offerings for compute, storage, networking, and managed databases.
About the author(s)
Building future-ready infrastructure with Linux, Cloud, and DevOps. Full Stack Developer & System Administrator. Technical Writer @ DigitalOcean | GitHub Contributor | Passionate about Docker, PostgreSQL, and Open Source | Exploring NLP & AI-TensorFlow | Nailed over 50+ deployments across production environments.
Still looking for an answer?
This textbox defaults to using Markdown to format your answer.
You can type !ref in this text area to quickly search our full set of tutorials, documentation & marketplace offerings and insert the link!
Most png graphics of the page do not render, and their URL return “All access to this object has been disabled”. example: https://cdn.scotch.io/303/kXxTp955RTK6AJogAWTa_Screen Shot 2018-07-30 at 23.39.30.png
 This work is licensed under a Creative Commons Attribution-NonCommercial- ShareAlike 4.0 International License.
Become a contributor for community
Get paid to write technical tutorials and select a tech-focused charity to receive a matching donation.

DigitalOcean Documentation
Full documentation for every DigitalOcean product.

Resources for startups and AI-native businesses
The Wave has everything you need to know about building a business, from raising funding to marketing your product.
The developer cloud
Scale up as you grow — whether you're running one virtual machine or ten thousand.

Start building today
From GPU-powered inference and Kubernetes to managed databases and storage, get everything you need to build, scale, and deploy intelligent applications.
