By Shamim Raashid and Anish Singh Walia

Introduction
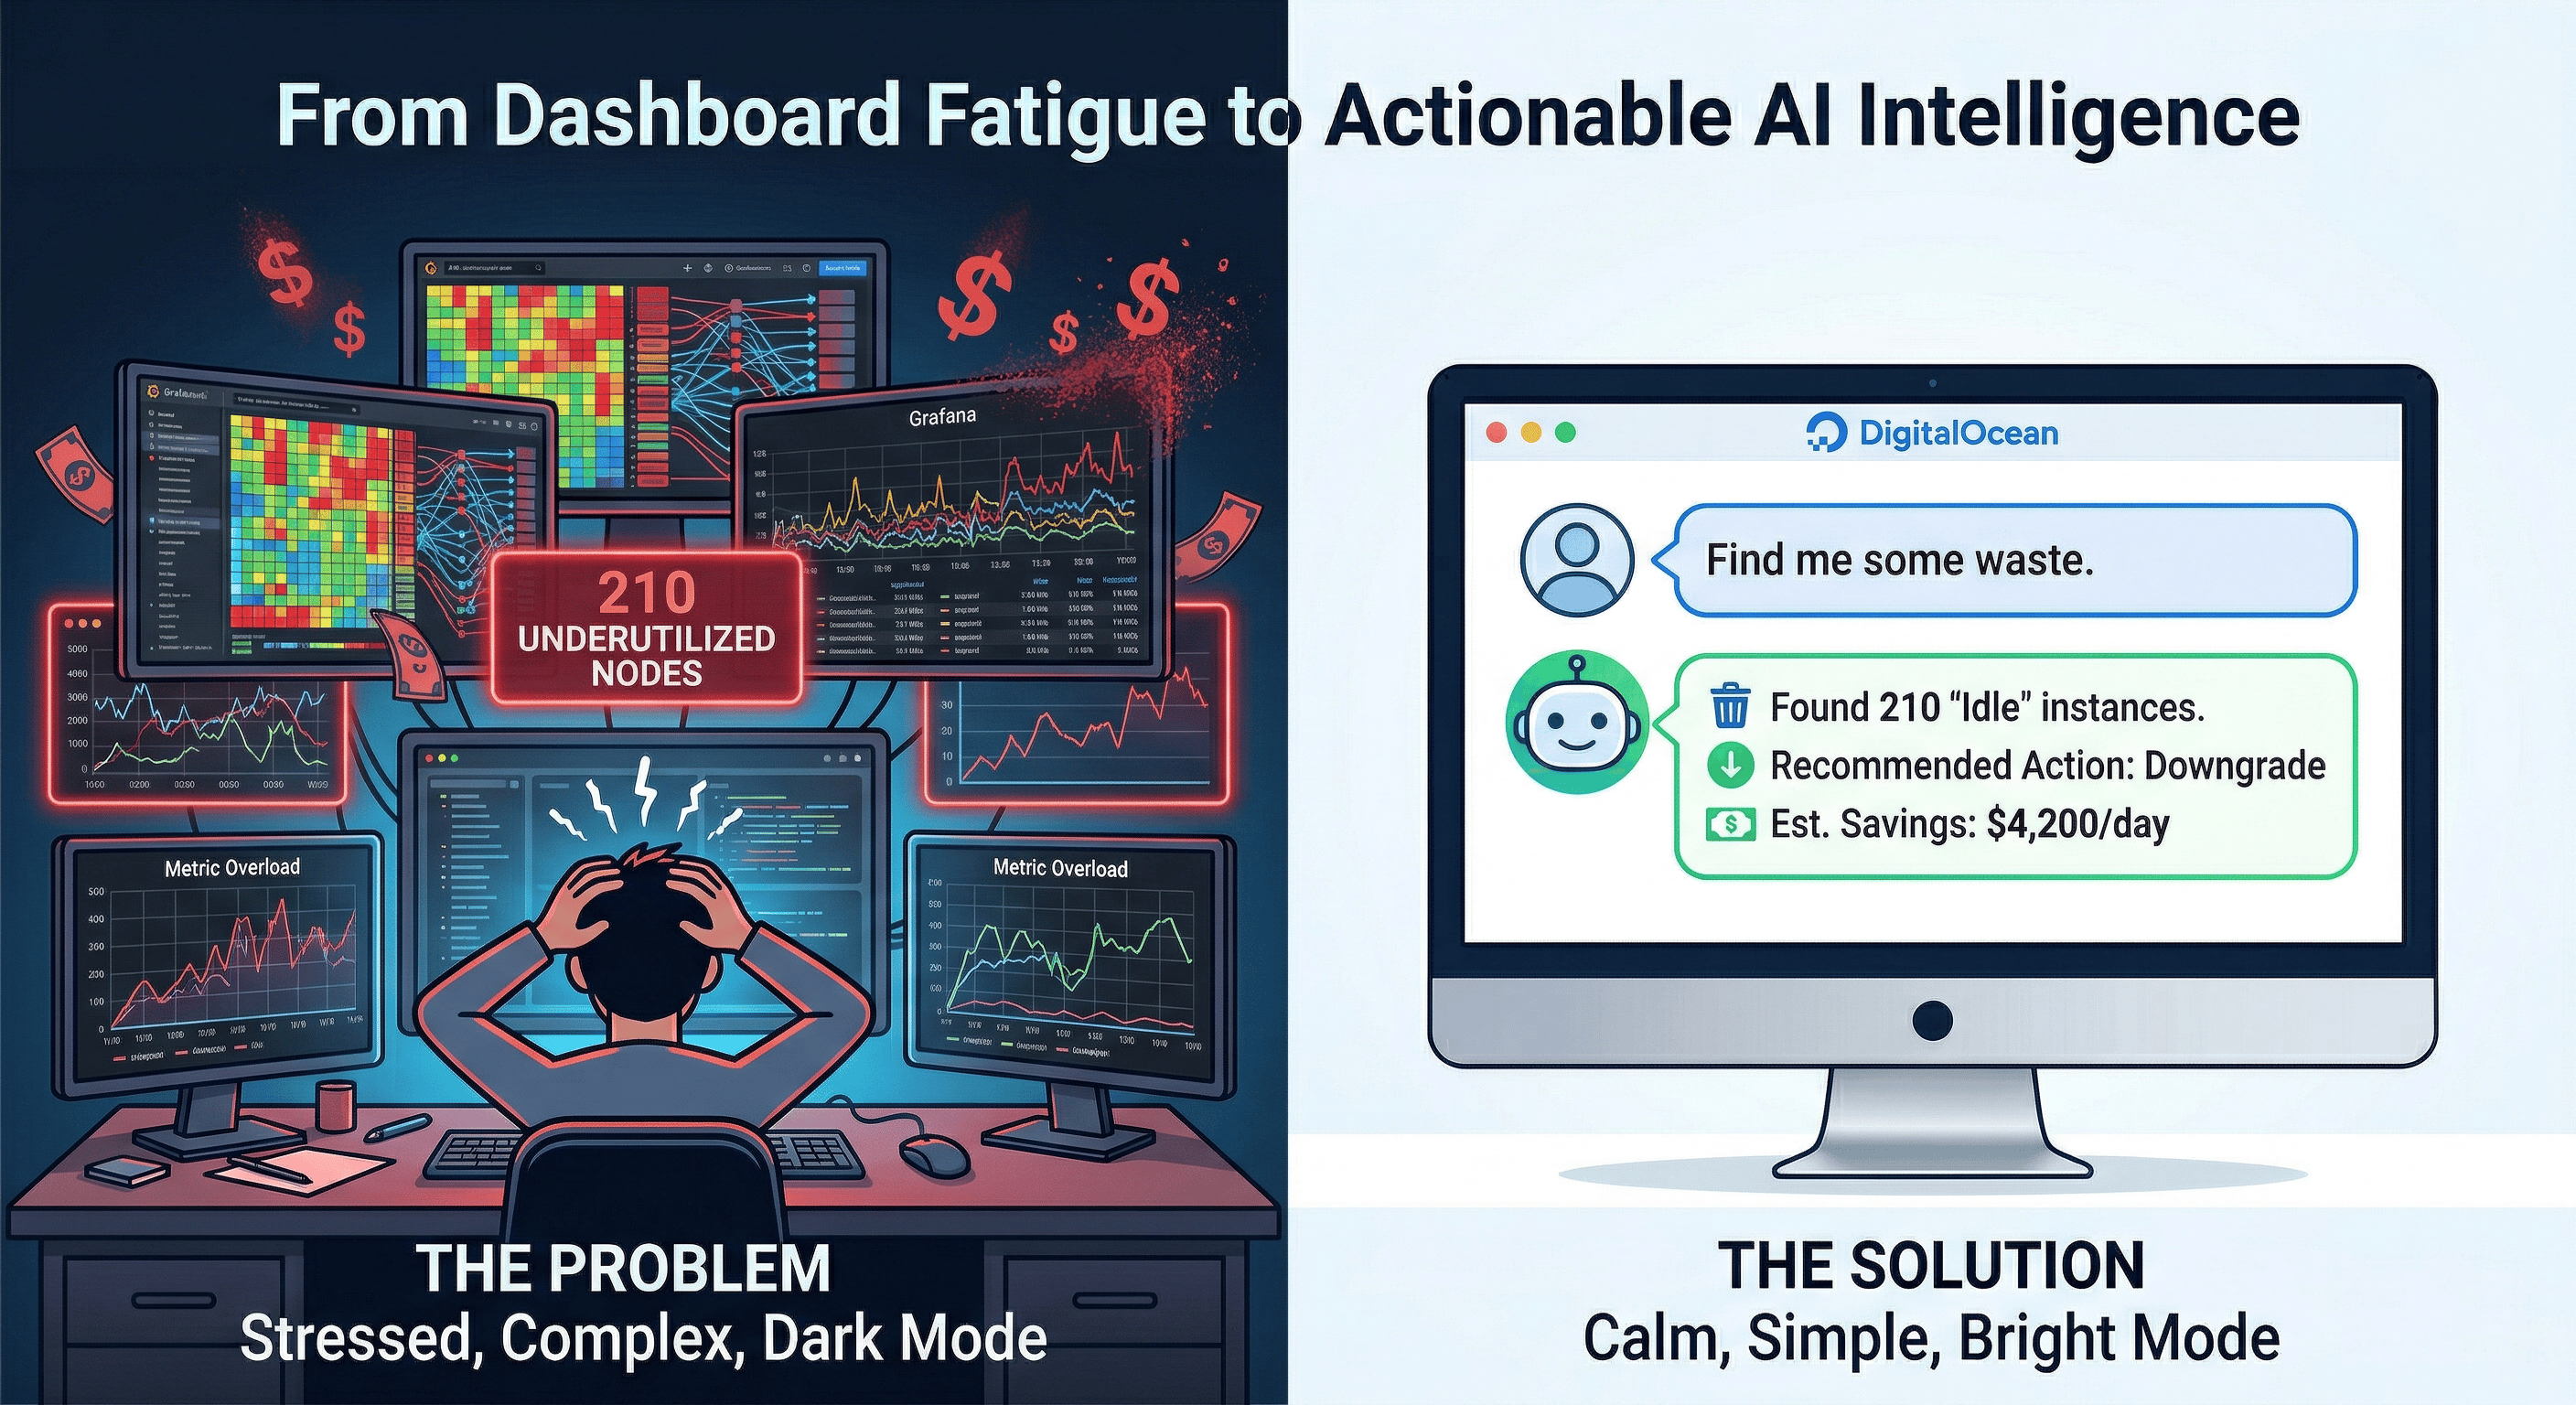
Managing a GPU fleet in the cloud is a constant balancing act between performance and cost. A single idle GPU Droplet left running overnight can add hundreds of dollars to your monthly bill. Traditional monitoring dashboards surface raw metrics, but they still require a human to interpret whether a machine is “working” or “wasting money.”
This tutorial walks you through building an AI-powered GPU fleet optimizer using the DigitalOcean AI Platform and the Agent Development Kit (ADK). You will deploy a serverless, natural-language AI agent that audits your GPU infrastructure in real time, scrapes NVIDIA DCGM (Data Center GPU Manager) metrics like temperature, power draw, VRAM usage, and engine utilization, and flags idle resources before they inflate your cloud bill.
This blueprint is designed to be forked and customized. By the end of this guide, you will know how to tune the agent’s personality and efficiency thresholds, add new monitoring tools, and deploy the agent as a production-ready serverless endpoint.
Reference Repository
You can view the complete blueprint code here: dosraashid/do-adk-gpu-monitor.
Key Takeaways
- Deploy a serverless LangGraph agent on the DigitalOcean AI Platform that monitors your GPU fleet using natural language queries.
- Scrape real-time NVIDIA DCGM metrics (temperature, power, VRAM, engine utilization) from GPU Droplets over Prometheus-style endpoints on port
9400. - Detect idle and underutilized GPUs automatically by defining configurable threshold dictionaries that compare live metrics against your baseline workload patterns.
- Customize the blueprint to your needs: Change target Droplet types, adjust idle detection thresholds, enrich the data payload with additional metrics, and add actionable tools like automated power-off commands.
- Reduce GPU cloud costs by replacing reactive dashboard monitoring with a proactive AI agent that identifies waste the moment it starts.
Prerequisites
- DigitalOcean Account: With at least one active GPU Droplet running.
- DigitalOcean API Token: A Personal Access Token with
readpermissions andGenAIscopes. You can generate one from the API settings page. - AI Platform model access key: Generated from the Gen AI dashboard.
- Python 3.12: Recommended for the latest LangGraph and asyncio features.
- Familiarity with Python, REST APIs, and Linux command-line basics. If you are new to these topics, review the Linux command line primer first.
The Challenge: “Invisible” Cloud Waste
When scaling AI workloads, engineering teams often spin up expensive, specialized GPU Droplets (like NVIDIA H100s or H200s) for training or inference tasks.
The Problem: Hidden Costs and Wasted Resources in GPU Fleet Optimization
Once a training script finishes or a model endpoint stops receiving traffic, the Droplet itself remains online and billing by the hour. This creates two compounding issues:
- Generic monitoring falls short: Standard cloud dashboards typically show host-level metrics like CPU and RAM. A machine learning node might report 1% CPU utilization, but those monitors do not reveal whether the GPU’s VRAM is empty or whether the compute engine is completely idle.
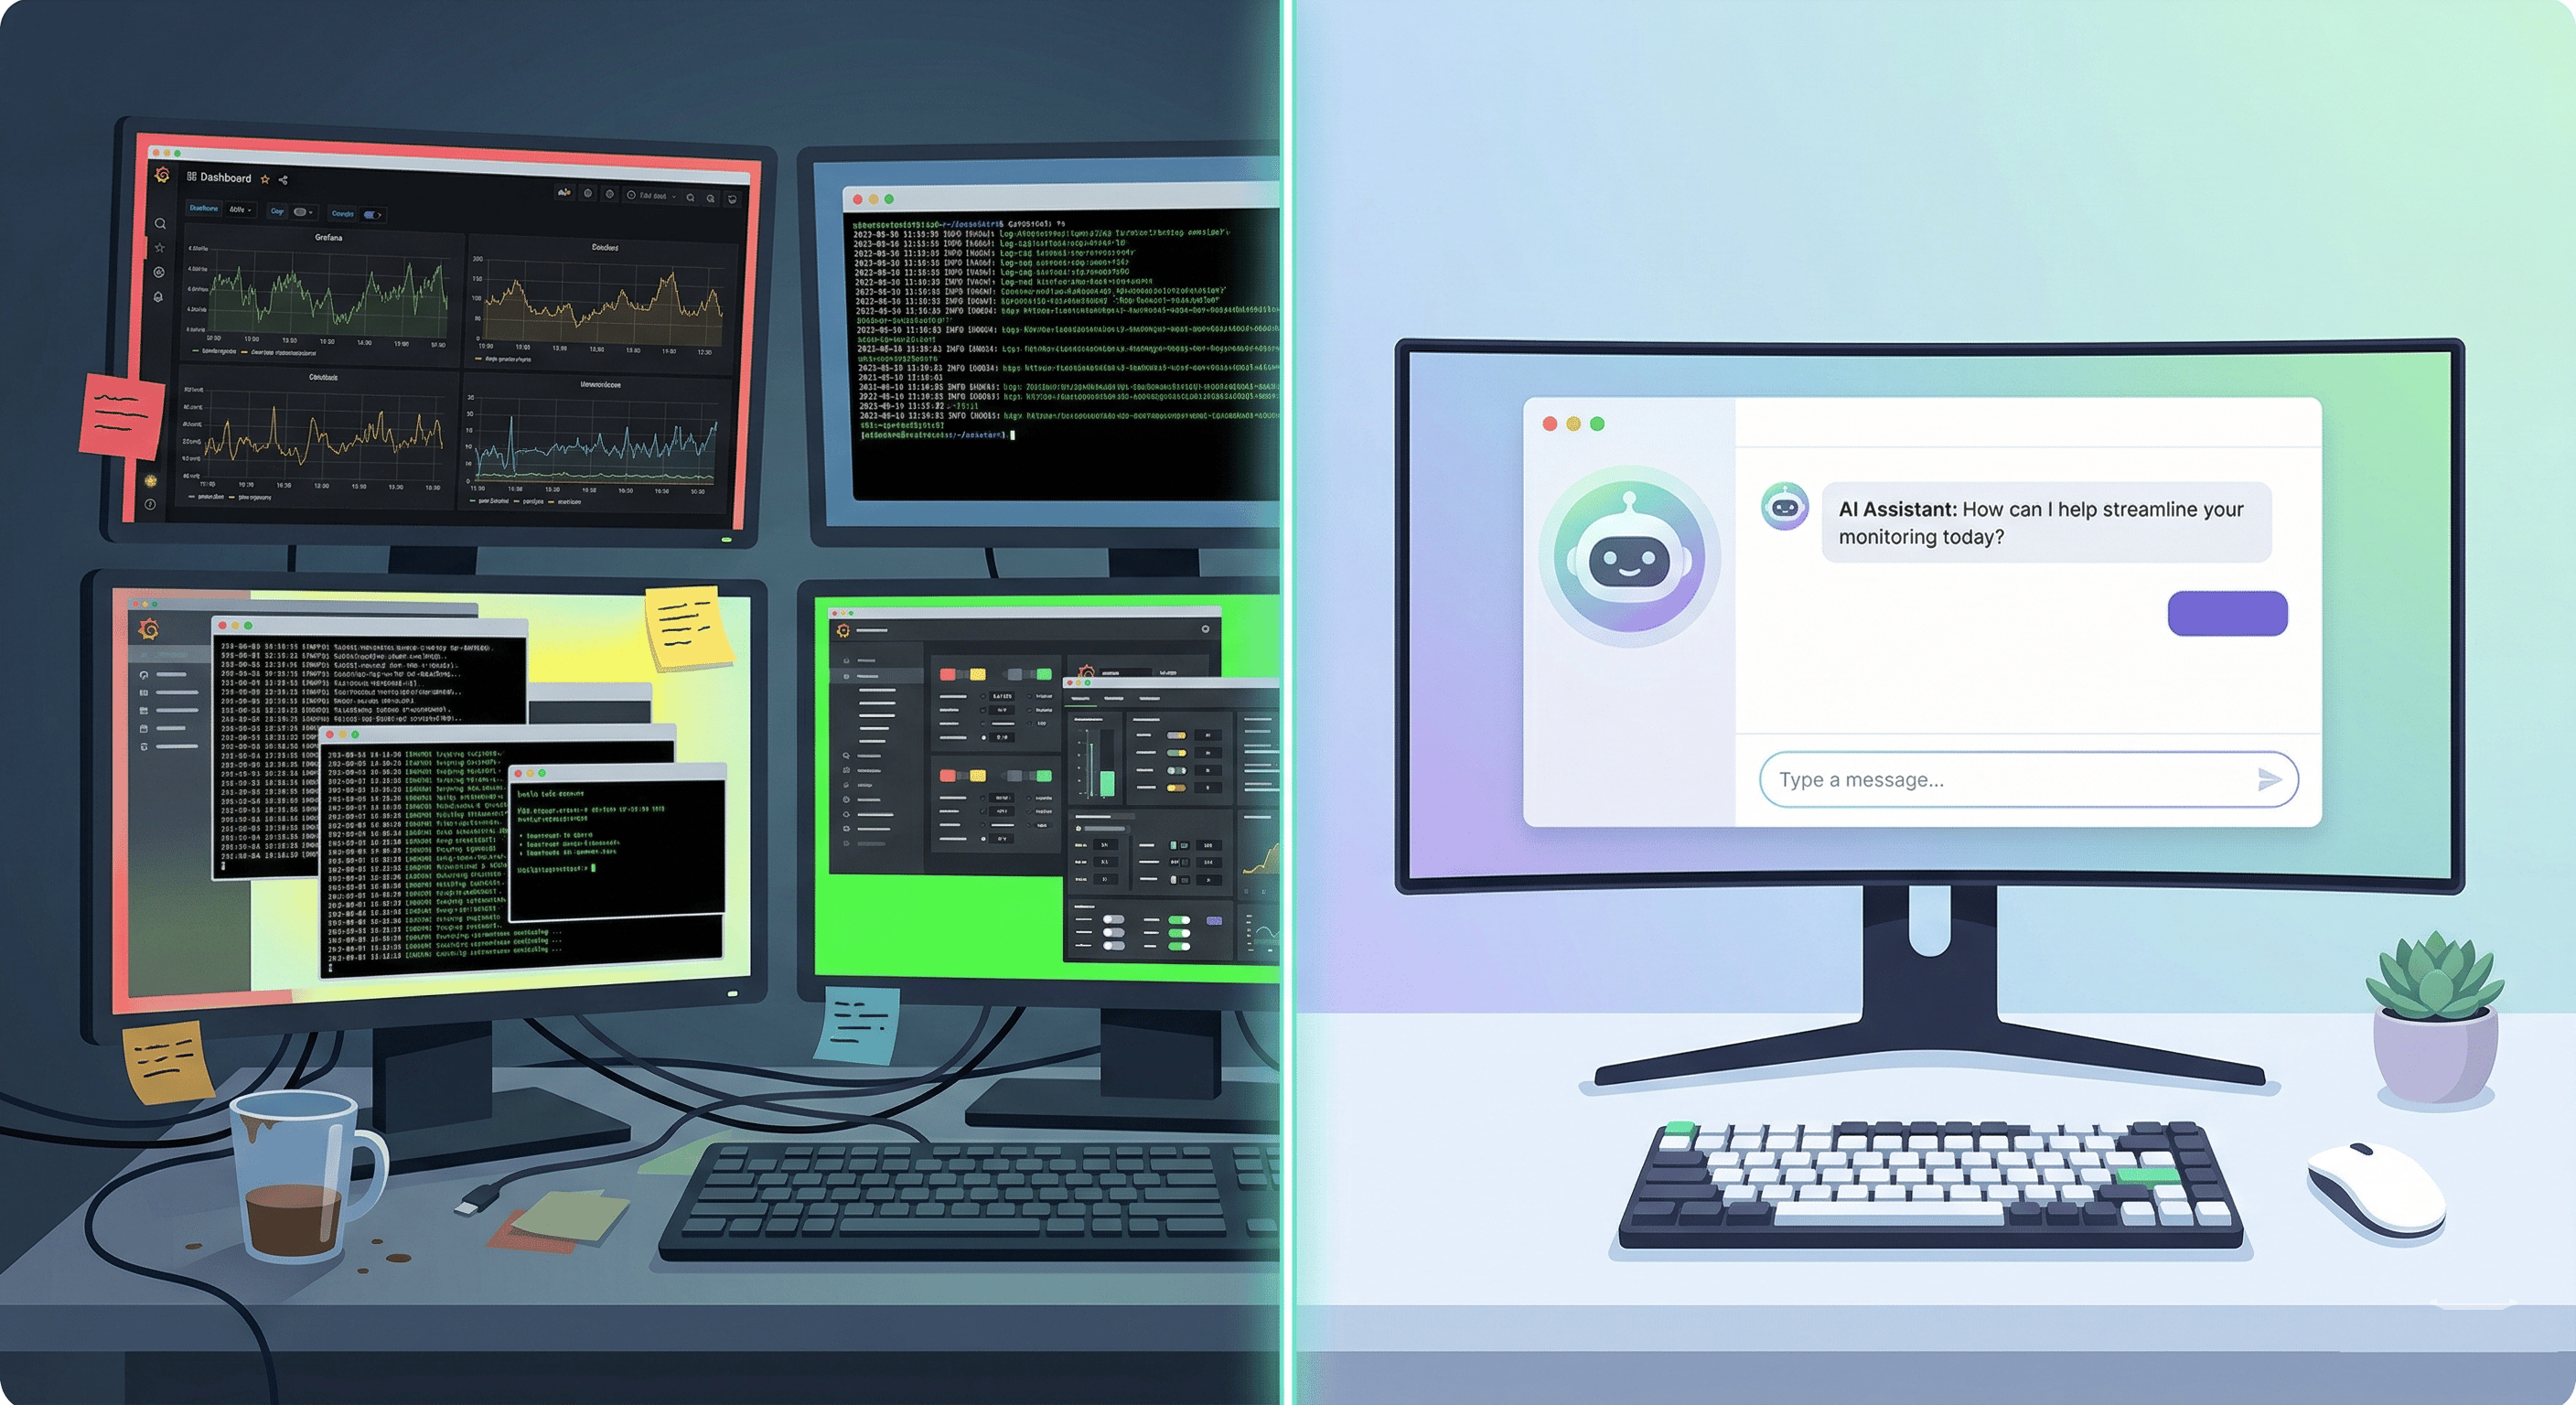
- Dashboard fatigue: Even if you install specialized tools like Grafana to track NVIDIA DCGM metrics, an engineer still has to remember to log in, interpret the charts, and manually map the IP address of an idle node back to a specific cloud resource to shut it down.

The Solution: A Proactive AI Fleet Analyst
Instead of waiting for an engineer to check a dashboard, you can build an AI agent that acts as an autonomous infrastructure analyst.
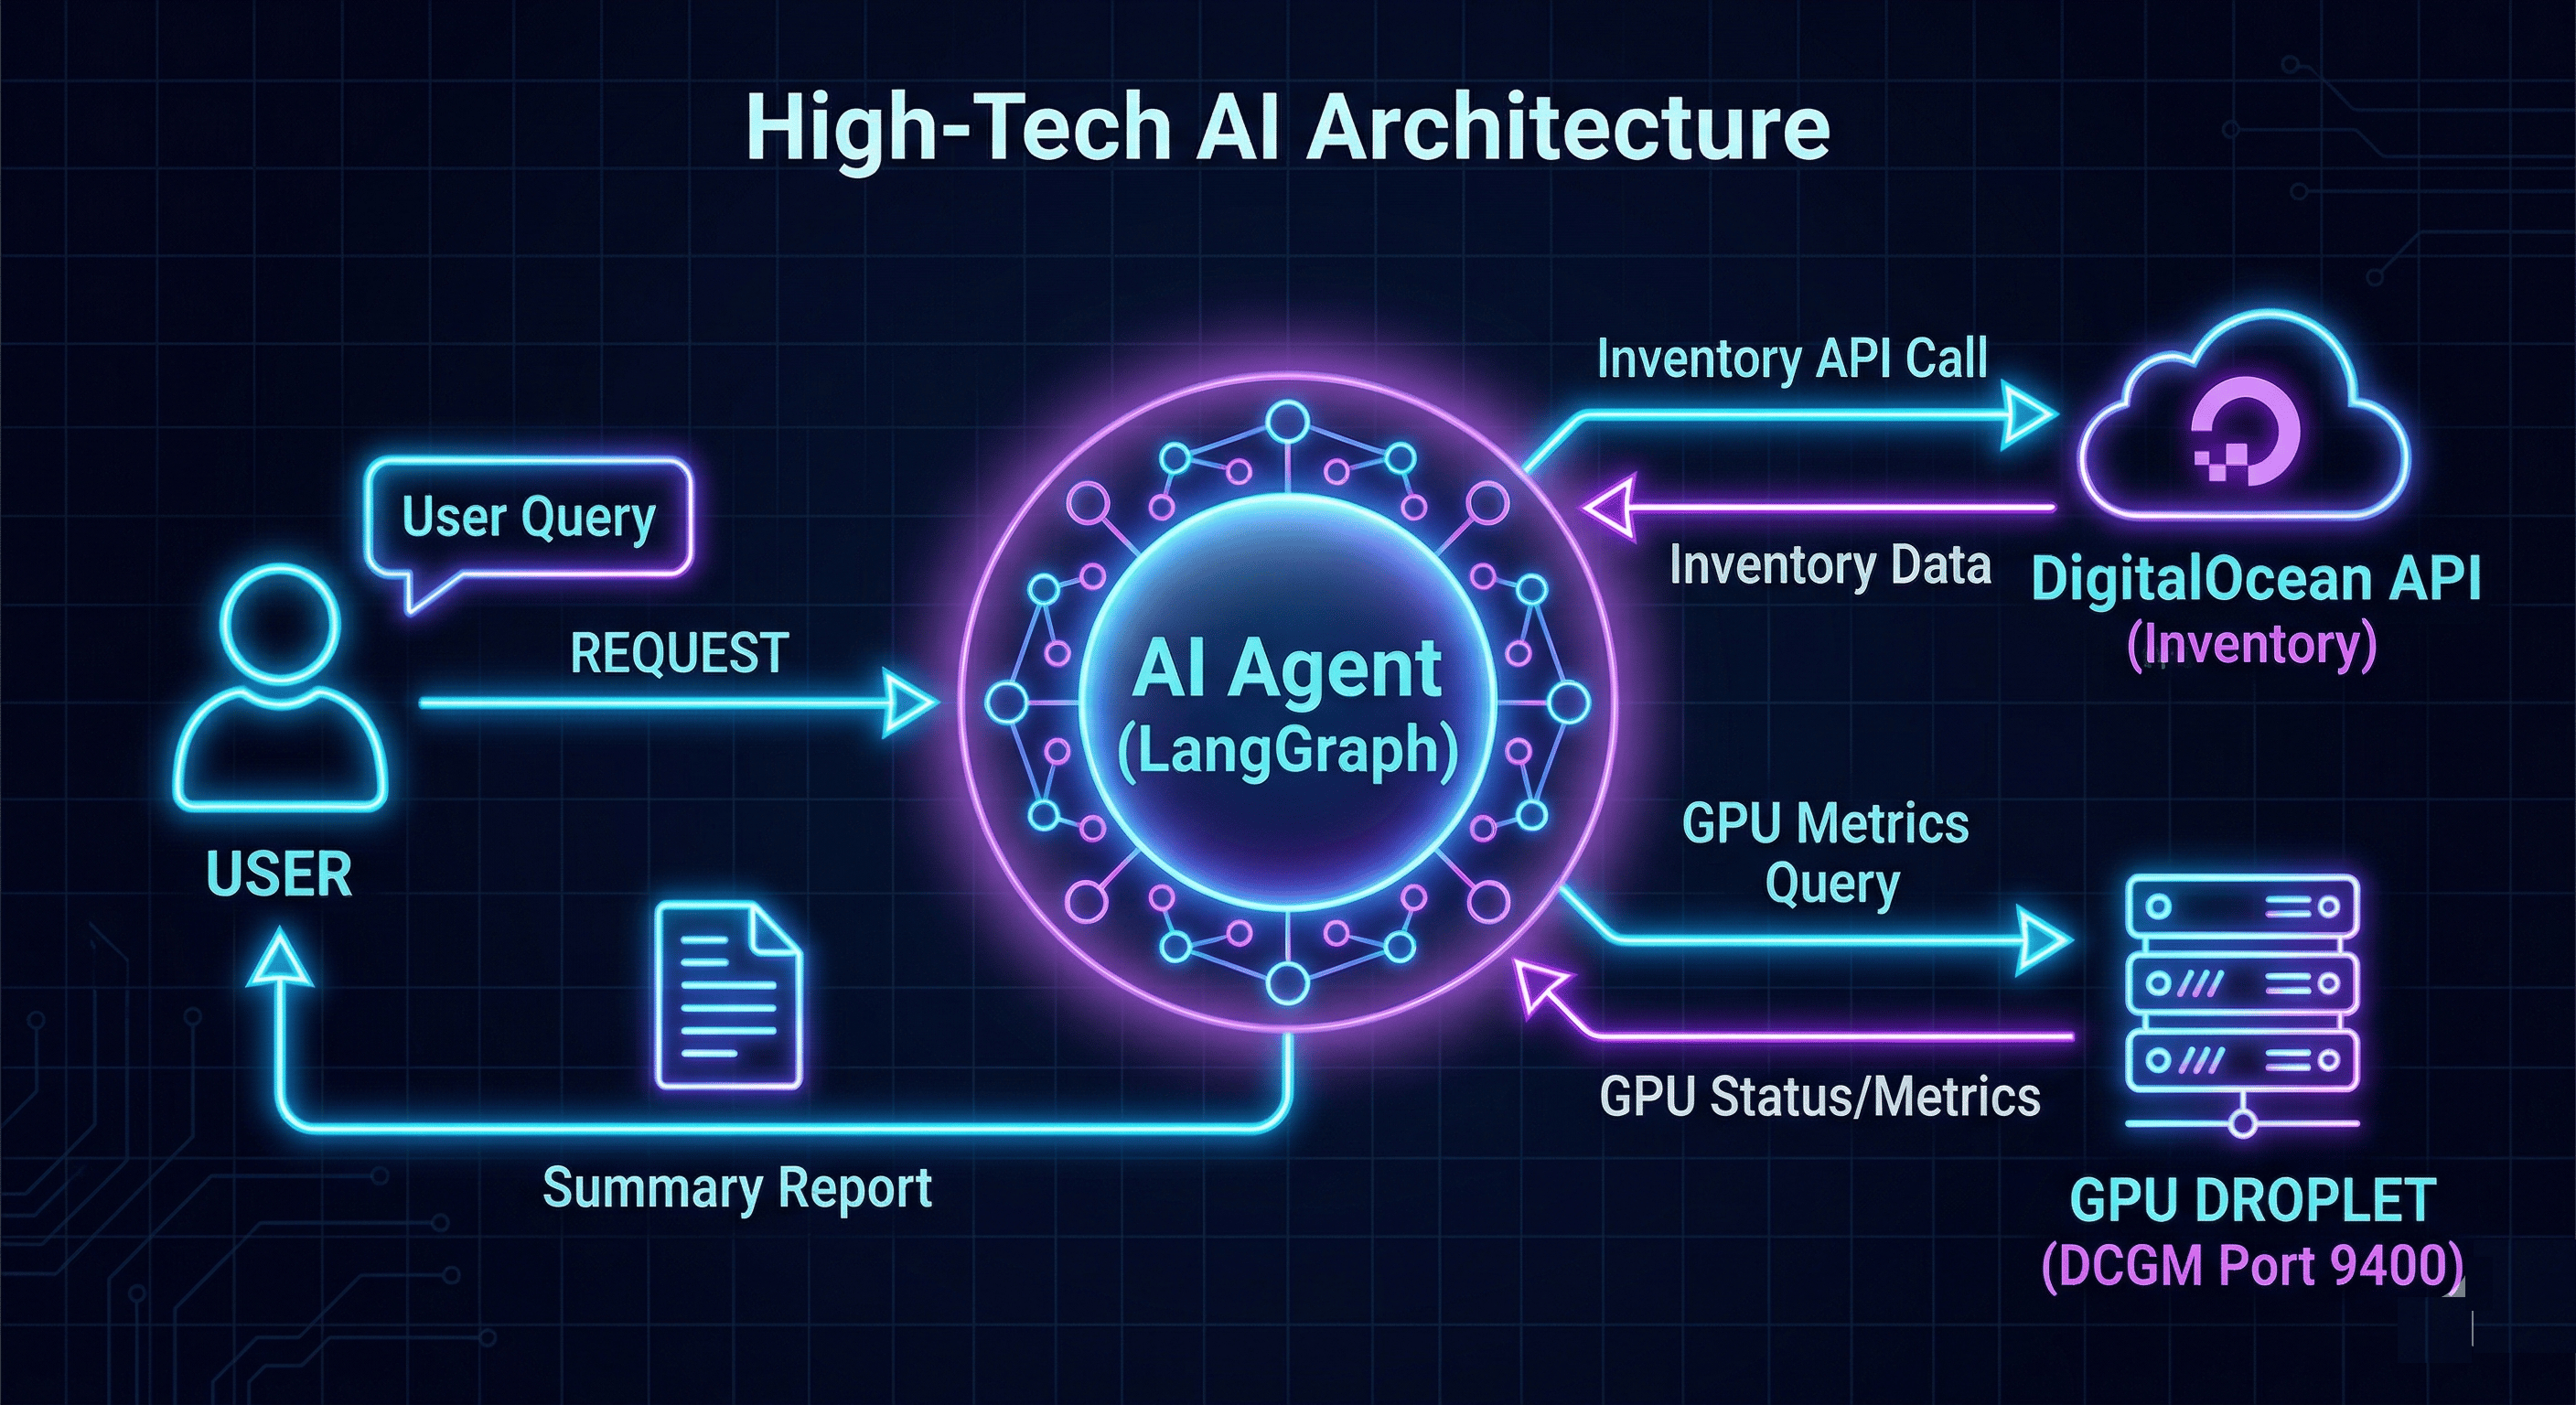
Using the DigitalOcean AI Platform ADK, you will deploy a Large Language Model (LLM) equipped with custom Python tools. When you ask the agent a question like, “Are any of my GPUs wasting money right now?”, it executes a multi-step reasoning loop:
- Discovery: Calls the DigitalOcean API to get a live inventory of your Droplets.
- Interrogation: Pings the NVIDIA DCGM exporter on each node’s public IP to read VRAM, temperature, and engine load.
- Analysis: Runs those raw metrics against a threshold dictionary you define (for example, “If VRAM usage is below 5% and engine utilization is below 2%, mark this GPU as IDLE”).
- Actionable Output: Replies in plain English, naming the specific node, its current hourly cost, and the exact metrics proving it is idle.
Understanding NVIDIA DCGM Metrics for GPU Monitoring
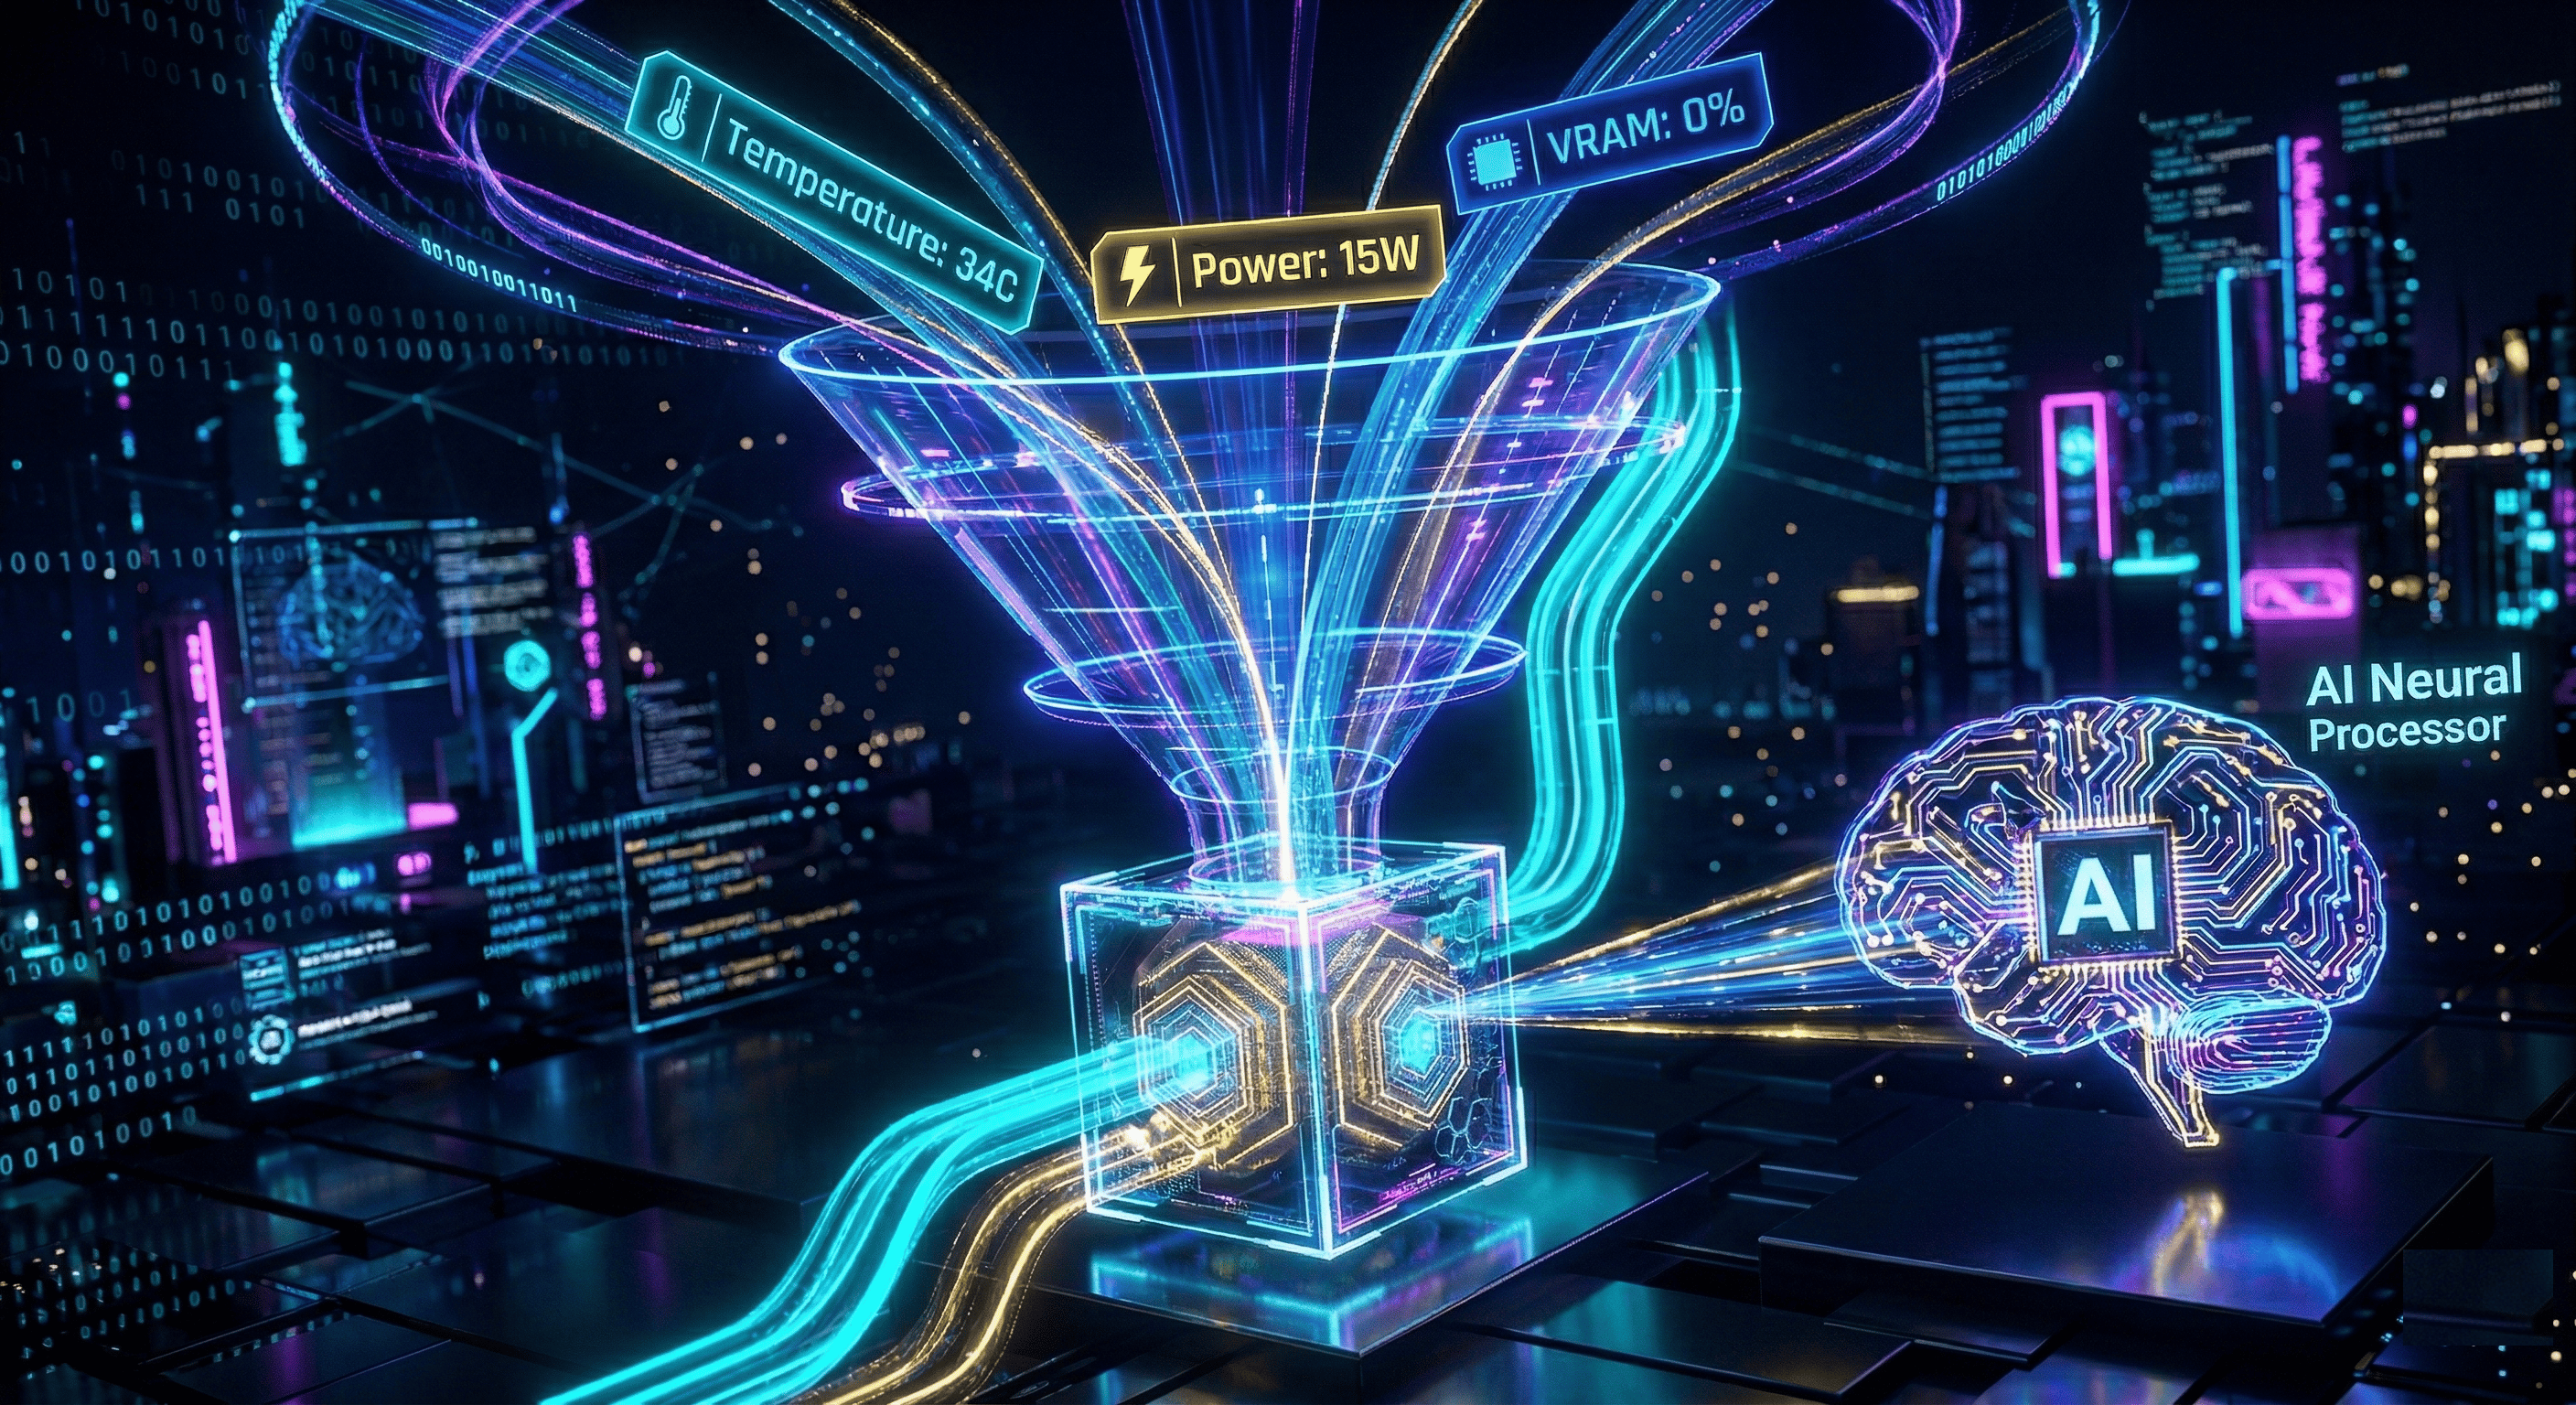
Before building the agent, it helps to understand the GPU-specific metrics it collects. NVIDIA Data Center GPU Manager (DCGM) exposes hardware telemetry through a Prometheus-compatible exporter that runs on port 9400. These metrics go far beyond what standard CPU or RAM monitoring provides and are essential for accurately determining whether a GPU is actively working or sitting idle.
The key DCGM metrics this blueprint collects include:
| Metric | What It Measures | Why It Matters |
|---|---|---|
DCGM_FI_DEV_GPU_TEMP |
GPU die temperature in Celsius | High temperatures indicate active computation; low temperatures suggest the GPU is cold and idle |
DCGM_FI_DEV_POWER_USAGE |
Current power draw in watts | An idle GPU draws significantly less power than one running inference or training workloads |
DCGM_FI_DEV_FB_USED |
Framebuffer (VRAM) memory in use | Models loaded into VRAM consume memory; empty VRAM means no models are loaded |
DCGM_FI_DEV_GPU_UTIL |
GPU engine utilization percentage | The most direct indicator of whether the GPU is performing actual compute work |
When the DCGM exporter is running on a GPU Droplet, you can query these metrics directly:
curl -s http://<DROPLET_PUBLIC_IP>:9400/metrics | grep -E "DCGM_FI_DEV_GPU_TEMP|DCGM_FI_DEV_POWER_USAGE|DCGM_FI_DEV_FB_USED|DCGM_FI_DEV_GPU_UTIL"
The AI agent in this blueprint automates this scraping across your entire fleet, parses the Prometheus text format, and feeds the structured data into the LLM for analysis. If DCGM is not available on a particular node (for example, because the exporter is not installed or port 9400 is blocked by a firewall), the agent falls back to standard CPU and RAM metrics and reports “DCGM Missing” for that node.
For production deployments, consider pairing DCGM data collection with a full Prometheus and Grafana monitoring stack for historical trend analysis alongside the AI agent’s real-time assessments.
Step 1: Clone the Blueprint and Set Up Your Environment
Start with the foundational repository rather than writing everything from scratch.
- Clone the repo and set up your Python environment:
git clone https://github.com/dosraashid/do-adk-gpu-monitor
cd do-adk-gpu-monitor
python3.12 -m venv venv
source venv/bin/activate
pip install -r requirements.txt
- Configure your secrets by creating a
.envfile in the root directory:
DIGITALOCEAN_API_TOKEN="your_do_token"
GRADIENT_MODEL_ACCESS_KEY="your_gradient_key"
Security note: Never commit
.envfiles to version control. The repository’s.gitignorealready excludes this file.
Step 2: How It Works (The Architecture)
Before you customize the blueprint, it helps to understand the data flow inside the code:
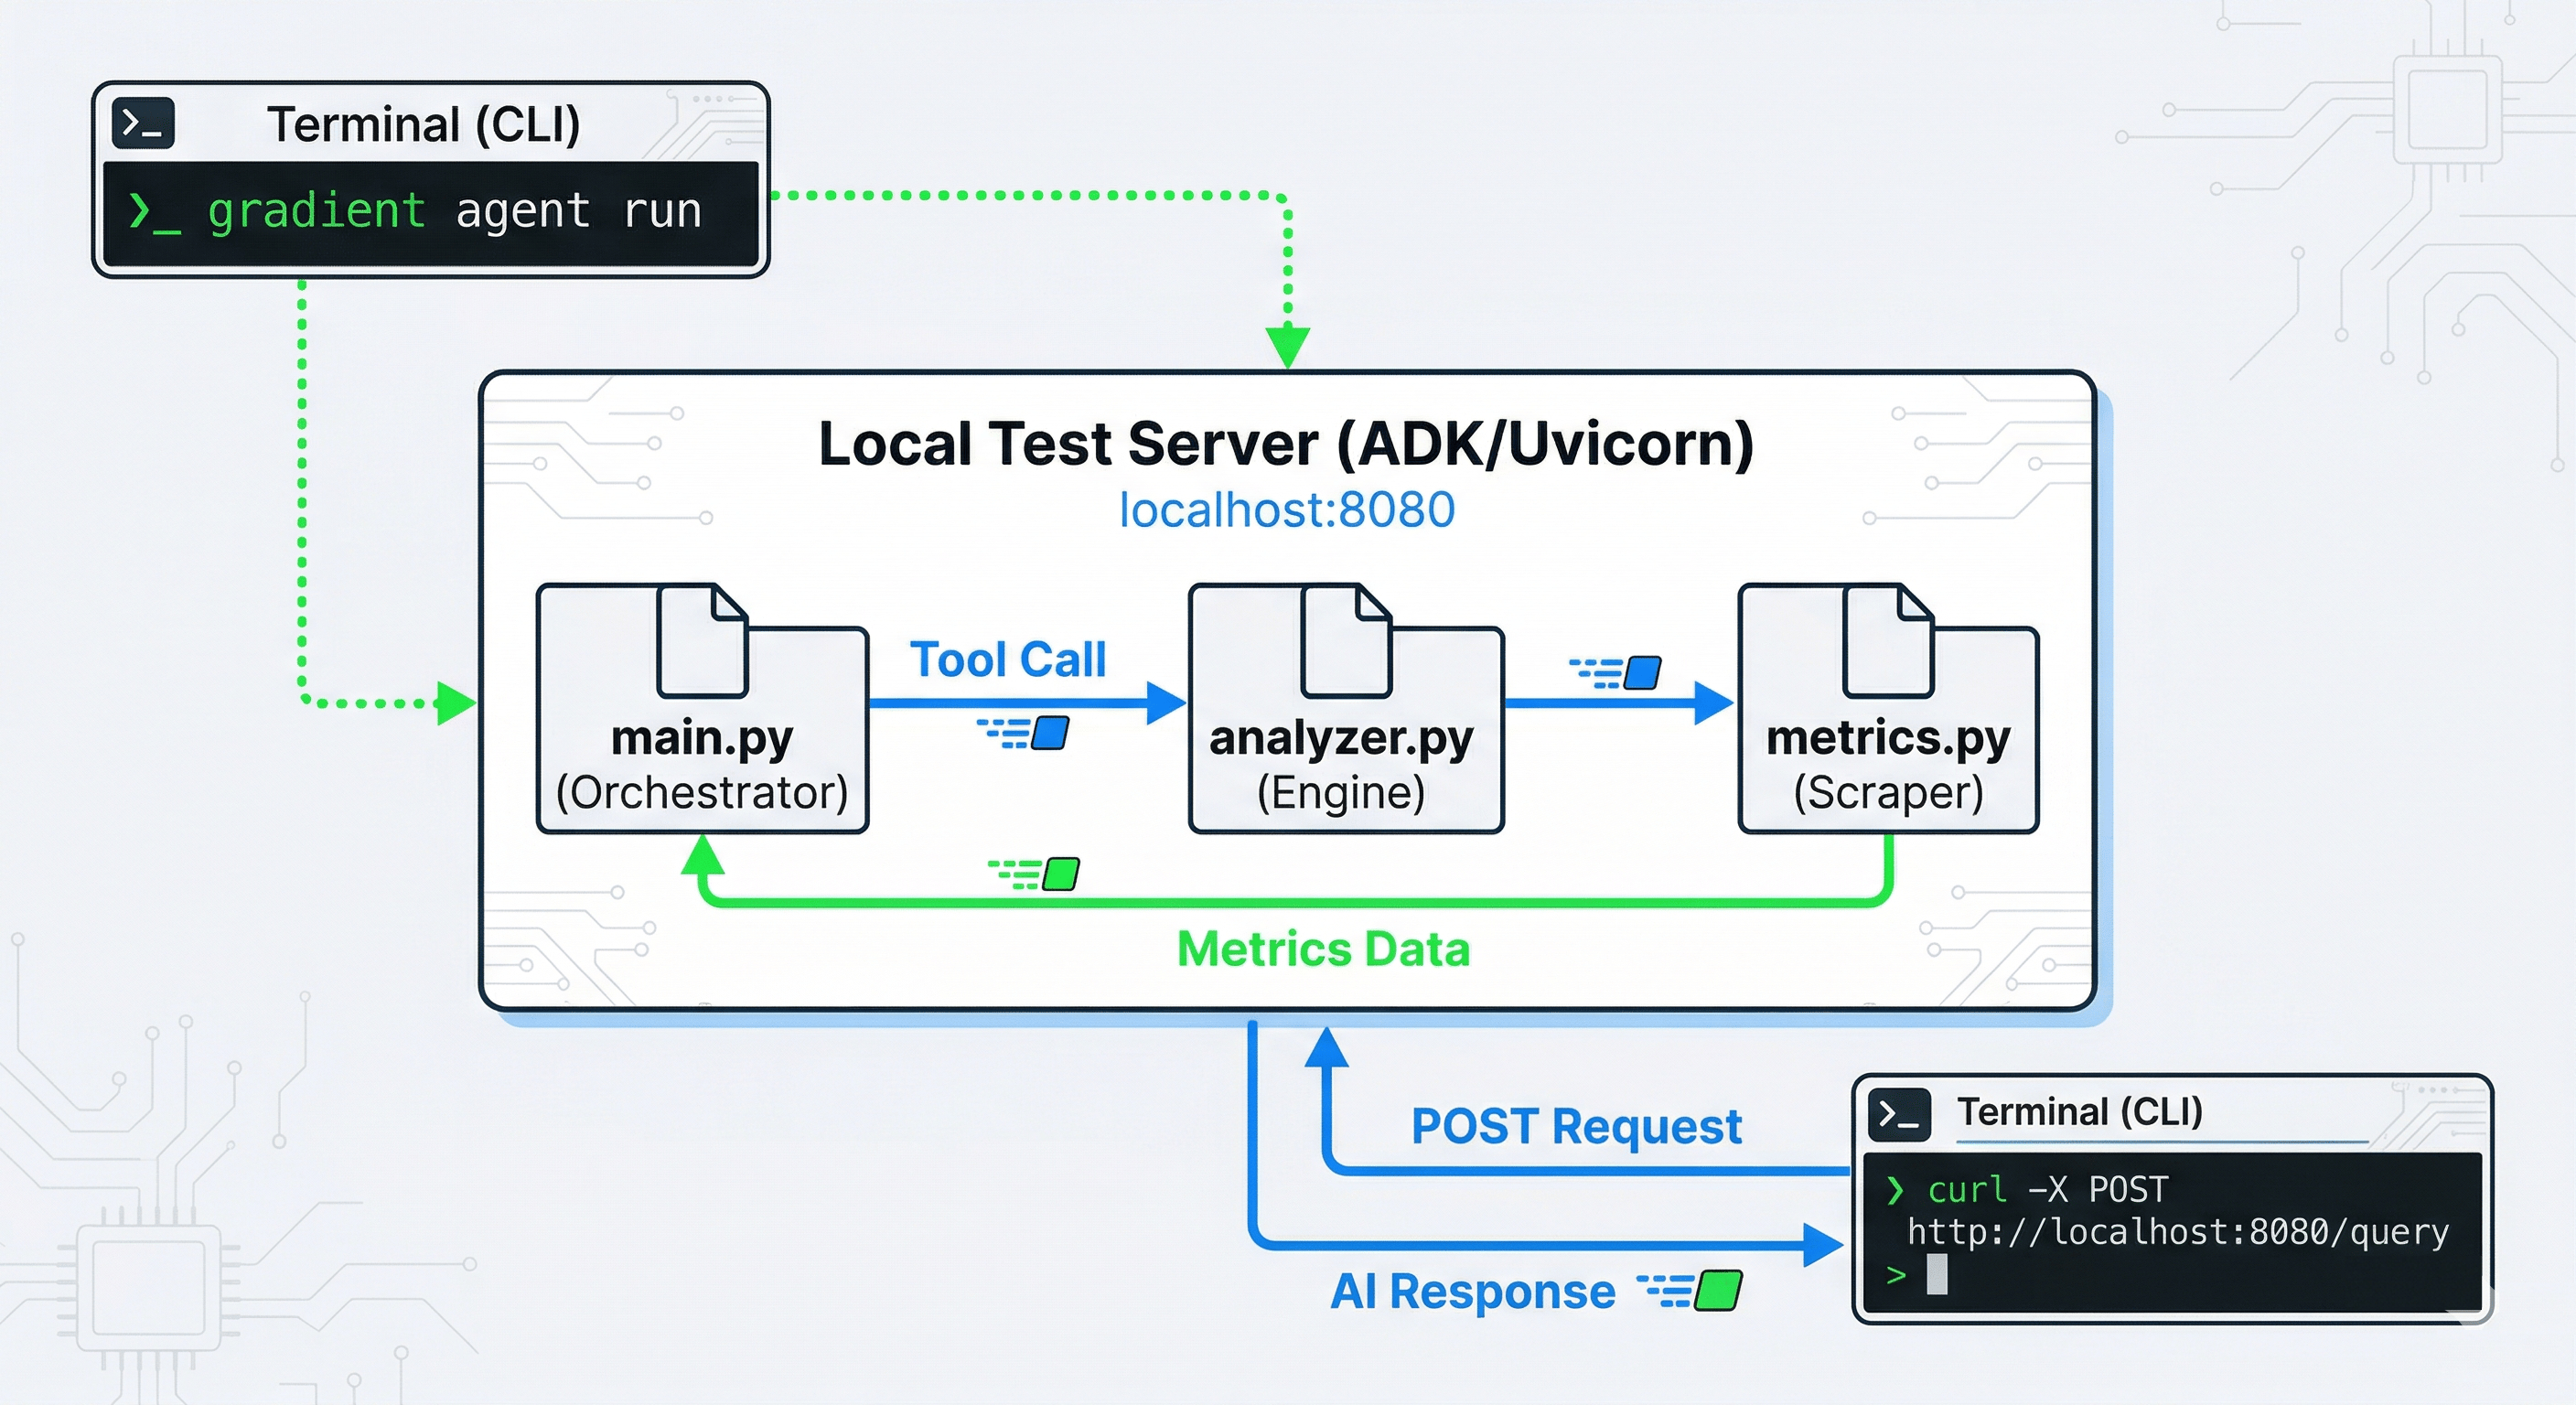
- User Prompt: You ask the agent a question via the
/runendpoint. - LangGraph State: The agent checks its conversation memory (
thread_id) viaMemorySaver, which enables multi-turn follow-up questions within the same session. - Tool Execution: The LLM decides to call
@tool def analyze_gpu_fleet()defined inmain.py. - Parallel Scraping:
analyzer.pyuses Python’sThreadPoolExecutorto query the DigitalOcean API and each Droplet’s DCGM endpoint (metrics.py) concurrently. This parallel approach prevents network bottlenecks when monitoring dozens of nodes. - The Omniscient Payload: The analyzer packages all raw data (temperature, power, VRAM, RAM, CPU, cost) into a structured JSON dictionary that the LLM can reason about.
- Synthesis: The LLM reads the JSON payload and responds in natural language with specific node names, costs, and actionable recommendations.
If you want to learn more about building stateful AI agents with LangGraph, follow the Getting Started with Agentic AI Using LangGraph tutorial.
Step 3: Customizing the Blueprint to Your Needs
This repository is built to be forked and modified. Here are the four main areas you should adjust to match your organization’s requirements.
Customization 1: Tuning the Logic (config.py)
Open config.py. This is the control center for your agent’s behavior.
- The Persona: Edit
AGENT_SYSTEM_PROMPTto change how the AI communicates. For a highly technical DevOps assistant, remove the emojis and instruct it to output raw bullet points. For a management-facing report, tell it to summarize in cost terms. - The Thresholds: The blueprint considers a GPU “Idle” when utilization falls below 2% by default. If your baseline workloads idle at a higher percentage, adjust the
THRESHOLDSdictionary:
THRESHOLDS = {
    "gpu": {
        "max_temp_c": 82.0,
        "max_util_percent": 95.0,
        "max_vram_percent": 95.0,

        "idle_util_percent": 2.0,
        "idle_vram_percent": 5.0,

        "optimized_util_percent": 40.0,
        "optimized_vram_percent": 50.0,
    },
    "system": {
        "idle_cpu_percent": 3.0,
        "idle_ram_percent": 15.0,
        "idle_load_15": 0.5,

        "starved_cpu_percent": 85.0,
        "starved_ram_percent": 90.0,

        "optimized_cpu_percent": 40.0,
        "optimized_ram_percent": 50.0,
    },
}
For example, if your inference servers typically idle at 8% GPU utilization between request bursts, set idle_util_percent to 10.0 to avoid false positives.
Customization 2: Changing the Target Infrastructure (analyzer.py)
By default, the blueprint only scans Droplets with "gpu" in the size_slug to reduce unnecessary API calls. Open analyzer.py and locate the slug filter. If you want the agent to monitor CPU-optimized or standard Droplets, modify this line:
# Change "gpu" to "c-" for CPU-Optimized, or remove the filter entirely to scan all Droplets.
target_droplets = [d for d in all_droplets if "gpu" in d.get("size_slug", "").lower()]
Customization 3: Enriching the Omniscient Payload (analyzer.py and metrics.py)
The LLM only knows what you explicitly pass to it. The default payload includes temperature, power, and VRAM data. If you install Prometheus Node Exporter on your instances and want the AI to also analyze disk space, you would:
- Update
metrics.pyto scrape disk metrics from Node Exporter on port9100. - Update the return dictionary at the bottom of
process_single_dropletinanalyzer.pyto include the new field:
return {
    "droplet_id": droplet_id,
    "gpu_temp": temp_val,
    "gpu_power": power_val,
    "vram_used": vram_val,
    "disk_space_free_gb": disk_val,  # New metric
}
Customization 4: Adding Actionable Tools (main.py)
The default blueprint is read-only. The most powerful upgrade is giving the AI permission to act on your infrastructure. In main.py, you can add a new function with the @tool decorator that uses the DigitalOcean API to power off a specific Droplet:
@tool
def power_off_droplet(droplet_id: str) -> str:
    """Power off a Droplet by ID. Use only when the user explicitly asks to stop an idle node."""
    import requests
    import os

    token = os.getenv("DIGITALOCEAN_API_TOKEN")
    response = requests.post(
        f"https://api.digitalocean.com/v2/droplets/{droplet_id}/actions",
        headers={
            "Authorization": f"Bearer {token}",
            "Content-Type": "application/json",
        },
        json={"type": "power_off"},
    )
    if response.status_code == 201:
        return f"Successfully sent power-off command to Droplet {droplet_id}."
    return f"Failed to power off Droplet {droplet_id}: {response.status_code} {response.text}"
After adding any new tools, bind them to the LLM so the agent can invoke them:
llm_with_tools = llm.bind_tools([analyze_gpu_fleet, power_off_droplet])
Warning: Giving an AI agent write access to your infrastructure requires careful guardrails. Consider adding confirmation prompts, restricting which Droplet tags the agent can act on, and logging all actions for audit purposes.
Step 4: Testing Your Custom Agent
Once you have tailored the code, test it locally before deploying. Start the local development server:
gradient agent run
In a separate terminal, simulate user requests using curl.
Example 1: Deep Diagnostic
curl -X POST http://localhost:8080/run \
     -H "Content-Type: application/json" \
     -d '{
           "prompt": "Give me a full diagnostic on my GPU nodes including temperature and power.",
           "thread_id": "audit-session-1"
         }'
Expected Output: The AI uses the Omniscient Payload to report exact temperatures, wattage, and RAM utilization for each GPU Droplet, alongside cost-saving recommendations for any idle nodes.
Example 2: Contextual Memory
Because you are passing thread_id: "audit-session-1", the agent retains conversation context. You can ask follow-up questions without triggering a full re-scan of your infrastructure:
curl -X POST http://localhost:8080/run \
     -H "Content-Type: application/json" \
     -d '{
           "prompt": "Which of those nodes was the most expensive?",
           "thread_id": "audit-session-1"
         }'
Example 3: Thread Isolation
The memory is strictly scoped by thread_id. A request with a different thread ID sees no prior history and starts a fresh conversation:
curl -X POST http://localhost:8080/run \
     -H "Content-Type: application/json" \
     -d '{
           "prompt": "What was the second question I asked you?",
           "thread_id": "audit-session-2"
         }'
Expected Output: The agent responds that it has no record of previous questions in this session, confirming that thread isolation is working correctly.
Step 5: Cloud Deployment
Once you are satisfied with your customizations, deploy the agent as a serverless endpoint on the DigitalOcean AI Platform:
gradient agent deploy
You will receive a public endpoint URL that you can integrate into Slack bots, internal dashboards, CI/CD pipelines, or any HTTP client. The DigitalOcean AI Platform handles scaling, so your agent can serve multiple concurrent users without manual infrastructure management.
For more details on building and deploying agents with the ADK, see How to Build Agents Using ADK.
GPU Fleet Cost Optimization: When to Use an AI Agent vs. Static Dashboards
One of the most common questions teams face when setting up GPU monitoring is whether to build a custom AI agent or rely on traditional dashboard tooling. The right choice depends on your fleet size, the complexity of your workloads, and how quickly you need to act on idle resources.
| Factor | Static Dashboards (Grafana + Prometheus) | AI Agent (This Blueprint) |
|---|---|---|
| Setup complexity | Moderate: requires Prometheus server, Grafana, and DCGM exporter configuration | Low: clone the repo, set env vars, deploy with gradient agent deploy |
| Real-time alerting | Rule-based alerts with fixed thresholds | Natural language queries with adaptive reasoning |
| Multi-metric correlation | Manual: you visually compare multiple charts | Automatic: the LLM correlates temperature, power, VRAM, and cost in a single response |
| Actionability | Read-only dashboards; separate automation needed | Extensible with @tool decorator for direct API actions |
| Conversational follow-ups | Not supported | Built-in via LangGraph MemorySaver and thread_id scoping |
| Best for | Large teams with dedicated SRE/DevOps staff and historical trend analysis | Small-to-mid teams that need fast, conversational GPU auditing without building dashboard infrastructure |
For teams running fewer than 20 GPU Droplets, the AI agent approach eliminates the overhead of maintaining a full monitoring stack while still providing actionable insights. For larger fleets, consider running both: use Prometheus and Grafana for long-term trend storage and the AI agent for on-demand, conversational diagnostics.
Advantages and Trade-offs
When adapting this blueprint for production, keep these architectural considerations in mind:
- Contextual intelligence: LangGraph’s
MemorySavergives the agent conversation history, allowing natural drill-down investigations. You can ask “Which node is idle?” followed by “How much is it costing me per hour?” without repeating context. - Parallel processing: The analyzer uses Python’s
ThreadPoolExecutorto scan dozens of Droplets concurrently, preventing the LLM from timing out while waiting for sequential network calls. - Cost justification: If the AI agent spots a single idle $500/month GPU instance, it pays for itself many times over. The inference cost of running a single diagnostic query on the DigitalOcean AI Platform is negligible compared to the savings.
- Graceful degradation: If the DCGM metric scraper cannot reach port
9400(for example, because of firewall rules or the exporter not being installed), the agent reports “DCGM Missing” for that node and falls back to standard CPU and RAM metrics rather than failing entirely. - Security considerations: The agent requires a DigitalOcean API token with read permissions. If you add write tools (like the
power_off_dropletexample), scope the token’s permissions carefully and implement audit logging.
FAQs
1. What is NVIDIA DCGM and why is it important for GPU monitoring?
NVIDIA Data Center GPU Manager (DCGM) is a suite of tools for managing and monitoring NVIDIA GPUs in data center environments. It exposes detailed hardware telemetry, including GPU temperature, power consumption, VRAM usage, and engine utilization, through a Prometheus-compatible exporter on port 9400. Standard CPU and RAM monitoring tools cannot capture these GPU-specific metrics, which makes DCGM essential for accurately determining whether a GPU is actively processing workloads or sitting idle. Without DCGM data, a GPU Droplet running at 1% CPU could appear “active” while its GPU engine is completely cold, leading to hundreds of dollars in wasted cloud spend per month.
2. How does the AI agent detect idle GPU instances?
The agent uses a two-layer detection approach. First, it scrapes real-time metrics from the NVIDIA DCGM exporter running on each GPU Droplet, collecting GPU engine utilization, VRAM usage, temperature, and power draw. Then it compares these values against a configurable threshold dictionary defined in config.py. By default, a GPU is flagged as “idle” when engine utilization drops below 2% and VRAM usage falls below 5%. These thresholds are fully customizable to match your workload patterns. If DCGM metrics are unavailable for a particular node, the agent falls back to CPU and RAM metrics as a secondary signal.
3. Can I use this GPU fleet optimizer with non-DigitalOcean cloud providers?
This blueprint is purpose-built for the DigitalOcean ecosystem, using the DigitalOcean API for Droplet discovery and the AI Platform for agent deployment. However, the core architecture is portable. The DCGM metric scraping logic in metrics.py works with any NVIDIA GPU that runs the DCGM exporter, regardless of the cloud provider. To adapt the blueprint for another provider, you would need to replace the Droplet discovery code in analyzer.py with that provider’s compute API and use a different LLM hosting solution in place of the AI Platform ADK.
4. How much does running the AI agent cost compared to the savings it generates?
The AI Platform charges based on inference usage, and a single diagnostic query typically costs a fraction of a cent. In contrast, a single idle NVIDIA H100 GPU Droplet can cost upward of $500 per month if left running. Even if your team runs dozens of diagnostic queries per day, the total inference cost remains negligible compared to identifying and shutting down even one forgotten GPU instance. The agent effectively pays for itself the first time it catches an idle node that would have otherwise continued billing.
5. What happens if the DCGM exporter is not running on a GPU Droplet?
The agent is designed to handle this gracefully. When the DCGM exporter on port 9400 is unreachable (whether because the service is not installed, the port is blocked by a firewall, or the node is temporarily unresponsive), the agent marks that node as “DCGM Missing” in its report. It then falls back to analyzing standard system metrics like CPU utilization, RAM usage, and load average to provide a best-effort assessment. The report clearly distinguishes between nodes with full GPU telemetry and those relying on fallback metrics, so you always know the confidence level of each recommendation.
Conclusion
You have successfully deployed a multi-tool AI agent using the DigitalOcean AI Platform that transforms raw infrastructure metrics into conversational, actionable intelligence. By combining DigitalOcean API data with real-time NVIDIA DCGM telemetry and an LLM reasoning engine, you have built a system that addresses three major operational challenges:
1. Stopping the Silent Budget Drain
The most immediate value this agent delivers is catching “forgotten resources.” When engineers spin up GPU Droplets for experiments or temporary training runs, those instances often continue billing long after the work is done. Standard CPU monitors might show background processes at 1%, making the instance look active.
By querying the NVIDIA DCGM exporter directly for engine and VRAM utilization, the AI agent cuts through that noise. It identifies premium GPU nodes that are doing no meaningful compute work, letting you stop the financial drain before it compounds.
2. Eliminating Dashboard Fatigue
In a traditional workflow, diagnosing a cloud infrastructure issue means opening the DigitalOcean Control Panel to check Droplet status, switching to Grafana to review DCGM metrics, and consulting an architecture diagram to remember what each node is responsible for.
This agent consolidates that entire workflow. Using LangGraph’s conversational memory and the Omniscient Payload, you ask a single question and receive a complete summary of host details, GPU temperature, power usage, and cost impact in one response.
3. Bridging Observability and Action
Traditional dashboards are read-only. They can alert you that a resource is idle, but they do not provide the tools to act on that information.
Because this blueprint is built on the AI Platform ADK, the agent is inherently extensible. By adding a few lines of Python using the @tool decorator, you can upgrade this agent from a passive monitor into an active operator that executes API commands to power off idle nodes, resize underutilized instances, or trigger scaling events automatically.
The do-adk-gpu-monitor repository is your starting point. Clone the code, adjust the efficiency thresholds to match your specific workloads, and start having conversations with your infrastructure today.
Continue Learning
Ready to take your GPU fleet management and AI agent development further? Explore these resources:
- DigitalOcean AI Platform Documentation: Full reference for deploying and managing AI agents, models, and inference endpoints.
- How to Build Agents Using ADK: Step-by-step guide to creating custom agents with the Agent Development Kit.
- Getting Started with Agentic AI Using LangGraph: Learn the fundamentals of building stateful, multi-step AI agents with LangGraph.
- Stable Diffusion on DigitalOcean GPU Droplets: Run GPU-accelerated AI workloads on DigitalOcean GPU Droplets.
- Scaling the AI Platform with GPU Droplets and Networking: Architect production GenAI deployments with GPU Droplets, global load balancers, and VPC networking.
Try DigitalOcean GPU Droplets to run your own AI workloads, or get started with the AI Platform to deploy your first AI agent today.
Thanks for learning with the DigitalOcean Community. Check out our offerings for compute, storage, networking, and managed databases.
About the author(s)
Anish is a Sr Technical Content Strategist and Team Lead at DigitalOcean with 7+ years of experience as an DevOps SRE at Nutanix and Cloud consultant at AMEX, and technical writing at DOCN, and shipping deep infra and AI inference tutorials that help developers deploy production‑ready applications on DigitalOcean.
Still looking for an answer?
This textbox defaults to using Markdown to format your answer.
You can type !ref in this text area to quickly search our full set of tutorials, documentation & marketplace offerings and insert the link!
 This work is licensed under a Creative Commons Attribution-NonCommercial- ShareAlike 4.0 International License.
Become a contributor for community
Get paid to write technical tutorials and select a tech-focused charity to receive a matching donation.

DigitalOcean Documentation
Full documentation for every DigitalOcean product.

Resources for startups and AI-native businesses
The Wave has everything you need to know about building a business, from raising funding to marketing your product.
The developer cloud
Scale up as you grow — whether you're running one virtual machine or ten thousand.

Start building today
From GPU-powered inference and Kubernetes to managed databases and storage, get everything you need to build, scale, and deploy intelligent applications.
