By Andrew Dugan
Senior AI Technical Content Creator II

Introduction
Imagine you’re selecting an LLM for your application. You do extensive research on which model will work best for your use case. You might experiment with it in a sandbox using DigitalOcean Serverless Inference, find it works well, then commit to another provider for that model to integrate into your app. After pushing to production, the model’s accuracy, time to first token (TTFT), and throughput are all worse than you’d hoped. It was the same model, so what could have happened?
The answer is that models are not all treated equally across platforms. One platform may dedicate their best GPUs to one set of models, when another platform focuses their best hardware on a different set of models. Even if the platform offers a model, it may not have the necessary resources behind the scenes to make it production-worthy. Behind every API endpoint, providers are making a series of infrastructure decisions, such as how many replicas to keep warm, what precision to serve the model at, which GPU tier to allocate, and how to prioritize request queues. These decisions are rarely documented, and they vary significantly from provider to provider and from model to model on the same provider.
This article explains what providers actually control, why model popularity shapes those decisions, and most importantly, how to measure it yourself before committing a model and provider combination to production.
The benchmark data in this article comes from internal testing we conducted to validate these patterns. The provider names are withheld, but the methodology is described in enough detail that you can reproduce the same kind of comparison yourself.
Key Takeaways
-
Serverless inference providers make many undisclosed infrastructure decisions per model including replica count, quantization, GPU tier, and batching strategy. All of these directly affect the latency and consistency you experience.
-
These decisions are largely driven by perceived model popularity. Popular models stay warm, while niche or lower-traffic models cold-start more often and receive less optimization investment.
-
The same model can behave like a completely different product across providers. In our benchmarks, DeepSeek V4 Pro had a coefficient of variation (CV) of 21% on one platform and 710% on another, accounting for a 34x difference in consistency.
-
There is no single “best” provider for all models. Which models are well-supported varies by platform, and the only reliable way to find out is to measure.
What Providers Actually Control
Most developers assume that if a model is listed on a provider’s platform, it is being served in a standard, equivalent way. It isn’t. Providers make several decisions for each model that compound to produce the latency and consistency you observe.
Replica Count and Warm Pool Size
Serverless inference works by dynamically allocating GPU capacity to handle incoming requests. Popular models with consistent, high-volume traffic justify keeping multiple live replicas (GPU instances with the model already loaded and ready to serve) sitting idle at all times. When a request arrives, it routes immediately to an available replica.
Less popular models may have zero warm replicas outside of peak periods. When a request arrives for a cold model, the provider must allocate a GPU, load the model weights from storage, initialize the serving runtime, and then handle the request. For a large language model, this process can take anywhere from 10 to 90 seconds depending on model size, storage location, and infrastructure. This is a cold start.
Cold starts are the primary driver of the high-variance latency patterns we discuss later. A model may have a median TTFT of 0.4 seconds, because most requests hit a warm replica, but a 95th percentile (p95) that exceeds 6 seconds because roughly one in twenty requests triggers a cold start. Median measurements will not reveal this.
Quantization
The same model weights can be served at different numerical precisions. Full-precision serving (BF16 or FP16) uses the most memory but preserves the original weights exactly. FP8 and INT8 reduce memory footprint roughly in half with minimal quality degradation for most tasks. INT4 quantization cuts memory further but can produce measurable quality differences on reasoning-heavy benchmarks.
Providers choose quantization levels based on their optimization investment in each model. Popular models often receive careful quantization tuning, choosing the precision that maximizes throughput per GPU while preserving output quality. Niche models may be served at whatever precision was easiest to configure when they were onboarded.
Quantization affects performance in two ways. Lower precision enables more replicas per GPU (reducing cold start frequency) and enables faster matrix operations (reducing TTFT when a replica is warm). Providers rarely publish which precision they use for a given model.
GPU Hardware Allocation
Not all GPUs are equal. H100s, A100s, and AMD MI300Xs have meaningfully different memory bandwidth and compute throughput. A model served on an H100 NVL versus an A100 80GB can show 2-3x TTFT differences for identical workloads. Providers may route different models to different GPU tiers based on demand, available inventory, and the economics of that model’s traffic volume.
Inference Engine and Kernel Optimization
How a model is actually executed matters as much as the hardware it runs on. vLLM, TensorRT-LLM, SGLang, and custom-built kernels produce meaningfully different throughput and latency profiles for the same model weights. Additional techniques like speculative decoding, which uses a small draft model to predict multiple tokens ahead of the main model, can reduce TTFT significantly, but requires explicit configuration investment. Each provider makes these choices independently, which is why the same model can perform very differently across platforms.
Request Queue Priority and Batching
Under load, providers batch multiple requests together to improve GPU utilization. Popular models with steady, predictable traffic batch efficiently. Requests arrive at regular intervals, queues stay shallow, and batching adds minimal overhead. Niche models with sparse, bursty traffic batch poorly. A request for a rarely-used model may queue behind batches for popular models, adding latency that looks indistinguishable from cold-start noise.
The Compounding Effect
These decisions don’t operate independently. A niche model might be served at a conservative precision level, on an older GPU tier, without speculative decoding, with no warm replicas, and with poor batching efficiency. Each factor adds latency individually, and all of them stack. The result is a model that may test acceptably during a brief evaluation, even on the same platform, but fails in production.
Why Popularity Drives These Decisions
Serverless inference providers operate on thin GPU margins. Capacity is expensive, and pre-allocating warm replicas for every model in a 400-model catalog is not economically feasible. The allocation decision is straightforward. They invest deeply in models that generate consistent, high-volume traffic and reduce investment in models that sit idle most of the time.
Catalog size amplifies this effect. When a relatively small provider lists 400 models, only a fraction of those are backed by optimized, warm serving infrastructure. The rest are available in the sense that the weights are present and can be loaded, but the experience of using them at low traffic volumes may be very different from using a well-supported flagship model.
Crucially, each provider makes these bets independently. While one provider may have invested deeply in DeepSeek V4 Pro, another provider has done the same for Kimi K2.6. The catalog pages look identical with a model name, a price per token, an API endpoint, but the infrastructure decisions behind them are completely different. A model being available on a platform is not a signal of how well that platform supports it.
What Internal Testing Revealed
We ran these tests from a DigitalOcean Droplet in NYC1 using a streamed benchmark harness, fixed prompts, and temperature=0 so the comparison stayed focused on provider behavior rather than prompt variance. Each model-provider cell used at least 75 sequential requests at concurrency=1, with warmup requests discarded, and the runs were spread over a few hours so we could observe both typical and off-peak behavior.
If you run a structured benchmark across providers measuring time to first token (TTFT) at concurrency=1, you will see the differences. Rather than comparing only medians, use the coefficient of variation (CV%), standard deviation divided by mean, as the primary signal for consistency. A low CV means predictable latency. A high CV means the model is sometimes fast and sometimes very slow, which is the fingerprint of cold starts and queue variability.
Finding 1: The Same Model Will Behave Differently on Different Providers
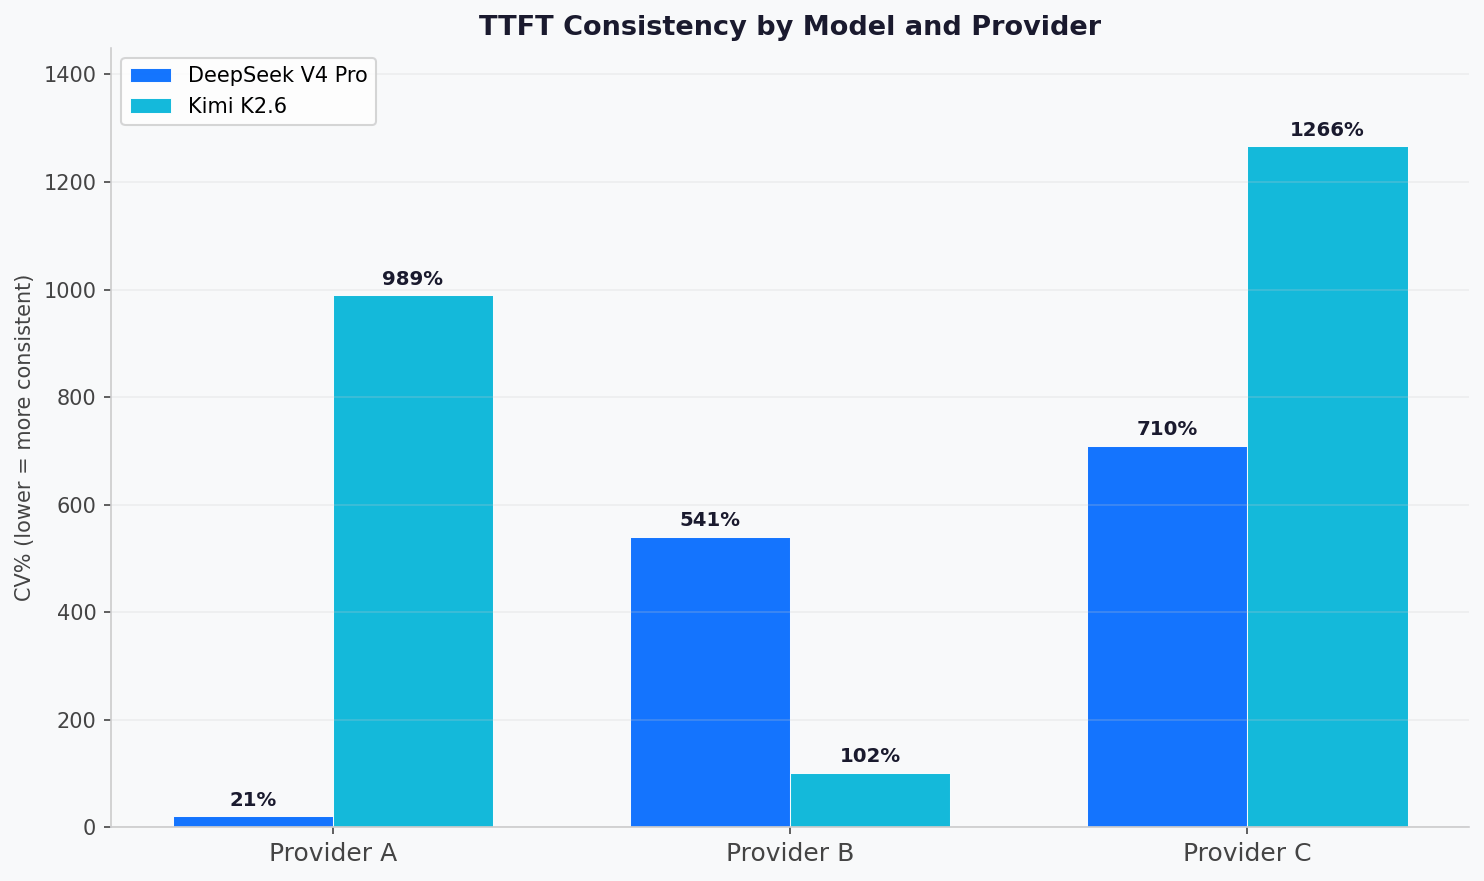
DeepSeek V4 Pro is a widely-used model with strong coding and reasoning performance. In our testing, the best-performing provider for DeepSeek V4 Pro showed a CV of 21%, implying tight, predictable latency with a median TTFT of 0.39 seconds and a p95 of 0.57 seconds. A second provider showed a CV of 541%: median 0.55 seconds, p95 of 6.3 seconds. A third provider showed a CV of 710%: same model, median 0.73 seconds, p95 of 6.9 seconds.
| Provider | Median TTFT | p95 TTFT | CV% |
|---|---|---|---|
| A | 0.39 s | 0.57 s | 21% |
| B | 0.55 s | 6.30 s | 541% |
| C | 0.73 s | 6.91 s | 710% |
A developer who evaluated DeepSeek V4 Pro on one provider and then deployed on another provider would experience production latency that looks completely broken, even though nothing changed except the routing.
Finding 2: There Is No Universal “Best” Provider
Kimi K2.6 tells the opposite story. On one provider, the CV was 989%: median 0.35 seconds, p95 of 5.98 seconds. On a second provider, the CV was 1266%: median 0.43 seconds, p95 of 1.70 seconds but with extreme outliers driving a standard deviation of 5.4 seconds. On the provider that supported it best, the CV dropped to 102%: median 0.25 seconds, p95 of 1.08 seconds, which is roughly 10x more consistent than on the other two platforms.
| Provider | Median TTFT | p95 TTFT | CV% |
|---|---|---|---|
| A | 0.35 s | 5.98 s | 989% |
| B | 0.25 s | 1.08 s | 102% |
| C | 0.43 s | 1.70 s | 1266% |
In our testing, the best-supported provider for DeepSeek V4 Pro was the right choice for that model, while a different provider was the right choice for Kimi K2.6. Both conclusions require measurement. You cannot read either one from the catalog pages.
Finding 3: Breadth-First Providers Require More Thorough Validation
A relatively small provider that lists hundreds of models cannot invest equally in all of them. The infrastructure economics don’t allow it. A curated catalog implies deliberate choices about what to support well. A broad catalog implies the opposite. Many models are listed because they can be loaded, not because they have been optimized.
The data reflects this. For Kimi K2.6, breadth-first providers show CV benchmarks of 989% and 1266%. A curated provider showed CV of 102%, roughly 10x more consistent. For DeepSeek V4 Pro, one provider had invested heavily and showed CV of 21%, while another had not and showed CV of 710%.
With a curated provider, a model being listed is a reasonably strong signal that it has been deliberately provisioned. With a breadth-first provider, a model being listed tells you almost nothing about the quality of support behind it. The catalog page looks identical whether the model has three warm replicas or zero.
That does not mean breadth-first providers are worse overall. For models they have clearly invested in, they can be the best option available. But the variance in support quality across their catalog is higher, which means the validation burden on you is also higher. You cannot assume a model is well-supported just because it appears in a 400-model catalog. You have to check.
The high-CV results are not noise. A CV above 100% means the standard deviation exceeds the mean. In practice, this indicates a bimodal distribution with a cluster of fast requests (warm replica) and a tail of very slow requests (cold start). Median measurements alone will not detect this. If you evaluate a model by firing 10 requests and taking the average, you may never hit a cold start at all.
How to Benchmark Before You Commit
Good benchmarks take at least a few hours to run. Here is a minimal approach that will tell you everything you need to know about a model/provider combination before building on it.
What to measure: Time to first token (TTFT), not end-to-end latency. TTFT isolates whether the model is warm and ready, independent of generation length. It is the most direct signal of infrastructure support.
How many requests: At least 75. Ten to twenty requests will show you the median but not the tail. Cold starts are rare enough that a 20-request benchmark may miss them entirely. At 75 requests, you will almost certainly encounter a cold start if the model is prone to them.
Prompt consistency: Either use prompts that reflect your use case accurately or use a fixed short prompt across all requests. This eliminates prompt-length variance from the results and keeps the comparison clean across providers.
Timing: Space requests a few seconds apart. This avoids artificially benefiting from request batching. You want to observe the model’s behavior under representative single-request conditions, not sustained throughput.
What to compute: Median TTFT, p95 TTFT, standard deviation, and CV%. Median and p95 together tell you the normal experience and the tail. CV% is the single most useful signal for comparing consistency across providers.
CV% thresholds as a quick guide:
- CV < 40%: well-supported, the provider has this model warm and optimized.
- CV 40-100%: some variability, acceptable for latency-tolerant workloads.
- CV > 100%: cold starts are occurring, evaluate whether p95 is acceptable for your use case.
- CV > 300%: Treat as not production-ready on this provider for latency-sensitive applications. Consider a dedicated endpoint.
Timing matters: Run benchmarks at both peak and non-peak hours (early morning, weekends). Cold-start behavior is worst when traffic to the model is lowest. A benchmark run during business hours may show artificially good results because other users have been keeping the model warm.
Common Questions From the Data
Does this mean serverless inference is unreliable?
Not universally. Serverless inference is highly reliable for well-established models with consistent traffic on a given provider. The reliability concern is specific to models where the provider has not made that investment, regardless of how well-supported that same model is elsewhere.
How do I avoid this problem entirely?
Dedicated endpoints eliminate cold-start risk by giving you reserved GPU capacity for your model. The economics only make sense at consistent, predictable traffic volumes. Dedicated capacity costs the same whether you use it or not, but the latency predictability is complete. If you have identified a model you want to use in production, a dedicated endpoint on the provider that best supports it is the most reliable path.
Does the provider with the largest model catalog have the best support?
No. Catalog size is inversely related to average support depth. A provider listing 400 models cannot invest equally in all of them. Smaller, more curated catalogs often reflect deliberate choices about which models to support well. Catalog size tells you about breadth. Only measurement tells you about depth.
Should I use the same provider for all my models?
Not necessarily. As the DeepSeek V4 Pro / Kimi K2.6 inversion shows, different providers have invested in different models. If you are using multiple models in production, the best provider for each model may be different. Routing requests to different providers per model adds architectural complexity, but the latency and reliability benefits can be significant for models where provider support varies widely.
Conclusion
Serverless inference catalogs are not flat lists of equivalently-supported models. They are tiered systems, with models each provider has chosen to invest in receiving warm replicas, optimized quantization, and dedicated engineering attention, while other models share whatever capacity is left over. The tiers are implicit, undocumented, and different on every platform.
The practical consequence is that model evaluation and provider evaluation are two separate decisions. You can assess model quality on any provider with a handful of requests. But before committing a model and provider combination to production, you need to measure consistency specifically, including p95 latency, not just median, across enough requests to expose cold-start behavior.
This is a relatively short experiment. The benchmarks in this article took a few hours to run and surfaced differences that would have cost days of production debugging. Run the numbers before you build on them.
Thanks for learning with the DigitalOcean Community. Check out our offerings for compute, storage, networking, and managed databases.
About the author
Andrew is an NLP Scientist with 8 years of experience designing and deploying enterprise AI applications and language processing systems.
Still looking for an answer?
This textbox defaults to using Markdown to format your answer.
You can type !ref in this text area to quickly search our full set of tutorials, documentation & marketplace offerings and insert the link!
 This work is licensed under a Creative Commons Attribution-NonCommercial- ShareAlike 4.0 International License.
Become a contributor for community
Get paid to write technical tutorials and select a tech-focused charity to receive a matching donation.

DigitalOcean Documentation
Full documentation for every DigitalOcean product.

Resources for startups and AI-native businesses
The Wave has everything you need to know about building a business, from raising funding to marketing your product.
The developer cloud
Scale up as you grow — whether you're running one virtual machine or ten thousand.

Start building today
From GPU-powered inference and Kubernetes to managed databases and storage, get everything you need to build, scale, and deploy intelligent applications.
