By Vadym Kalsin and Brian Hogan

Introduction
The TICK stack is a collection of products from the developers of the time-series database InfluxDB. It is made up of the following components:
- Telegraf collects time-series data from a variety of sources.
- InfluxDB stores time-series data.
- Chronograf visualizes and graphs the time-series data.
- Kapacitor provides alerting and detects anomalies in time-series data.
You can use each of these components separately, but if you use them together, you’ll have a scalable, integrated open-source system for processing time-series data.
In this tutorial you’ll set up and use this platform as an open-source monitoring system. You’ll generate a bit of CPU usage and receive an email alert when the usage gets too high.
Prerequisites
Before you get started, you’ll need the following:
- One CentOS 7 server set up by following the CentOS 7 initial server setup guide, including a sudo non-root user and a firewall.
- If you wish to secure the Chronograf user interface as explained in Step 7, you’ll need a GitHub account that’s part of a GitHub organization. Follow this tutorial to create a GitHub organization.
Step 1 — Adding the TICK Stack Repository
The TICK stack compoents aren’t available through the package manager by default. All TICK stack components use the same repository, so we’ll set up a repository configuration file to make installation seamless.
Create this new file:
- sudo vi /etc/yum.repos.d/influxdata.repo
Place the following configuration in the new file:
[influxdb]
name = InfluxData Repository - RHEL $releasever
baseurl = https://repos.influxdata.com/rhel/$releasever/$basearch/stable
enabled = 1
gpgcheck = 1
gpgkey = https://repos.influxdata.com/influxdb.key
Save the file and exit the editor. Now we can install and configure InfluxDB
Step 2 — Installing InfluxDB and Configuring Authentication
InfluxDB is an open-source database optimized for fast, high-availability storage and retrieval of time series data. InfluxDB is great for operations monitoring, application metrics, and real-time analytics.
Run the following command to install InfluxDB:
- sudo yum install influxdb
During the installation process, you will be asked to import a GPG key. Confirm that you wish to import this key so the installation can continue.
Once the installation completes, start the InfluxDB service:
- sudo systemctl start influxdb
Then ensure the service is running properly:
- systemctl status influxdb
You will see the following status, verifying that the service is running:
[secondary_label Output
    ● influxdb.service - InfluxDB is an open-source, distributed, time series database
       Loaded: loaded (/usr/lib/systemd/system/influxdb.service; enabled; vendor preset: disabled)
       Active: active (running) since Tue 2017-02-07 13:19:31 EET; 2min 46s ago
         Docs: https://docs.influxdata.com/influxdb/
     Main PID: 14290 (influxd)
InfluxDB is running, but you’ll want to enable user authentication to restrict access to the database. Lets create at least one admin user.
Start the InfluxDB console:
- influx
Execute the following command to create a new admin user. We’ll create a sammy user with the password sammy_admin, but you can use whatever you’d like.
- CREATE USER "sammy" WITH PASSWORD 'sammy_admin' WITH ALL PRIVILEGES
Verify that the user is created:
- show users
You’ll see the following output, verifying that your user was created:
Output    user  admin
    ----  -----
    sammy true
Now that the user exists, exit the InfluxDB console:
- exit
Now open the file /etc/influxdb/influxdb.conf in your editor. This is the configuration file for InfluxDB.
- sudo vi /etc/influxdb/influxdb.conf
Locate the [http] section, uncomment the auth-enabled option, and set its value to true :
...
    [http]
      # Determines whether HTTP endpoint is enabled.
      # enabled = true

      # The bind address used by the HTTP service.
      # bind-address = ":8086"

      # Determines whether HTTP authentication is enabled.
      auth-enabled = true
...
Then save the file, exit the editor, and restart the InfluxDB service:
- sudo systemctl restart influxdb
InfluxDB is now configured, so let’s install Telegraf, an agent for collecting metrics.
Step 3 — Installing and Configuring Telegraf
Telegraf is an open-source agent that collects metrics and data on the system it’s running on, or from other services. Telegraf then writes the data to InfluxDB or other outputs.
Run the following command to install Telegraf:
- sudo yum install telegraf
Telegraf uses plugins to input and output data. The default output plugin is for InfluxDB. Since we’ve enabled user authentication for IndexDB, we have to modify Telegraf’s configuration file to specify the username and password we’ve configured. Open the Telegraf configuration file in your editor:
- sudo vi /etc/telegraf/telegraf.conf
Locate the [outputs.influxdb] section and provide the username and password:
    [[outputs.influxdb]]
      ## The full HTTP or UDP endpoint URL for your InfluxDB instance.
      ## Multiple urls can be specified as part of the same cluster,
      ## this means that only ONE of the urls will be written to each interval.
      # urls = ["udp://localhost:8089"] # UDP endpoint example
      urls = ["http://localhost:8086"] # required
      ## The target database for metrics (telegraf will create it if not exists).
      database = "telegraf" # required

      ...

      ## Write timeout (for the InfluxDB client), formatted as a string.
      ## If not provided, will default to 5s. 0s means no timeout (not recommended).
      timeout = "5s"
      username = "sammy"
      password = "sammy_admin"
      ## Set the user agent for HTTP POSTs (can be useful for log differentiation)
      # user_agent = "telegraf"
      ## Set UDP payload size, defaults to InfluxDB UDP Client default (512 bytes)
      # udp_payload = 512
Save the file, exit the editor, and start Telegraf:
- sudo systemctl start telegraf
Then check whether the service is running properly:
- systemctl status telegraf
You will see the following status, indicating Telegraf is running.
Output    ● telegraf.service - The plugin-driven server agent for reporting metrics into InfluxDB
       Loaded: loaded (/usr/lib/systemd/system/telegraf.service; enabled; vendor preset: disabled)
       Active: active (running) since Tue 2017-02-07 13:32:36 EET; 3min 27s ago
         Docs: https://github.com/influxdata/telegraf
     Main PID: 14412 (telegraf)
Telegraf is now collecting data and writing it to InfluxDB. Let’s open the InfluxDB console and see which measurements Telegraf is storing in the database. Connect with the username and password you previously configured:
- influx -username 'sammy' -password 'sammy_admin'
Once logged in, execute this command to see the available databases:
- show databases
You’ll see the telegraf database listed in the output:
Output    name: databases
    name
    ----
    _internal
    telegraf
Note: If you do not see the telegraf database, check the Telegraf settings you configured to ensure you’ve specified the proper username and password.
Let’s see what Telegraf is storing in that database. Execute the following command to switch to the Telegraf database:
- use telegraf
Display the various measurements Telegraf has collected by executing this command:
- show measurements
You’ll see the following output:
Output    name: measurements
    name
    ----
    cpu
    disk
    diskio
    kernel
    mem
    processes
    swap
    system
As you can see, Telegraf has collected and stored lots of information in this database.
There are more then 60 input plugins for Telegraf. It can gather metrics from many popular services and databases, including:
- Apache
- Cassandra
- Docker
- Elasticsearch
- Graylog
- IPtables
- MySQL
- PostgreSQL
- Redis
- SNMP
- and many others
You can view usage instructions for each input plugin by running telegraf -usage plugin-name in a terminal window.
Exit the InfluxDB console:
- exit
Now that we know Telegraf is storing measurements, let’s set up Kapacitor to process the data.
Step 4 — Installing Kapacitor
Kapacitor is a data processing engine. It lets you plug in your own custom logic to process alerts with dynamic thresholds, match metrics for patterns, or identify statistical anomalies. We will use Kapacitor to read data from InfluxDB, generate alerts, and send those alerts to a specified email address.
Run the following command to install Kapacitor:
- sudo yum install kapacitor
Open the Kapacitor configuration file in your editor:
- sudo vi /etc/kapacitor/kapacitor.conf
Locate the [[influxdb]] section and provide the username and password to connect to the InfluxDB database:
# Multiple InfluxDB configurations can be defined.
# Exactly one must be marked as the default.
# Each one will be given a name and can be referenced in batch queries and InfluxDBOut nodes.
[[influxdb]]
  # Connect to an InfluxDB cluster
  # Kapacitor can subscribe, query and write to this cluster.
  # Using InfluxDB is not required and can be disabled.
  enabled = true
  default = true
  name = "localhost"
  urls = ["http://localhost:8086"]
  username = "sammy"
  password = "sammy_admin"
...
Save the file, exit the editor, and start Kapacitor:
- sudo systemctl daemon-reload
- sudo systemctl start kapacitor
Now let’s verify that Kapacitor is running. Check Kapacitor’s task list with the following command:
- kapacitor list tasks
If Kapacitor is up and running, you’ll see an empty list of tasks, like this:
Output ID Type Status Executing Databases and Retention Policies
With Kapacitor installed and configured, let’s install the user interface component of the TICK stack so we can see some results and configure some alerts.
Step 5 — Installing and Configuring Chronograf
Chronograf is a graphing and visualization application that provides tools to visualize monitoring data and create alerting and automation rules. It includes support for templates, and has a library of intelligent, pre-configured dashboards for common data sets. We’ll configure it to connect to the other components we’ve installed.
Download and install the latest package:
- wget https://dl.influxdata.com/chronograf/releases/chronograf-1.2.0~beta3.x86_64.rpm
- sudo yum localinstall chronograf-1.2.0~beta3.x86_64.rpm
Then start the Chronograf service:
- sudo systemctl start chronograf
Note: If you are using FirewallD, configure it to allow connections to port8888:
- sudo firewall-cmd --zone=public --permanent --add-port=8888/tcp
- sudo firewall-cmd --reload
Follow the tutorial How To Set Up a Firewall Using FirewallD on CentOS 7 to learn more about FirewallD rules.
Now you can access the Chronograf interface by visiting http://your_server_ip:8888 in your web browser.
You’ll see a welcome page like the one in the following figure:
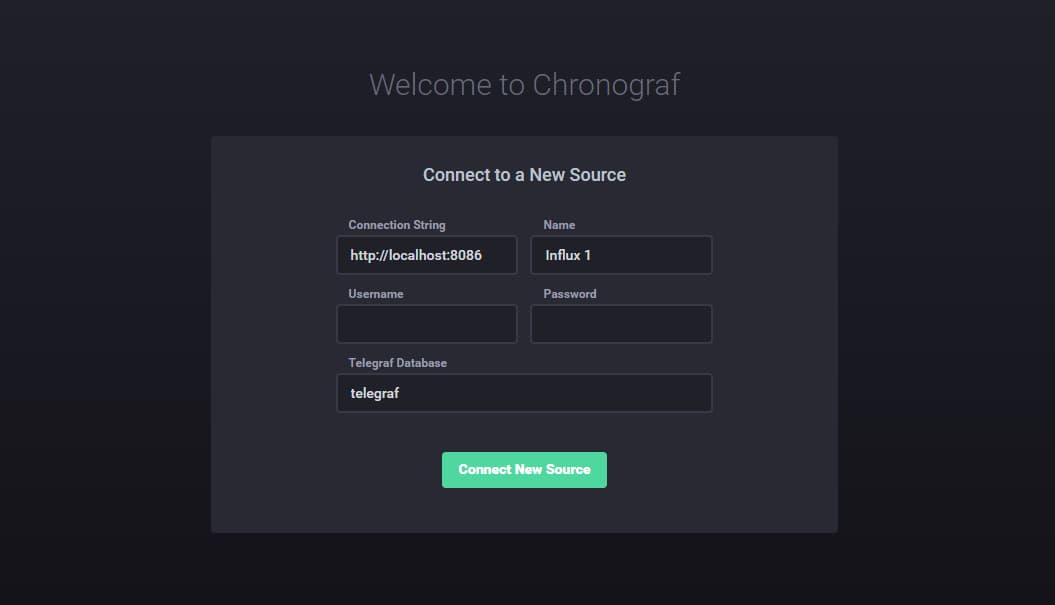
Enter the username and password for the InfluxDB database and click Connect New Source to proceed.
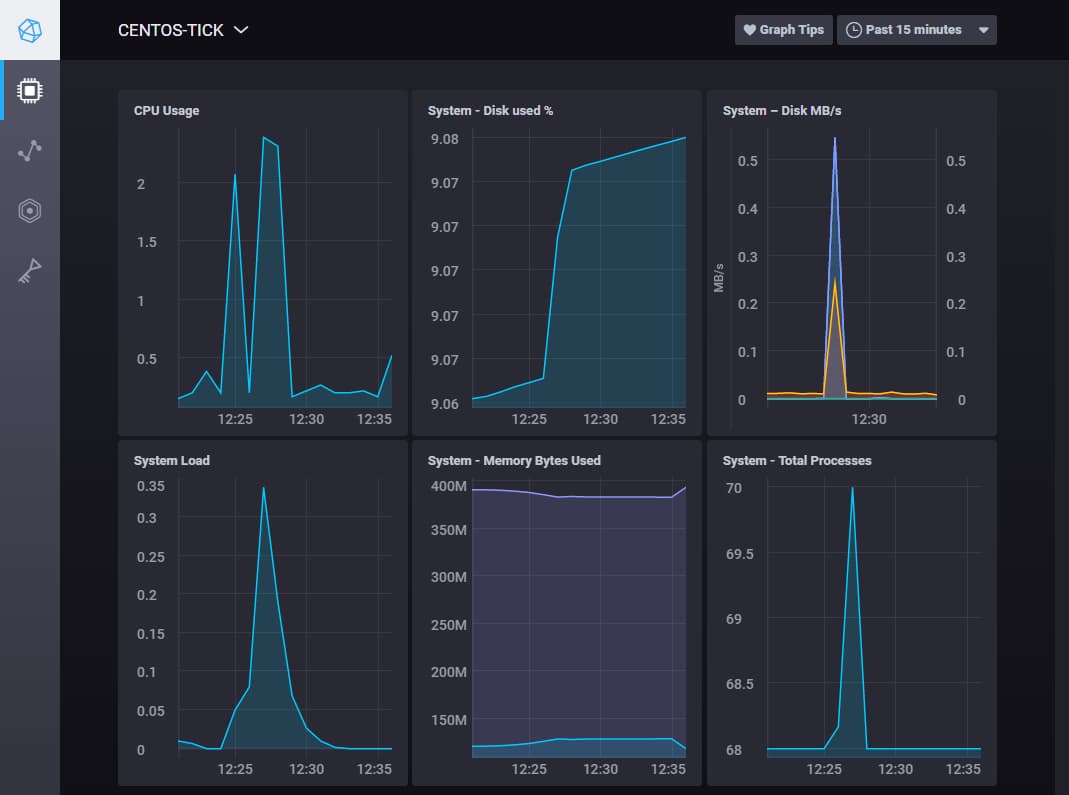
Once connected, you will see a list of hosts. Click on the hostname for your server to open a dashboard with a series of system-level graphs about your host, as shown in the following image:
Now let’s connect Chronograf to Kapacitor to set up an alert. Hover over the last item in the left navigation menu and click Kapacitor to open the configuration page.
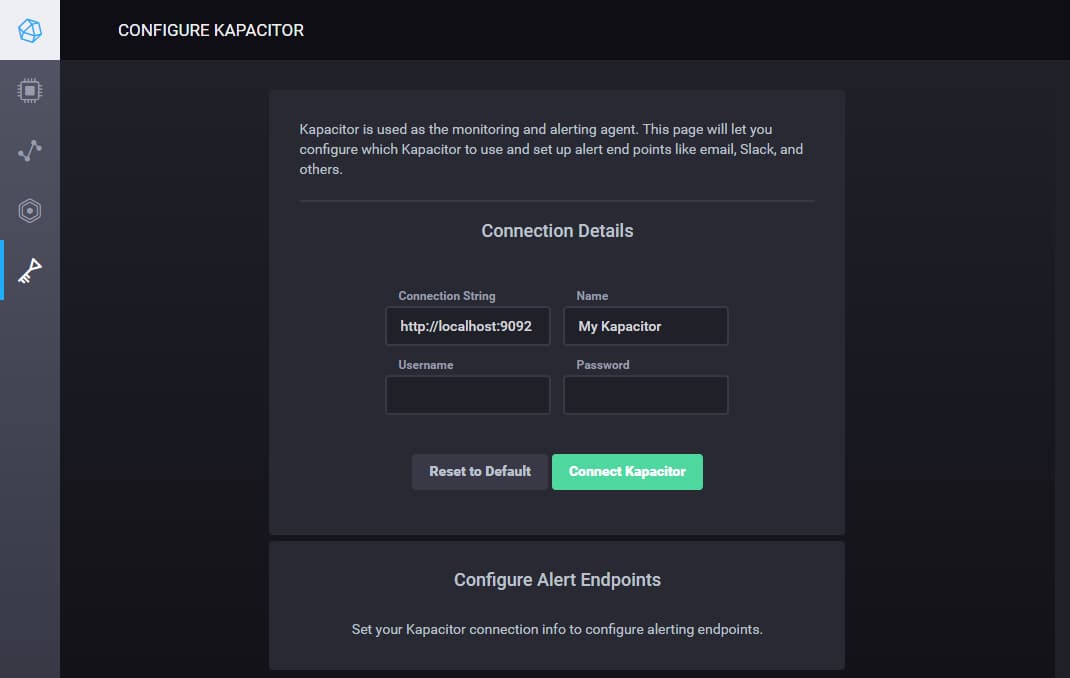
Use the default connection details; we didn’t configure a username and password for Kapacitor. Click Connect Kapacitor. Once Kapacitor successfully connects, you’ll see the Configure Alert Endpoints section appear below the form.
Kapacitor supports multiple alert endpoints:
- HipChat
- OpsGenie
- PagerDuty
- Sensu
- Slack
- SMTP
- Talk
- Telegram
- VictorOps
The simplest communication method is SMTP, which is selected by default. Fill in the From email field with the address from which alerts will be sent, and click Save. You can leave the rest of the details at the default values.
With the configuration in place, let’s create some alerts.
Step 6 — Configuring Alerts
Let’s set up a simple alert that looks for high CPU usage.
Hover over the left navigation menu, find the ALERTING section and click Kapacitor Rules. Then click Create New Rule.
In the first section, select the time-series by clicking on telegraf.autogen. Then select system from the list that appears. Then select load1. You will immediately see a corresponding graph in the section below.
Above the graph, locate the field that says Send Alert where load1 is Greater Than and enter 1.0 for the value.
Then paste the following text into the Alert Message field to configure the text of the alert message:
{{ .ID }} is {{ .Level }} value: {{ index .Fields "value" }}
You can hover your mouse over the entries in the Templates section to get descriptions of each field.
Then choose the Smtp option from the Send this Alert to dropdown list and enter your email address in the associated field.
By default, you will receive messages in the JSON format, like this:
{
    "Name":"system",
    "TaskName":"chronograf-v1-50c67090-d74d-42ba-a47e-45ba7268619f",
    "Group":"nil",
    "Tags":{
        "host":"centos-tick"
    },
    "ID":"TEST:nil",
    "Fields":{
        "value":1.25
    },
    "Level":"CRITICAL",
    "Time":"2017-03-08T12:09:30Z",
    "Message":"TEST:nil is CRITICAL value: 1.25"
}
You can set up more human-readable messages for the mail alerts. To do this, enter your message in the text box with the Put email body text here placeholder.
You can rename this rule by clicking its name on the top left corner of the page and entering a new name.
Finally, click Save Rule on the top right to finish configuring this rule.
To test this newly-created alert, create a CPU spike by using the dd command to read data from /dev/zero and send it to /dev/null:
- dd if=/dev/zero of=/dev/null
Let the command run for several minutes, which should be enough to create a spike. You can stop the command at any time by pressing CTRL+C.
After a while, you will receive an e-mail message. Additionally, you can see all of your alerts by clicking Alert history in the left navigation menu of the Chronograf user interface.
Note:Once you’ve verified that you can receive alerts, be sure to stop the dd command you started with CTRL+C.
We’ve got alerts running, but anyone can log into Chronograf. Let’s restrict acess.
Step 7 — Securing Chronograf with OAuth
By default, anyone who knows the address of the server running the Chronograf application can view any data. It’s acceptable for the testing environment but not for production. Chronograf supports OAuth authentication for Google, Heroku, and GitHub. We’ll configure logging in via a GitHub account, so you’ll need one to proceed.
First, register a new application with GitHub. Log into your GitHub account and navigate to https://github.com/settings/applications/new.
Then fill in the form with the following details:
- Fill in Application name with Chronograf or a suitable descriptive name.
- For the Homepage URL, use
http://your_server_ip:8888. - Fill in the Authorization callback URL with
http://your_server_ip:8888/oauth/github/callback. - Click Register application to save the settings.
- Copy the Client ID and Client Secret values provided on the next screen.
Next, edit Chronograf’s systemd script to enable authentication. Open the file /usr/lib/systemd/system/chronograf.service:
- sudo vi /usr/lib/systemd/system/chronograf.service
Then locate the [Service] section and edit the line starting with ExecStart=:
[Service]
User=chronograf
Group=chronograf
ExecStart=/usr/bin/chronograf --host 0.0.0.0 --port 8888 -b /var/lib/chronograf/chronograf-v1.db -c /usr/share/chronograf/canned -t 'secret_token' -i 'your_github_client_id' -s 'your_github_client_secret' -o 'your_github_organization'
KillMode=control-group
Restart=on-failure
The secret_token is required by all OAuth providers. Set it to a random string. Use your Github Client ID, Github Client Secret, and Github Organization for the other values.
Warning: If you omit the Github organization option from the command, any Github user will be able to log in to your Chronograf instance. Create a Github organization and add the appropriate users to the organization to restrict access.
Save the file, exit the editor, and restart the Chronograf service:
- sudo systemctl daemon-reload
- sudo systemctl restart chronograf
Open http://your_server_ip:8888 to access the Chronograf interface. This time you’ll be presented with a Login with Github button. Click the button to log in and you’ll be asked to allow the application to access your Github account. Once you allow access, you’ll be logged in.
Conclusion
In this tutorial you saw how the TICK stack can be a powerful tool for storing, analyzing and visualizing time series data. It has many features and use cases. For example, you can use Kapacitor to perform anomaly detection or build live leaderboard of game scores. You can learn more about TICK stack by reading the official documentation.
Thanks for learning with the DigitalOcean Community. Check out our offerings for compute, storage, networking, and managed databases.
About the author(s)
Monitoring engineer
Managed the Write for DOnations program, wrote and edited community articles, and makes things on the Internet. Expertise in DevOps areas including Linux, Ubuntu, Debian, and more.
Still looking for an answer?
This textbox defaults to using Markdown to format your answer.
You can type !ref in this text area to quickly search our full set of tutorials, documentation & marketplace offerings and insert the link!
Cool tool! I love that it displays the graphs in real time.
One quick note, I had to run the wget from influxdata.com as sudo. Otherwise the install went flawlessly.
Hi,Can YOU please explain how can we run multiple host having different apps like few running docker containers,few with apache,nginx etc.
Thanks! but i cannot receive email successfully, I just modify from address to alert@mycom.com, nothing else changed.(and I can see alter log in alter history page) So in such a situation, how to find the reason? Does exist some log could lookup?
So it is okay to install all four pieces in one single server.
If so, what should be the spec for the server?
How big should be the storage drive for the database?
Would a old server handle TICK Stack?
Hi buddy, It has been a very useful article. I have a question to ask you. How can I add a new host?
hello! and thanks for this tutorial, but i have a question once we configure telegraf, after this how can we use telegraf with influxdb in raspberry pi.it’ll be highly appreciable.
If my Github OAuth login process is failing, where would I find log files for this? I have authorized the use of this login to my GH_ORG, but when I click the login button, the site spins and spins, then ends up doing nothing.
 This work is licensed under a Creative Commons Attribution-NonCommercial- ShareAlike 4.0 International License.
Become a contributor for community
Get paid to write technical tutorials and select a tech-focused charity to receive a matching donation.

DigitalOcean Documentation
Full documentation for every DigitalOcean product.

Resources for startups and AI-native businesses
The Wave has everything you need to know about building a business, from raising funding to marketing your product.
The developer cloud
Scale up as you grow — whether you're running one virtual machine or ten thousand.

Start building today
From GPU-powered inference and Kubernetes to managed databases and storage, get everything you need to build, scale, and deploy intelligent applications.
