Programmatically gain insight into your apps using the new Monitoring API
By Brett Snyder
Principal Engineer
- Published:
- 2 min read
Delivering superior customer experiences is a key priority for most startups and small businesses. One way to do that is to regularly monitor the performance of the infrastructure on which your apps run. This allows you to detect problems early, avoid outages, and prevent customer dissatisfaction.
DigitalOcean provides a monitoring service that enables you to track infrastructure metrics like memory usage, disk usage, load average – all at no additional cost to DigitalOcean users. You can set alerts to be notified via email or Slack, should metrics surpass any thresholds that you define. DigitalOcean monitoring was previously only available via the cloud control panel, and we’re excited that now you can access monitoring metrics and insights data through our API. This enables DigitalOcean API users to more easily view and monitor their metrics, ensuring they know when issues arise and can improve their performance over time.
Why should you be using the Monitoring API?
This extension of the DigitalOcean API will allow you to programmatically manage your alert policies and retrieve Droplet insight metrics from your own applications and scripts. This enables DigitalOcean users to create automated alerting solutions, custom metrics dashboards, or pass performance data on to end users. These new additions can also be leveraged to reduce the time spent manually managing alert policies via the DigitalOcean cloud console.
Manage alert policies or retrieve insights data programmatically
There are two main facets of the new API offering:
- Alerting policies: Alert policies are user-created rules that define thresholds for resource consumption. When a usage exceeds the threshold, notifications are dispatched through email or Slack. You now have the ability to manage alert policies for CPU usage, bandwidth, memory utilization, and more with the API. For more information, see the API reference docs for AlertPolicy.
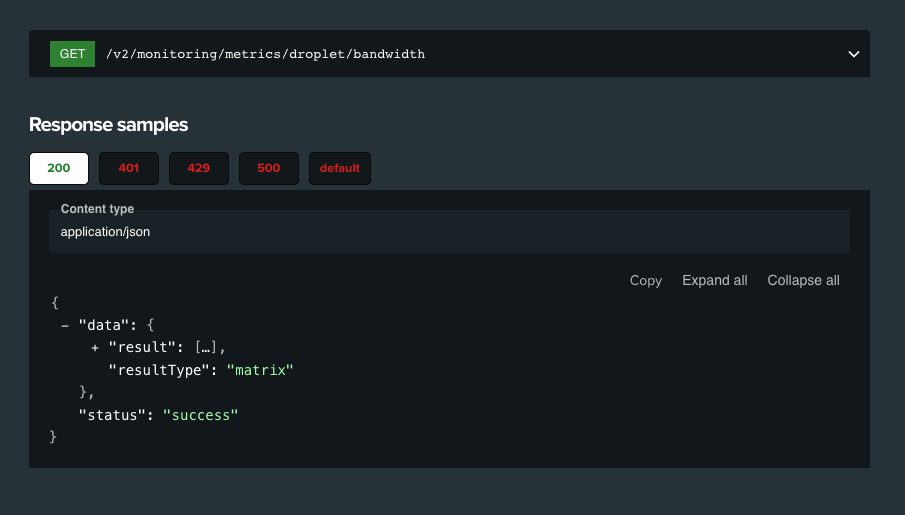
- Monitored resources: A monitored resource is something about which metrics are collected. For example, you should be able to retrieve activity of a Droplet instance (CPU, memory, disk, bandwidth, and load average data). For a list of the available monitored resources, see the monitored resource list.
We hope that you are excited about this release and will give the monitoring API a try. Additionally, the godo library, as well as doctl, have also been updated with the functionality to manage alert policies. The API will continue to evolve, and more products will be supported for insights metric data.
Happy coding!
Brett Snyder
Senior Software Engineer
About the author
Related Articles

Upcoming GPU Pricing Updates
- July 21, 2026
- 2 min read
Scale Faster with Managed Weaviate: Now in Public Preview on DigitalOcean
- July 9, 2026
- 4 min read

DigitalOcean Evaluations: Production Model and Router Testing for the Inference Stack
- July 1, 2026
- 3 min read