A glimpse into network availability
By Armando Migliaccio
- Published:
- 7 min read
A simple yet effective approach to network monitoring
As a Cloud Service provider, DigitalOcean takes a lot of care in designing and implementing infrastructure and services that are both fault tolerant and highly available. We make sure that services are well monitored so that when failures do occur, we can anticipate and minimize the impact to our customers.
The same guiding principles apply to monitoring Droplet networking: while we pride ourselves for the simplicity of the solutions we offer to our customers, simplicity is a core design principle we take seriously, especially when looking at the state of networking infrastructure (which is known to be complex and multi-dimensional).
In this blog post, we share the journey that took us from realization to revelation: we will go through the steps that have taken us from an incomplete picture of the network state experienced by customer Droplets to a near real-time EKG-like signal for each and every single Droplet that runs on our infrastructure.
The premise
When it comes to our ability to look into the state of our global network, we realized that a preliminary step towards a more scalable and manageable architecture was a necessary prerequisite to having a solid strategy in place for monitoring the state of our network. It is common knowledge that layer-2 topologies, especially large ones, are inherently hard to monitor, and as we recently transformed our data center networking to more closely resemble layer-3 fabrics, that meant that it suddenly became easier to understand packets as they flow through our physical and virtual pipes to and from their targets.
When we say easier, we do not necessarily mean that there were no challenges left for us to tackle; network traffic takes place at many layers of the well-known ISO/OSI stack, involving multiple application protocols and distributed endpoints. There are literally hundreds (if not more) of companies out there whose core business is to provide networking monitoring solutions for small and large enterprises, so why did we believe that none of them could help us in having a crisp picture of the state of our network? Because, as cloud providers, we typically have additional challenges given the scale, and the level of customization employed to achieve such scale.
It is noteworthy that we do leverage a number of such solutions already, but the cost of acquiring and operating a monitoring solution to achieve high fidelity are just as important to us. As a cloud provider, we have an intimate knowledge of how our network operates: we are the ones in charge of deploying and maintaining the hardware, software, and the automation required to literally stitch the logical path to and from our droplets as they come to life in our infrastructure. That puts us into an incredibly compelling vantage point when it comes to instrumenting the network.
To understand what we mean by that, let us consider our attempt at capturing the cloud networking universe the way we see it. One could say that when it comes to delivering packets in such a world, there can be an awful lot of things that can go wrong. As each dimension is not independent from another, this only makes matters more complicated.
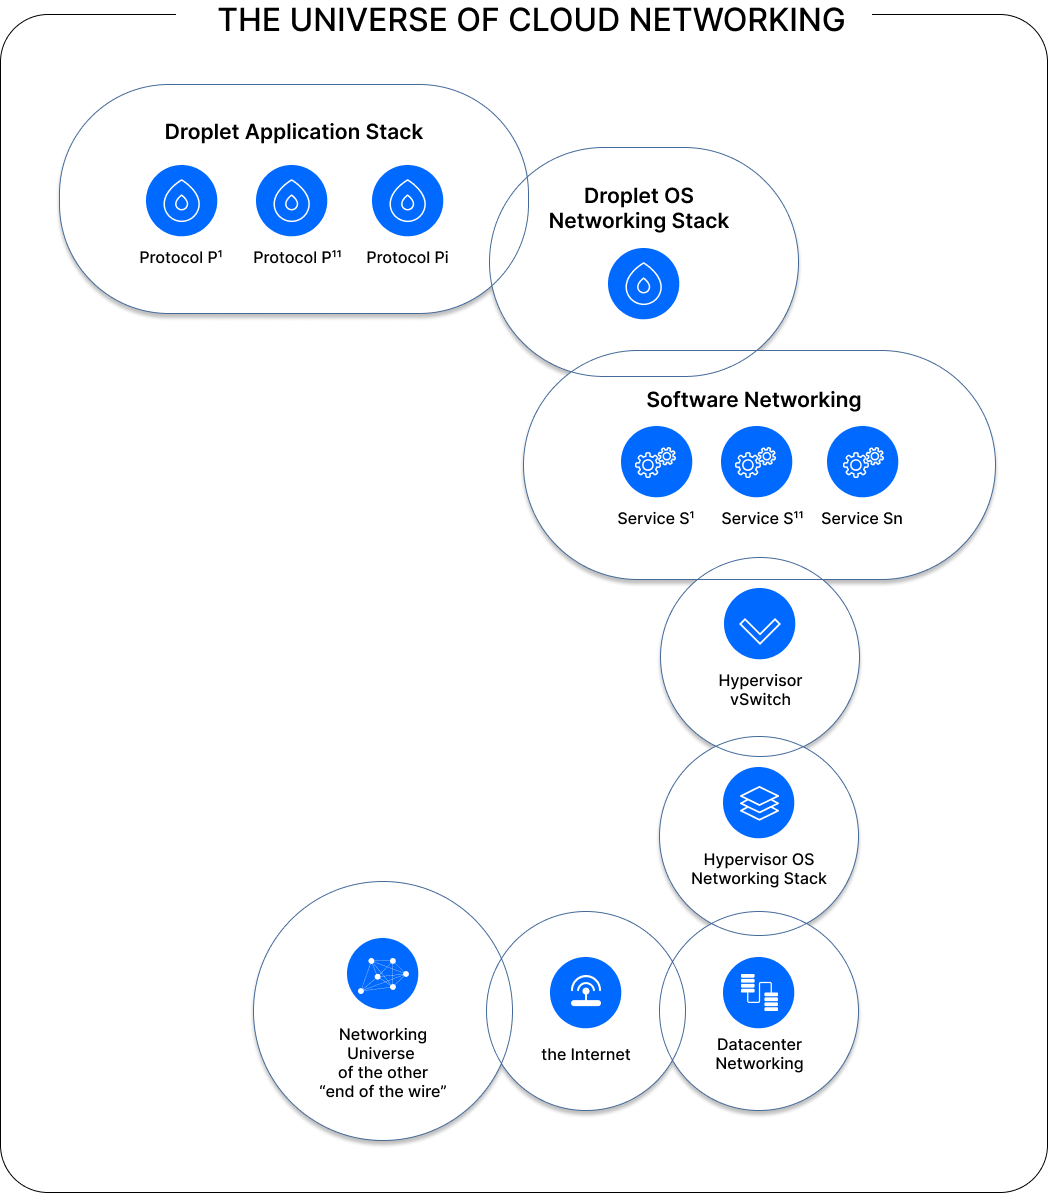
We initially focus on how Droplets, one of our core product offerings, connect to the internet via their public address (it being IPv4, IPv6 or Reserved IP). That means that packets have to traverse a number of stacks: the Droplet virtualization stack, the Droplet’s OS networking stack itself, and so on. As packets flow through a layer-3 fabric, there are routing decisions involved at each step, and the forwarding plane must be programmed in advance for these decisions to be taken correctly.
If we manage to efficiently introduce instrumentation points in each of these steps, and we can do that without overhead and without perturbing the path under instrumentation, we can then coalesce the collected data into something succinct to verify our customers are experiencing their expectations being met in best-of-class cloud infrastructure.
The journey toward our solution
To articulate how we went on with our journey towards a solution, let us take a step back and attempt to define what we mean by the status of the network. Also, as you go deeper in this section, you may see it gets heavy on the math side: do not let that scare you! All we have attempted to do was to break down the complexity into smaller more tractable problems that are easier to reason about.
Reliability and Availability
Reliability, according to the ANSI Standard Glossary of Software Engineering Terminology, is defined as the ability of a system or component to perform its required functions under stated conditions for a specified period of time. Availability is defined as the degree to which a system or component is operational and accessible when required for use.
While both indicators can be expressed in the form of a probability function, the subtle difference between the two is that reliability factors in the aspect of specification while availability does not. In other words, one can say that:
A reliable system is also available, but an available system is not necessarily reliable.
Now, if we look at these definitions in the context of networking, and in particular in the context of cloud networking at DigitalOcean, we could say that in order to measure network reliability we may need to have the specification of what we consider the correct conditions under which the network is deemed reliable. As that implies the aspect of performance (latency, throughput, and jitter), that is a much bigger problem in itself and best left for another blog post.
Mastering the meaning of Availability
As it made sense for us to focus on measuring network availability first we know that availability is commonly defined as the probability that a status function X(t) is 1 at time t > 0:
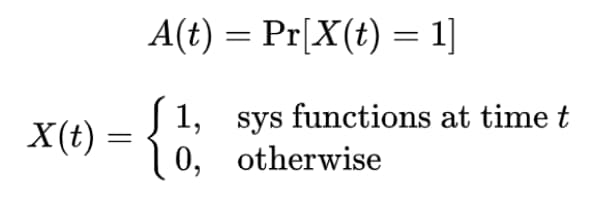
The evaluation that “the system functions at time t” is the result of the execution of a number of finite and deterministic steps performed on the system under observation at time t. X(t) is therefore a boolean function, and boolean functions are easy to compute, right? The hard part then is to measure such a status function taking into account the complexity presented in the cloud universe shown before. In abstract terms, one attempt at defining such status function can be the following:
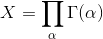
𝞪 is the subsystem in which the overall cloud networking universe can be broken down into. But, what does the above formula mean exactly?
The next paragraph will make that clear.
Plain English
The status function X is the combination of status functions for each of the elements 𝞪 that make up the cloud networking universe.
This product formula can be more or less accurate depending on how many independent elements of the cloud networking universe are known and efficiently computable in near real-time. For instance, when focusing on DigitalOcean’s Droplet network connectivity, there are a number of status functions that we looked to implement:
- 𝚪(𝞪) = Software Networking, namely the active presence of OpenFlow rules (Open vSwitch is a foundational open source component in use at DigitalOcean) that are the result of the combination of services aimed at providing connectivity to the droplet public interface, as well as the operation of service daemons involved in the processing of flow rules. For instance, these may entail flows that enable all the use cases associated to public networking, namely v4 connectivity, v6 connectivity and FLIP connectivity (optionally), and all the access-level services that make v4 and v6 connectivity functional like DHCP, ARP, NDP, ICMP, or metadata access. If this status function is 0, then there is no way that anything can pass through the droplet OS networking stack correctly.
- 𝚪(𝞪) = Hypervisor vSwitch, namely that the datapath is operational, i.e. the vSwitch kernel module is indeed passing packets to and from userspace. For example, this may require that periodic probing be performed to validate that well-known traffic above all else is processed correctly (e.g. ARP, NDP, DHCP, ICMP, etc).
- 𝚪(𝞪) = Hypervisor OS networking stack, namely that the hypervisor is connected to the networking fabric: for Layer-3 enabled data centers, this means that the HV-as-a-router is reachable for both the IPv4 and IPv6 protocol families on the respective data center VLANs.
- 𝚪(𝞪) = Host Route advertisement, namely the existence of host route advertisement(s) for the droplet in the region’s RIB (routing information base), with the next-hop pointing to the hypervisor where the droplet is running, implies that packets are meant be routed to the HV (barred from other networking misconfiguration/failures).
As we found ways to measure, record, and export telemetry data associated with each of these functions, we were then able to distill that into a simple indicator that over time plots the level of availability experienced by each customer Droplet. The snapshot below shows the network availability for the public IPv4 path of a real customer droplet that has experienced some downtime due to a failed software upgrade on our hypervisors. As the Droplet was evacuated, its network availability was promptly restored. The monitoring solution we put in place was able to catch the failure in the act, and supply our support team with near real-time data to assess and mitigate the outage.
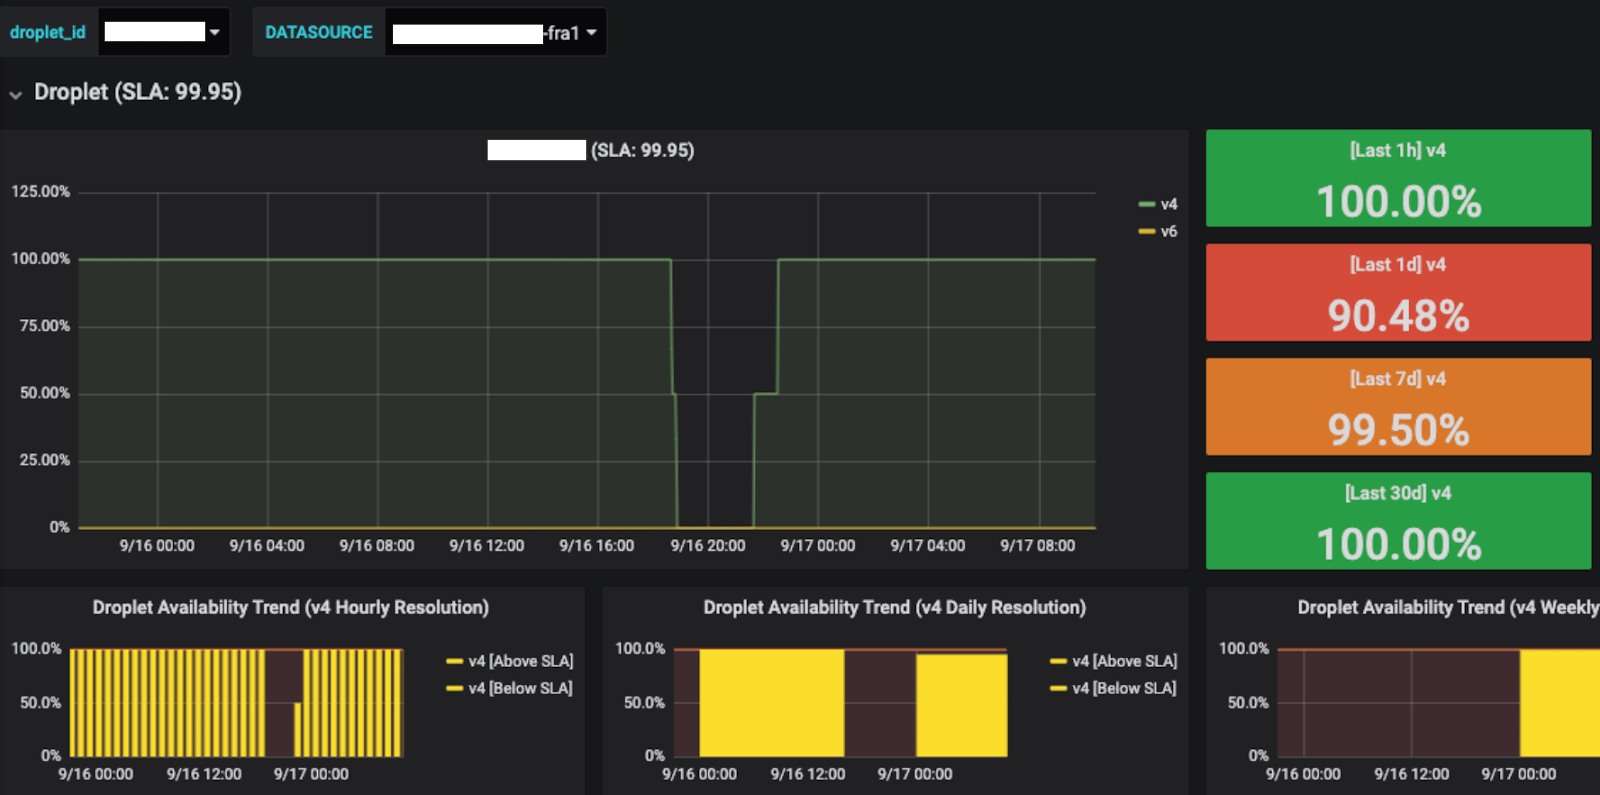
The versatility of this tool, built on standard and open source technologies, not only helped our support team in having better visibility during an outage, but it helps across the entire organization as we get more and more aware of the true potential of underlying the data which can be drilled down by region, hypervisor, Droplet, as well as rolled up globally.
Final considerations
The proposed formalization can be seen as an attempted factorization of the complex problem of network availability in the cloud: rather than looking at networking end-to-end, the proposed approach aimed at breaking down the various elements that affect network availability into smaller more tractable problems that are addressed individually. This has a number of positive implications: i) it helped limit the engineering effort to deliver a minimum viable solution, ii) it allowed us to iterate through consecutive levels of refinement, iii) it helped us handle the scale at which our infrastructure operates, and last but not least, iv) it helped us deliver value to our customers fast!
About the author
Related Articles

The Inference Alpha: Maximizing Frontier Models on AMD
Balaji Varadarajan
- June 10, 2026
- 12 min read

The Inference Tax: How Prefix-Aware Routing Eliminates the Hidden Cost of LLMs at Scale
- June 1, 2026
- 13 min read
DigitalOcean Serverless Inference: A Deep Dive
- June 1, 2026
- 17 min read