By Cristian Marius Tiutiu, Bikram Gupta and Easha Abid

Introduction
Organizations that are increasingly adopting Kubernetes to manage their containers need a solution to monitor the health of their distributed system. For this reason, you enter Prometheus - a powerful open-source tool to monitor containerized applications in your K8s space.
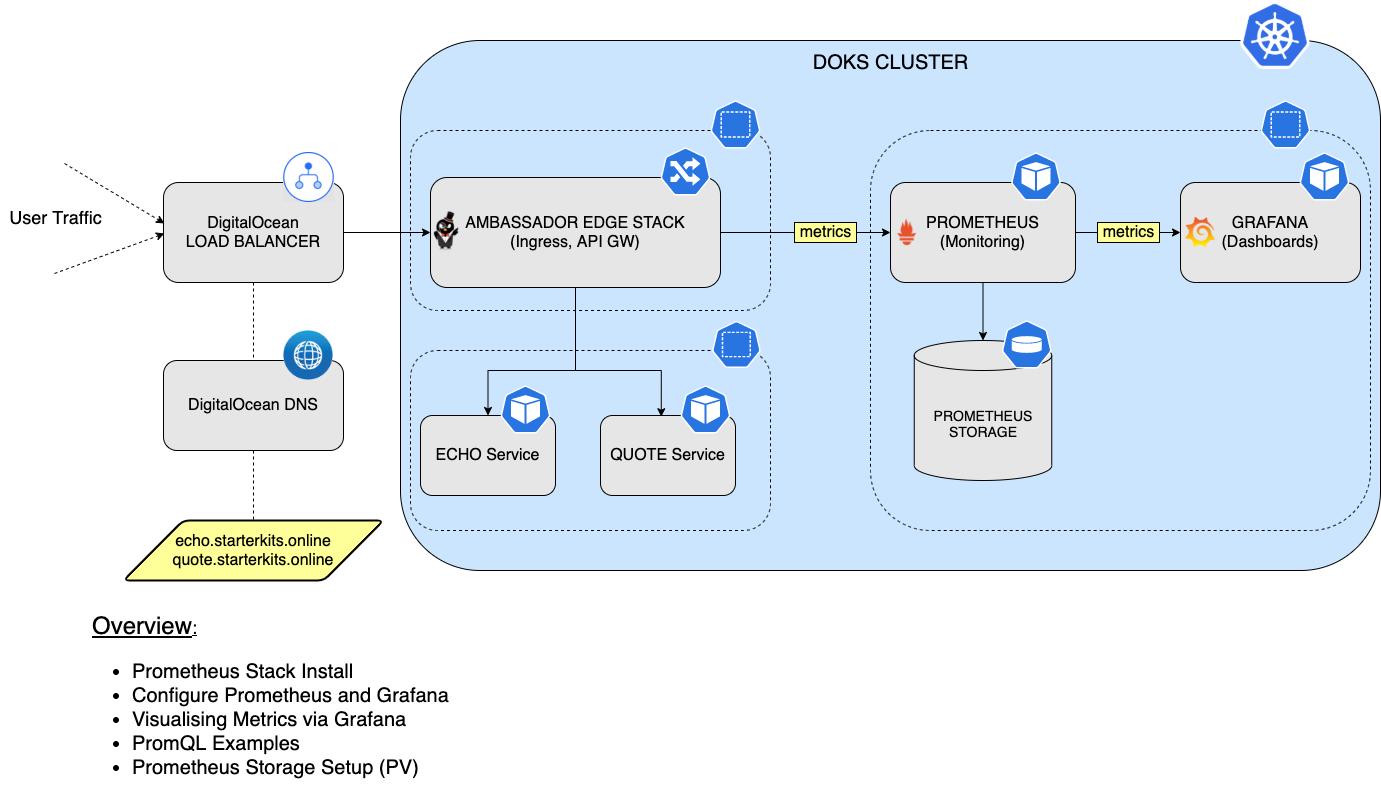
In this tutorial, you will learn how to install and configure the Prometheus stack, to monitor all pods from your DOKS cluster, as well as Kubernetes cluster state metrics. Then, you will connect Prometheus with Grafana to visualize all metrics and perform queries using the PromQL language. Finally, you will configure persistent storage for your Prometheus instance, to persist all your DOKS cluster and application metrics data.
Table of contents
- Prerequisites
- Step 1 - Installing the Prometheus Stack
- Step 2 - Configure Prometheus and Grafana
- Step 3 - PromQL (Prometheus Query Language)
- Step 4 - Visualizing Metrics Using Grafana
- Step 5 - Configuring Persistent Storage for Prometheus
- Step 6 - Configuring Persistent Storage for Grafana
- Conclusion
Prerequisites
To complete this tutorial, you will need:
- A Git client to clone the Starter Kit repository.
- Helm for managing Prometheus stack releases and upgrades.
- Kubectl for Kubernetes interaction.
- Curl for testing the examples (backend applications).
- Emojivoto Sample App deployed in the cluster. Please follow the steps in its repository README.
Please make sure that kubectl context is configured to point to your Kubernetes cluster. Refer to Step 3 - Creating the DOKS Cluster from the DOKS setup tutorial.
Step 1 - Installing the Prometheus Stack
In this step, you will install the kube-prometheus stack, which is an opinionated full monitoring stack for Kubernetes. It includes the Prometheus Operator, kube-state-metrics, pre-built manifests, Node Exporters, Metrics API, Alerts Manager, and Grafana.
You’re going to use the Helm package manager to accomplish this task. Helm chart is available here for study.
First, clone the Starter Kit repository and change the directory to your local copy.
Next, add the Helm repository and list the available charts:
helm repo add prometheus-community https://prometheus-community.github.io/helm-charts

helm repo update prometheus-community

helm search repo prometheus-community
The output looks similar to the following:
NAME                                                    CHART VERSION   APP VERSION     DESCRIPTION
prometheus-community/alertmanager                       0.18.1          v0.23.0         The Alertmanager handles alerts sent by client ...
prometheus-community/kube-prometheus-stack              35.5.1          0.56.3          kube-prometheus-stack collects Kubernetes manif...
...
The chart of interest is prometheus-community/kube-prometheus-stack which will install Prometheus, Promtail, Alertmanager, and Grafana on the cluster. Please visit the kube-prometheus-stack page for more details about this chart.
Then, open and inspect the 04-setup-observability/assets/manifests/prom-stack-values-v35.5.1.yaml file provided in the Starter Kit repository using an editor of your choice (preferably with YAML lint support). By default, kubeSched and etcd metrics are disabled - those components are managed by DOKS and are not accessible to Prometheus. Note that storage is set to emptyDir. It means the storage will be gone if Prometheus pods restart (you will fix this later in the Configuring Persistent Storage for Prometheus section).
[OPTIONAL] If you followed - Step 4 - Adding a dedicated node for observability of Setting up a DigitalOcean Managed Kubernetes Cluster guide, you will need to edit the 04-setup-observability/assets/manifests/prom-stack-values-v35.5.1.yaml file provided in the Starter Kit repository and uncomment the affinity sections for both Grafana and Prometheus.
prometheusSpec:
  affinity:
    nodeAffinity:
      preferredDuringSchedulingIgnoredDuringExecution:
        - weight: 1
          preference:
            matchExpressions:
              - key: preferred
                operator: In
                values:
                  - observability
grafana:
  enabled: true
  adminPassword: prom-operator
  affinity:
    nodeAffinity:
      preferredDuringSchedulingIgnoredDuringExecution:
        - weight: 1
          preference:
            matchExpressions:
              - key: preferred
                operator: In
                values:
                  - observability
Explanations for the above configuration:
preferredDuringSchedulingIgnoredDuringExecution- the scheduler tries to find a node that meets the rule. If a matching node is unavailable, the scheduler still schedules the Pod.preference.matchExpressions- selector used to match a specific node based on a criteria. The above example tells the scheduler to place workloads (e.g. Pods) on nodes labeled using key -preferredand value -observability.
Finally, install the kube-prometheus-stack, using Helm:
HELM_CHART_VERSION="35.5.1"

helm install kube-prom-stack prometheus-community/kube-prometheus-stack --version "${HELM_CHART_VERSION}" \
  --namespace monitoring \
  --create-namespace \
  -f "04-setup-observability/assets/manifests/prom-stack-values-v${HELM_CHART_VERSION}.yaml"
A specific version of the Helm chart is used. In this case 35.5.1 was picked, which maps to the 0.56.3 version of the application (see output from Step 2.). It’s a good practice to lock on a specific version. This helps to have predictable results and allows versioning control via Git.
Now, check the Prometheus stack Helm release status:
helm ls -n monitoring
The output looks similar to the following. Notice the STATUS column value - it should say deployed.
NAME            NAMESPACE       REVISION        UPDATED                                 STATUS          CHART                           APP VERSION
kube-prom-stack monitoring      1               2022-06-07 09:52:53.795003 +0300 EEST   deployed        kube-prometheus-stack-35.5.1    0.56.3
See what Kubernetes resources are available for Prometheus:
kubectl get all -n monitoring
You should have the following resources deployed: prometheus-node-exporter, kube-prome-operator, kube-prome-alertmanager, kube-prom-stack-grafana, and kube-state-metrics. The output looks similar to:
NAME                                                         READY   STATUS    RESTARTS   AGE
pod/alertmanager-kube-prom-stack-kube-prome-alertmanager-0   2/2     Running   0          3m3s
pod/kube-prom-stack-grafana-8457cd64c4-ct5wn                 2/2     Running   0          3m5s
pod/kube-prom-stack-kube-prome-operator-6f8b64b6f-7hkn7      1/1     Running   0          3m5s
pod/kube-prom-stack-kube-state-metrics-5f46fffbc8-mdgfs      1/1     Running   0          3m5s
pod/kube-prom-stack-prometheus-node-exporter-gcb8s           1/1     Running   0          3m5s
pod/kube-prom-stack-prometheus-node-exporter-kc5wz           1/1     Running   0          3m5s
pod/kube-prom-stack-prometheus-node-exporter-qn92d           1/1     Running   0          3m5s
pod/prometheus-kube-prom-stack-kube-prome-prometheus-0       2/2     Running   0          3m3s

NAME                                               TYPE        CLUSTER-IP       EXTERNAL-IP   PORT(S)                      AGE
service/alertmanager-operated                      ClusterIP   None             <none>        9093/TCP,9094/TCP,9094/UDP   3m3s
service/kube-prom-stack-grafana                    ClusterIP   10.245.147.83    <none>        80/TCP                       3m5s
service/kube-prom-stack-kube-prome-alertmanager    ClusterIP   10.245.187.117   <none>        9093/TCP                     3m5s
service/kube-prom-stack-kube-prome-operator        ClusterIP   10.245.79.95     <none>        443/TCP                      3m5s
service/kube-prom-stack-kube-prome-prometheus      ClusterIP   10.245.86.189    <none>        9090/TCP                     3m5s
service/kube-prom-stack-kube-state-metrics         ClusterIP   10.245.119.83    <none>        8080/TCP                     3m5s
service/kube-prom-stack-prometheus-node-exporter   ClusterIP   10.245.47.175    <none>        9100/TCP                     3m5s
service/prometheus-operated                        ClusterIP   None             <none>        9090/TCP                     3m3s

NAME                                                      DESIRED   CURRENT   READY   UP-TO-DATE   AVAILABLE   NODE SELECTOR   AGE
daemonset.apps/kube-prom-stack-prometheus-node-exporter   3         3         3       3            3           <none>          3m5s

NAME                                                  READY   UP-TO-DATE   AVAILABLE   AGE
deployment.apps/kube-prom-stack-grafana               1/1     1            1           3m5s
deployment.apps/kube-prom-stack-kube-prome-operator   1/1     1            1           3m5s
deployment.apps/kube-prom-stack-kube-state-metrics    1/1     1            1           3m5s

NAME                                                            DESIRED   CURRENT   READY   AGE
replicaset.apps/kube-prom-stack-grafana-8457cd64c4              1         1         1       3m5s
replicaset.apps/kube-prom-stack-kube-prome-operator-6f8b64b6f   1         1         1       3m5s
replicaset.apps/kube-prom-stack-kube-state-metrics-5f46fffbc8   1         1         1       3m5s

NAME                                                                    READY   AGE
statefulset.apps/alertmanager-kube-prom-stack-kube-prome-alertmanager   1/1     3m3s
statefulset.apps/prometheus-kube-prom-stack-kube-prome-prometheus       1/1     3m3s
Then, you can connect to Grafana (using default credentials: admin/prom-operator - see prom-stack-values-v35.5.1 file), by port forwarding to the local machine:
kubectl --namespace monitoring port-forward svc/kube-prom-stack-grafana 3000:80
You should NOT expose Grafana to public network (eg. create an ingress mapping or LB service) with default login/password.
Grafana installation comes with several dashboards. Open a web browser on localhost:3000. Once in, you can go to Dashboards -> Browse, and choose different dashboards.
In the next part, you will discover how to set up Prometheus to discover targets for monitoring. As an example, the Emojivoto sample application will be used. You’ll learn what a ServiceMonitor is as well.
Step 2 - Configure Prometheus and Grafana
You already deployed Prometheus and Grafana into the cluster. In this step, you will learn how to use a ServiceMonitor. A ServiceMonitor is one of the preferred ways to tell Prometheus how to discover a new target for monitoring.
The Emojivoto Deployment created in Step 5 of the Prerequisites section provides the /metrics endpoint by default on port 8801 via a Kubernetes service.
Next, you will discover the Emojivoto services responsible for exposing metrics data for Prometheus to consume. The services in question are called emoji-svc and voting-svc (note that it’s using the emojivoto namespace):
kubectl get svc -n emojivoto
The output looks similar to the following:
NAME         TYPE        CLUSTER-IP       EXTERNAL-IP   PORT(S)             AGE
emoji-svc    ClusterIP   10.245.135.93    <none>        8080/TCP,8801/TCP   22h
voting-svc   ClusterIP   10.245.164.222   <none>        8080/TCP,8801/TCP   22h
web-svc      ClusterIP   10.245.61.229    <none>        80/TCP              22h
Next, perform a port-forward to inspect the metrics:
kubectl port-forward svc/emoji-svc 8801:8801 -n emojivoto
The exposed metrics can be visualized by navigating with a web browser to localhost or via curl:
curl -s http://localhost:8801/metrics
The output looks similar to the following:
# TYPE go_gc_duration_seconds summary
go_gc_duration_seconds{quantile="0"} 5.317e-05
go_gc_duration_seconds{quantile="0.25"} 0.000105305
go_gc_duration_seconds{quantile="0.5"} 0.000138168
go_gc_duration_seconds{quantile="0.75"} 0.000225651
go_gc_duration_seconds{quantile="1"} 0.016986437
go_gc_duration_seconds_sum 0.607979843
go_gc_duration_seconds_count 2097
To inspect the metrics for the voting-svc service, stop the emoji-svc port forward and perform the same steps for the second service.
Next, connect Prometheus to the Emojivoto metrics service. There are several ways of doing this:
- <static_config> - allows specifying a list of targets and a common label set for them.
- <kubernetes_sd_config> - allows retrieving scrape targets from Kubernetes’ REST API and always staying synchronized with the cluster state.
- Prometheus Operator - simplifies Prometheus monitoring inside a Kubernetes cluster via CRDs.
Next, you will make use of the ServiceMonitor CRD exposed by the Prometheus Operator to define a new target for monitoring.
First, change the directory (if not already) where the Starter Kit Git repository was cloned:
cd Kubernetes-Starter-Kit-Developers
Next, open the 04-setup-observability/assets/manifests/prom-stack-values-v35.5.1.yaml file provided in the Starter Kit repository using a text editor of your choice (preferably with YAML lint support). Please remove the comments surrounding the additionalServiceMonitors section. The output looks similar to:
additionalServiceMonitors:
  - name: emojivoto-monitor
    selector:
      matchExpressions:
        - key: app
          operator: In
          values:
            - emoji-svc
            - voting-svc
    namespaceSelector:
      matchNames:
        - emojivoto
    endpoints:
      - port: prom
Explanations for the above configuration:
selector -> matchExpressions- tellsServiceMonitorwhich service to monitor. It will target all services with the label key app and the valuesemoji-svcandvoting-svc. The labels can be fetched by running:kubectl get svc --show-labels -n emojivotonamespaceSelector- here, you want to match the namespace whereEmojivotowas deployed.endpoints -> port- references the port of the service to monitor.
Finally, apply changes using Helm:
HELM_CHART_VERSION="35.5.1"

helm upgrade kube-prom-stack prometheus-community/kube-prometheus-stack --version "${HELM_CHART_VERSION}" \
  --namespace monitoring \
  -f "04-setup-observability/assets/manifests/prom-stack-values-v${HELM_CHART_VERSION}.yaml"
Next, please check if the Emojivoto target is added to Prometheus for scraping. Create a port forward for Prometheus on port 9090:
kubectl port-forward svc/kube-prom-stack-kube-prome-prometheus 9090:9090 -n monitoring
Open a web browser on localhost:9090. Then, navigate to Status -> Targets page, and inspect the results (notice the serviceMonitor/monitoring/emojivoto-monitor/0 path):
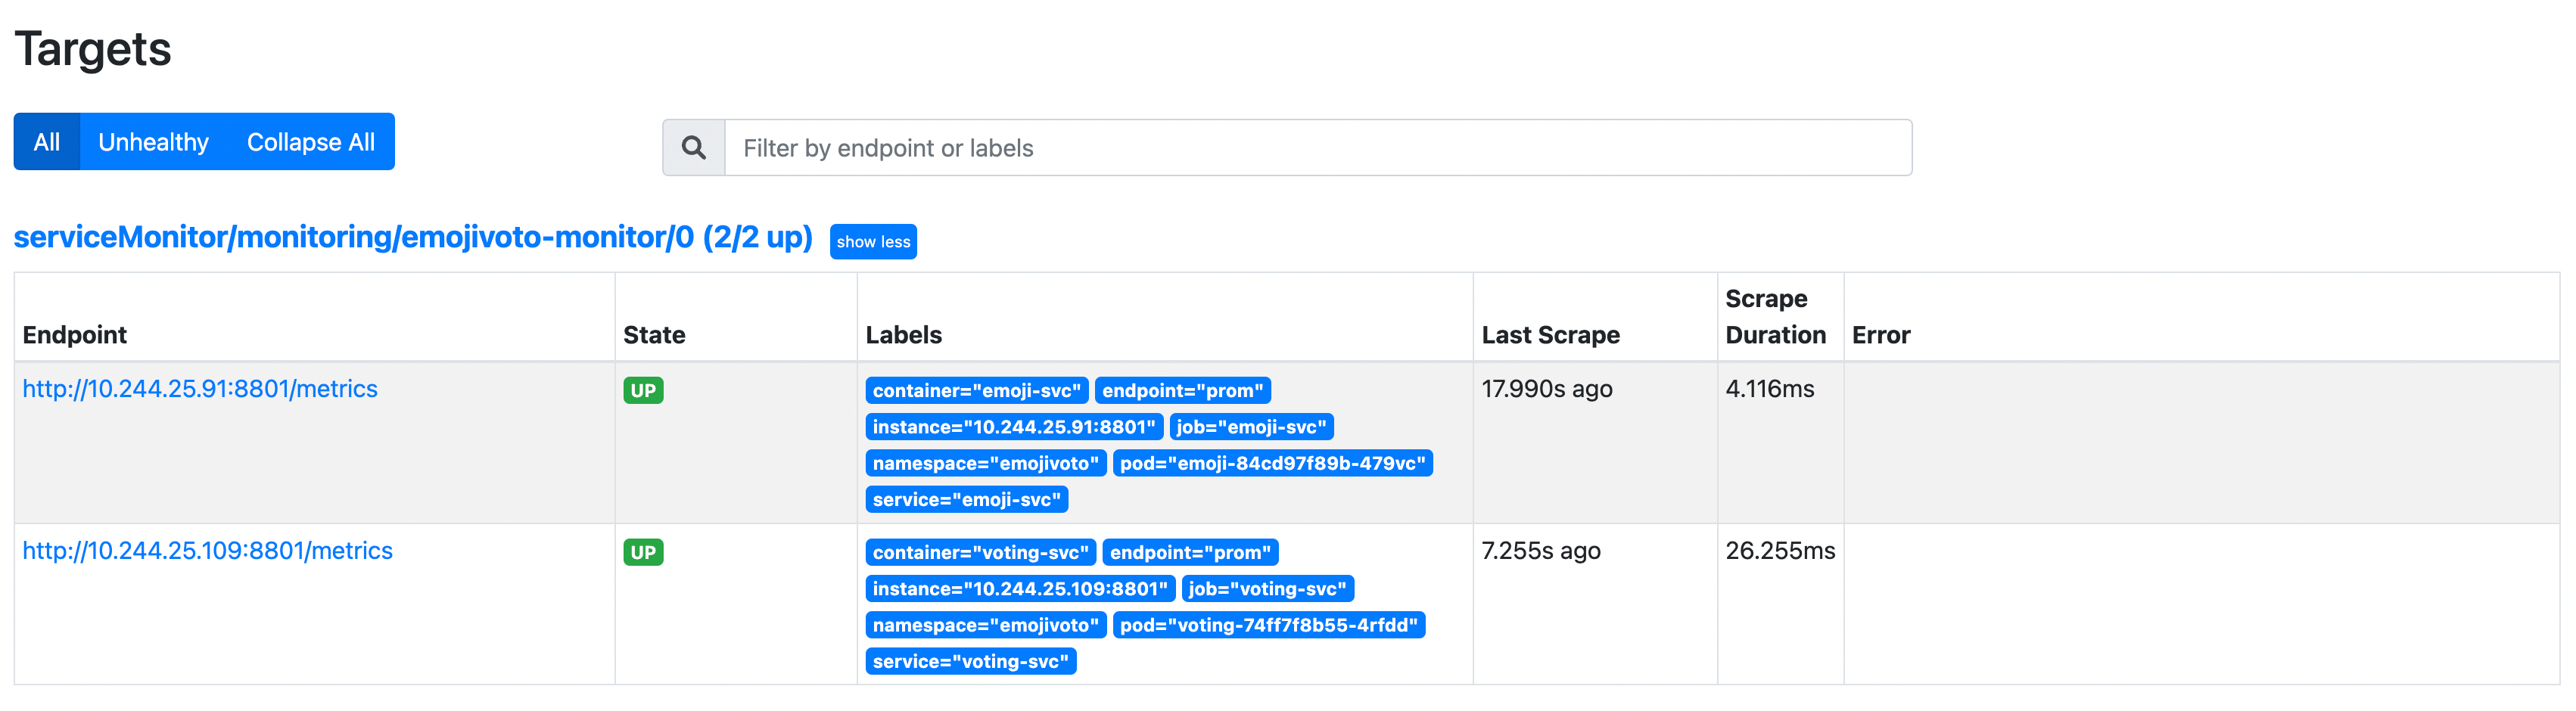
There are 2 entries under the discovered targets because the Emojivoto deployment consists of 2 services exposing the metrics endpoint.
In the next step, you’ll discover PromQL along with some simple examples, to get you started, and discover the language.
Step 3 - PromQL (Prometheus Query Language)
In this step, you will learn the basics of Prometheus Query Language (PromQL). PromQL helps you perform queries on various metrics coming from all Pods and applications from your DOKS cluster.
PromQL is a DSL or Domain Specific Language that is specifically built for Prometheus and allows you to query for metrics. The overall expression defines the final value, while nested expressions represent values for arguments and operands. For more in-depth explanations, please visit the official PromQL page.
Next, you’re going to inspect one of the Emojivoto metrics, namely the emojivoto_votes_total, which represents the total number of votes. It’s a counter value that increases with each request against the Emojivoto votes endpoint.
First, create a port forward for Prometheus on port 9090:
kubectl port-forward svc/kube-prom-stack-kube-prome-prometheus 9090:9090 -n monitoring
Next, open the expression browser.
In the query input field paste emojivoto_votes_total, and hit enter. The output looks similar to:
emojivoto_votes_total{container="voting-svc", emoji=":100:", endpoint="prom", instance="10.244.25.31:8801", job="voting-svc", namespace="emojivoto", pod="voting-74ff7f8b55-jl6qs", service="voting-svc"} 20
emojivoto_votes_total{container="voting-svc", emoji=":bacon:", endpoint="prom", instance="10.244.25.31:8801", job="voting-svc", namespace="emojivoto", pod="voting-74ff7f8b55-jl6qs", service="voting-svc"} 17
emojivoto_votes_total{container="voting-svc", emoji=":balloon:", endpoint="prom", instance="10.244.25.31:8801", job="voting-svc", namespace="emojivoto", pod="voting-74ff7f8b55-jl6qs", service="voting-svc"} 21
emojivoto_votes_total{container="voting-svc", emoji=":basketball_man:", endpoint="prom", instance="10.244.25.31:8801", job="voting-svc", namespace="emojivoto", pod="voting-74ff7f8b55-jl6qs", service="voting-svc"} 10
emojivoto_votes_total{container="voting-svc", emoji=":beach_umbrella:", endpoint="prom", instance="10.244.25.31:8801", job="voting-svc", namespace="emojivoto", pod="voting-74ff7f8b55-jl6qs", service="voting-svc"} 10
emojivoto_votes_total{container="voting-svc", emoji=":beer:", endpoint="prom", instance="10.244.25.31:8801", job="voting-svc", namespace="emojivoto", pod="voting-74ff7f8b55-jl6qs", service="voting-svc"} 11
Navigate to the Emojivoto application and from the homepage click on the 100 emoji to vote for it.
Navigate to the query results page from Step 3 and click on the Execute button. You should see the counter for the 100 emoji increase by one. The output looks similar to:
emojivoto_votes_total{container="voting-svc", emoji=":100:", endpoint="prom", instance="10.244.25.31:8801", job="voting-svc", namespace="emojivoto", pod="voting-74ff7f8b55-jl6qs", service="voting-svc"} 21
emojivoto_votes_total{container="voting-svc", emoji=":bacon:", endpoint="prom", instance="10.244.25.31:8801", job="voting-svc", namespace="emojivoto", pod="voting-74ff7f8b55-jl6qs", service="voting-svc"} 17
emojivoto_votes_total{container="voting-svc", emoji=":balloon:", endpoint="prom", instance="10.244.25.31:8801", job="voting-svc", namespace="emojivoto", pod="voting-74ff7f8b55-jl6qs", service="voting-svc"} 21
emojivoto_votes_total{container="voting-svc", emoji=":basketball_man:", endpoint="prom", instance="10.244.25.31:8801", job="voting-svc", namespace="emojivoto", pod="voting-74ff7f8b55-jl6qs", service="voting-svc"} 10
emojivoto_votes_total{container="voting-svc", emoji=":beach_umbrella:", endpoint="prom", instance="10.244.25.31:8801", job="voting-svc", namespace="emojivoto", pod="voting-74ff7f8b55-jl6qs", service="voting-svc"} 10
emojivoto_votes_total{container="voting-svc", emoji=":beer:", endpoint="prom", instance="10.244.25.31:8801", job="voting-svc", namespace="emojivoto", pod="voting-74ff7f8b55-jl6qs", service="voting-svc"} 11
PromQL groups similar data in what’s called a vector. As seen above, each vector has a set of attributes that differentiate it from one another. You can group results based on an attribute of interest. For example, if you care only about requests that come from the voting-svc service, then please type the following in the query field:
emojivoto_votes_total{service="voting-svc"}
The output looks similar to (note that it selects only the results that match your criteria):
emojivoto_votes_total{container="voting-svc", emoji=":100:", endpoint="prom", instance="10.244.6.91:8801", job="voting-svc", namespace="emojivoto", pod="voting-6548959dd7-hssh2", service="voting-svc"} 492
emojivoto_votes_total{container="voting-svc", emoji=":bacon:", endpoint="prom", instance="10.244.6.91:8801", job="voting-svc", namespace="emojivoto", pod="voting-6548959dd7-hssh2", service="voting-svc"} 532
emojivoto_votes_total{container="voting-svc", emoji=":balloon:", endpoint="prom", instance="10.244.6.91:8801", job="voting-svc", namespace="emojivoto", pod="voting-6548959dd7-hssh2", service="voting-svc"} 521
The above result shows the total requests for each Pod from the Emojivoto deployment which emits metrics (which consists of 2).
This is just a very simple introduction to what PromQL is and what it’s capable of. But it can do much more than that, like counting metrics, computing the rate over a predefined interval, etc. Please visit the official PromQL page for more features of the language.
In the next step, you will learn how to use Grafana to visualize metrics for the Emojivoto sample application.
Step 4 - Visualizing Metrics Using Grafana
Although Prometheus has some built-in support for visualizing data, a better way of doing it is via Grafana which is an open-source platform for monitoring and observability, that lets you visualize and explore the state of your cluster.
The official page is described as being able to:
Query, visualize, alert on, and understand your data no matter where it’s stored.
No extra steps are needed to install Grafana because Step 1 - Installing the Prometheus Stack installed Grafana for you. All you have to do is a port forward like below, and get immediate access to the dashboards (default credentials: admin/prom-monitor):
kubectl --namespace monitoring port-forward svc/kube-prom-stack-grafana 3000:80
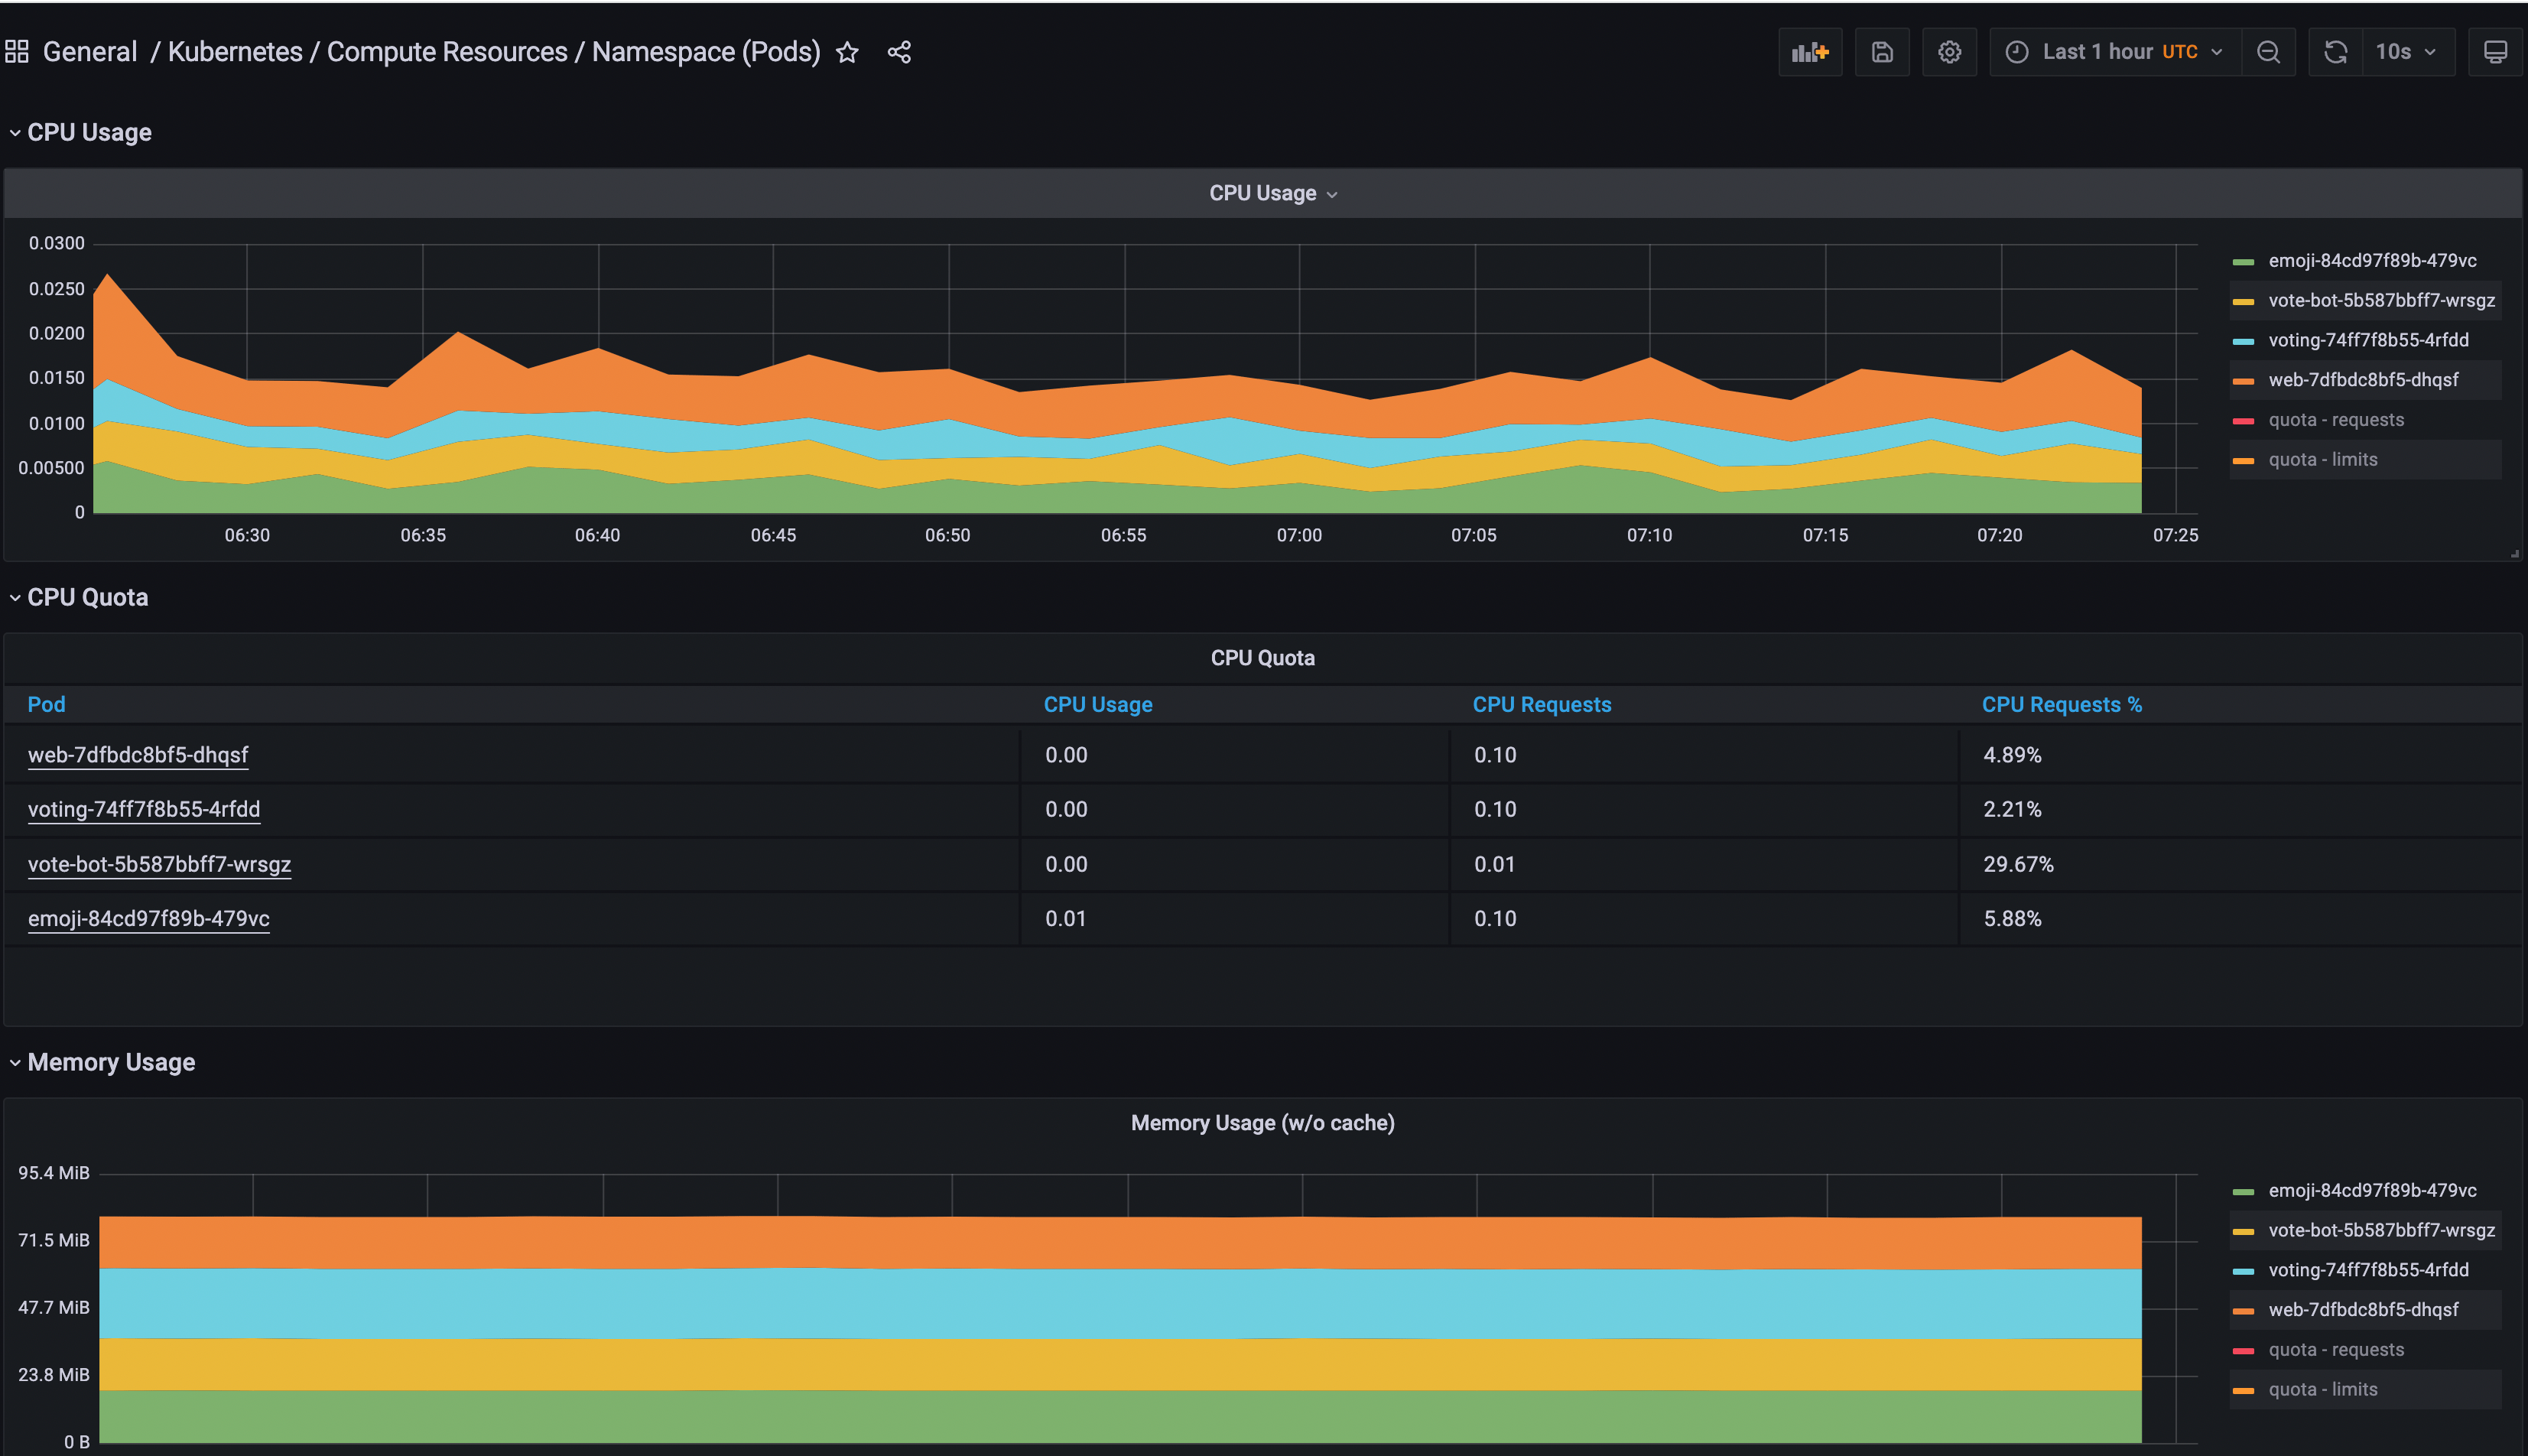
To see all the Emojivoto metrics, you’re going to use one of the default installed dashboards from Grafana.
Navigate to the Grafana Dashboards section.
Next, search for the General/Kubernetes/Compute Resources/Namespace(Pods) dashboard and access it.
Finally, select the Prometheus data source and add the emojivoto namespace.
You can play around and add more panels in Grafana for visualizing other data sources, as well as group them based on scope. Also, you can explore the available dashboards for Kubernetes from the Grafana kube-mixin project.
In the next step, you will configure persistent storage for Prometheus using DigitalOcean block storage to persist your DOKS and application metrics across server restarts or cluster failures.
Step 5 - Configuring Persistent Storage for Prometheus
In this step, you will learn how to enable persistent storage for Prometheus so that metrics data is persisted across server restarts, or in case of cluster failures.
First, you need a storage class to proceed. Run the following command to check which is available.
kubectl get storageclass
The output should look similar to the following. Notice that DigitalOcean Block Storage is available for you to use.
NAME                         PROVISIONER                 RECLAIMPOLICY   VOLUMEBINDINGMODE   ALLOWVOLUMEEXPANSION   AGE
do-block-storage (default)   dobs.csi.digitalocean.com   Delete          Immediate           true                   4d2h
Next, change the directory (if not already) where the Starter Kit Git repository was cloned:
cd Kubernetes-Starter-Kit-Developers
Then, open the 04-setup-observability/assets/manifests/prom-stack-values-v35.5.1.yaml file provided in the Starter Kit repository using a text editor of your choice (preferably with YAML lint support). Search for the storageSpec line, and uncomment the required section for Prometheus. The storageSpec definition should look like:
prometheusSpec:
  storageSpec:
    volumeClaimTemplate:
      spec:
        storageClassName: do-block-storage
        accessModes:
          - ReadWriteOnce
        resources:
          requests:
            storage: 5Gi
Explanations for the above configuration:
volumeClaimTemplate- defines a new PVC.storageClassName- defines the storage class (should use the same value as from thekubectl get storageclasscommand output).resources- sets the storage requests value. In this case, a total capacity of 5 Gi is requested for the new volume.
Finally, apply settings using Helm:
HELM_CHART_VERSION="35.5.1"

helm upgrade kube-prom-stack prometheus-community/kube-prometheus-stack --version "${HELM_CHART_VERSION}" \
  --namespace monitoring \
  -f "04-setup-observability/assets/manifests/prom-stack-values-v${HELM_CHART_VERSION}.yaml"
After completing the above steps, check the PVC status:
kubectl get pvc -n monitoring
The output looks similar to the following. STATUS column should display Bound.
NAME STATUS VOLUME CAPACITY ACCESS MODES AGE
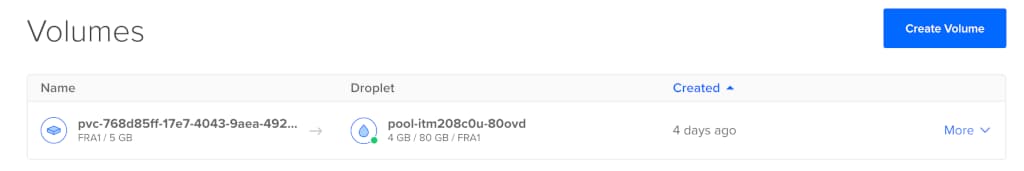
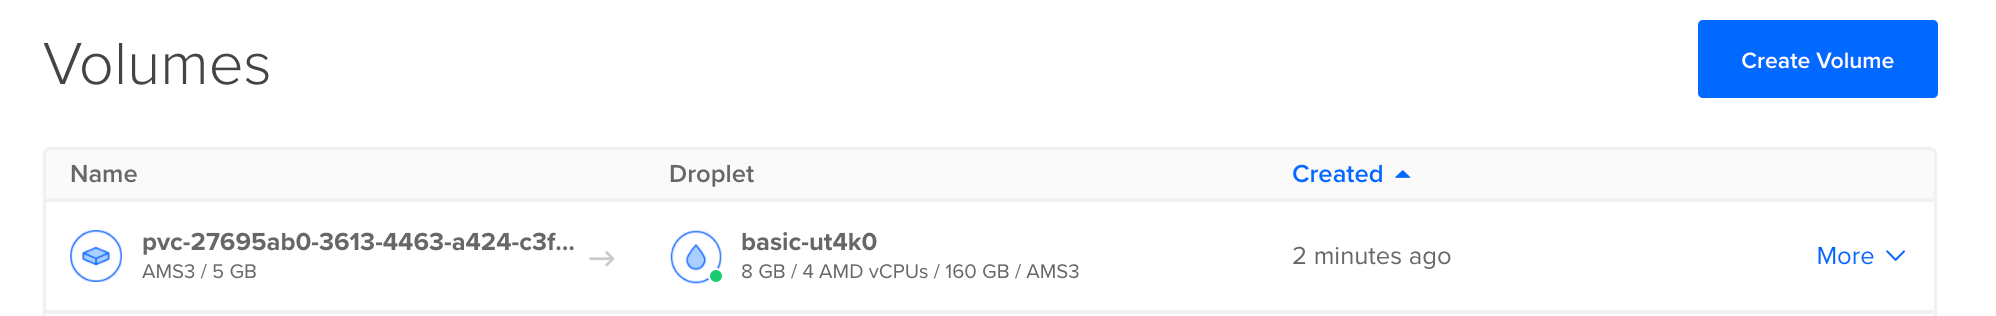
kube-prome-prometheus-0 Bound pvc-768d85ff-17e7-4043-9aea-4929df6a35f4 5Gi RWO do-block-storage 4d2h
A new Volume should appear in the Volumes web page from your DigitalOcean account panel:
Step 6 - Configuring Persistent Storage for Grafana
In this step, you will learn how to enable persistent storage for Grafana so that the graphs are persisted across server restarts, or in case of cluster failures. You will define a 5 Gi Persistent Volume Claim (PVC), using the DigitalOcean Block Storage. The next steps are the same as Step 5 - Configuring Persistent Storage for Prometheus.
First, open the 04-setup-observability/assets/manifests/prom-stack-values-v35.5.1.yaml file provided in the Starter Kit repository, using a text editor of your choice (preferably with YAML lint support). The persistence storage section for Grafana should look like:
grafana:
  ...
  persistence:
    enabled: true
    storageClassName: do-block-storage
    accessModes: ["ReadWriteOnce"]
    size: 5Gi
Next, apply settings using Helm:
HELM_CHART_VERSION="35.5.1"

helm upgrade kube-prom-stack prometheus-community/kube-prometheus-stack --version "${HELM_CHART_VERSION}" \
--namespace monitoring \
-f "04-setup-observability/assets/manifests/prom-stack-values-v${HELM_CHART_VERSION}.yaml"
After completing the above steps, check the PVC status:
kubectl get pvc -n monitoring
The output looks similar to the following. STATUS column should display Bound.
NAME                      STATUS   VOLUME                                     CAPACITY   ACCESS         MODES              AGE
kube-prom-stack-grafana   Bound    pvc-768d85ff-17e7-4043-9aea-4929df6a35f4   5Gi        RWO            do-block-storage   4d2h
A new Volume should appear in the Volumes web page from your DigitalOcean account panel:
Best Practices for PV Sizing
To compute the size needed for the volume based on your needs, please follow the official documentation advice and formula:
-
Prometheus stores an average of only 1-2 bytes per sample. Thus, to plan the capacity of a Prometheus server, you can use the rough formula:
needed_disk_space = retention_time_seconds * ingested_samples_per_second * bytes_per_sample -
To lower the rate of ingested samples, you can either reduce the number of time series you scrape (fewer targets or fewer series per target), or you can increase the scrape interval. However, reducing the number of series is likely more effective, due to compression of samples within a series.
Please follow the Operational Aspects section for more details on the subject.
Conclusion
In this tutorial, you learned how to install and configure the Prometheus stack, then used Grafana to install new dashboards and visualize DOKS cluster application metrics. You also learned how to perform metric queries using PromQL. Finally, you configured and enabled persistent storage for Prometheus to store your cluster metrics.
Learn More
- Kubernetes Log Monitoring and Retention using Grafana Loki and DigitalOcean Spaces
- Best Practices in Monitoring a Kubernetes Cluster With Prometheus, Grafana and Loki
- Set Up DOKS Cluster Monitoring with Helm and Prometheus Operator
Next, you will learn about the application logs collection and aggregation via Loki.
Thanks for learning with the DigitalOcean Community. Check out our offerings for compute, storage, networking, and managed databases.
About the author(s)
Still looking for an answer?
This textbox defaults to using Markdown to format your answer.
You can type !ref in this text area to quickly search our full set of tutorials, documentation & marketplace offerings and insert the link!
 This work is licensed under a Creative Commons Attribution-NonCommercial- ShareAlike 4.0 International License.
Become a contributor for community
Get paid to write technical tutorials and select a tech-focused charity to receive a matching donation.

DigitalOcean Documentation
Full documentation for every DigitalOcean product.

Resources for startups and AI-native businesses
The Wave has everything you need to know about building a business, from raising funding to marketing your product.
The developer cloud
Scale up as you grow — whether you're running one virtual machine or ten thousand.

Start building today
From GPU-powered inference and Kubernetes to managed databases and storage, get everything you need to build, scale, and deploy intelligent applications.
