By Savic and Anish Singh Walia

Introduction
Apache Kafka supports various security protocols and authentication workflows to ensure that only authorized personnel and applications can connect to the cluster. In its default configuration, Kafka allows everyone access but has no security checks enabled. While that is useful for exploring and developing, production deployments must be properly secured before exposure to the outside world. Also, such environments must be monitored to ensure smooth operation and prevent possible failures.
In this tutorial, you’ll harden your Kafka installation by configuring TLS traffic encryption and SASL authentication to provide a standard username and password login flow. You’ll see how to configure the provided producer and consumer scripts to connect to a secured cluster. Then, you’ll learn how to export Kafka metrics and visualize them in Grafana. You’ll also learn how to access your cluster’s nodes and topics through an easy-to-use, web-based interface provided by AKHQ.
Prerequisites
To complete this tutorial, you’ll need:
- A Droplet with at least 4GB RAM and 2 CPUs. In the case of an Ubuntu server, follow the Initial Server Setup for setup instructions.
- Apache Kafka is installed and configured on your droplet. For setup instructions, follow the Introduction to Kafka tutorial. You must only complete Step 1 and Step 2.
- An understanding of how Java handles keys and certificates. For more information, visit the Java Keytool Essentials: Working with Java Keystores tutorial.
- Grafana installed on your server or local machine. Please visit the How To Install and Secure Grafana on Ubuntu tutorial for instructions. You only need to complete the first four steps.
- A fully registered domain name is pointed to your droplet. This tutorial will use
your_domainthroughout and will refer to the same domain name as the Grafana prerequisite. You can purchase a domain name on Namecheap, get one for free on Freenom, or use the domain registrar of your choice.
Step 1 - Configuring Kafka Security Protocols
In its stock configuration, Kafka allows everyone to connect to it without checking the request’s origin. This means that your cluster is accessible to everyone by default. While fine for testing, as it reduces the maintenance burden on local machines and private installations, production and public-facing Kafka installations must have security features enabled to prevent unauthorized access.
In this step, you’ll configure your Kafka broker to use TLS encryption for traffic between the broker and consumers. You’ll also set up SASL as the authentication framework for verifying credentials when connecting to the cluster.
Generating TLS Certificate and Stores
To generate the certificates and keys required for setting up TLS, you’ll use the script from the Confluent Platform Security Tools repository. First, clone it to your home directory by running the following command:
git clone https://github.com/confluentinc/confluent-platform-security-tools.git ~/kafka-ssl
Navigate to it:
cd ~/kafka-ssl
The script you’ll use is called kafka-generate-ssl-automatic.sh, and it requires you to provide your country, state, organization, and city as environment variables. These parameters are used to create the certificates, but their contents are unimportant. You’ll also need to provide a password, which is used to secure the Java trust and key store that will be generated.
Run the following commands to set up the required environment variables, replacing your_tls_password with your desired value:
export COUNTRY=US
export STATE=NY
export ORGANIZATION_UNIT=SE
export CITY=New York
export PASSWORD=your_tls_password
Note that the PASSWORD must be at least six characters long.
Give the script executable permissions by running:
chmod +x kafka-generate-ssl-automatic.sh
Then, execute it to generate the required files:
./kafka-generate-ssl-automatic.sh
There will be a lot of output. When it’s complete, list the files in the directory:
ls -l
The output should look similar to this:
Outputrw-rw-r-- 1 kafka kafka    964 May 13 09:33 README.md
-rw-rw-r-- 1 kafka kafka   1063 May 13 09:34 cert-file
-rw-rw-r-- 1 kafka kafka   1159 May 13 09:34 cert-signed
-rwxrw-r-- 1 kafka kafka   6016 May 13 09:33 kafka-generate-ssl-automatic.sh
-rwxrwxr-x 1 kafka kafka   7382 May 13 09:33 kafka-generate-ssl.sh
drwxrwxr-x 2 kafka kafka   4096 May 13 09:34 keystore
-rw-rw-r-- 1 kafka kafka 184929 May 13 09:33 single-trust-store-diagram.pages
-rw-rw-r-- 1 kafka kafka  36980 May 13 09:33 single-trust-store-diagram.pdf
drwxrwxr-x 2 kafka kafka   4096 May 13 09:34 truststore
You’ll see that the certificate, trust, and key store have been successfully created.
Configuring Kafka for TLS and SASL
Now that you have the necessary files to enable TLS encryption, you’ll configure Kafka to use them and authenticate users using SASL.
You’ll modify the server.properties file under config/kraft in the installation directory. You’ve installed it under kafka in your home directory as part of the prerequisites. Navigate to it by running:
cd ~/kafka
Open the main configuration file for editing:
nano config/kraft/server.properties
Find the following lines:
...
listeners=PLAINTEXT://:9092,CONTROLLER://:9093

# Name of listener used for communication between brokers.
inter.broker.listener.name=PLAINTEXT

# Listener name, hostname and port the broker will advertise to clients.
# If not set, it uses the value for "listeners".
advertised.listeners=PLAINTEXT://localhost:9092
Modify them to look like this, replacing PLAINTEXT with BROKER:
...
listeners=BROKER://:9092,CONTROLLER://:9093

# Name of listener used for communication between brokers.
inter.broker.listener.name=BROKER

# Listener name, hostname and port the broker will advertise to clients.
# If not set, it uses the value for "listeners".
advertised.listeners=BROKER://localhost:9092
Then, find the listener.security.protocol.map line:
# Maps listener names to security protocols, the default is for them to be the same. See the config documentation for more details
listener.security.protocol.map=CONTROLLER:PLAINTEXT,PLAINTEXT:PLAINTEXT,SSL:SSL,SASL_PLAINTEXT:SASL_PLAINTEXT,SASL_SSL:SASL_SSL
Map BROKER to SASL_SSL by prepending the definition to the value:
# Maps listener names to security protocols, the default is for them to be the same. See the config documentation for more details
listener.security.protocol.map=BROKER:SASL_SSL,CONTROLLER:PLAINTEXT,PLAINTEXT:PLAINTEXT,SSL:SSL,SASL_PLAINTEXT:SASL_PLAINTEXT,SASL_SSL:SASL_SSL
Here, you’ve added the definition for the BROKER alias you’ve used in the listeners and mapped it to SASL_SSL, which signifies that both SSL (an earlier name for TLS) and SASL are to be used.
Next, navigate to the end of the file and add the following lines:
ssl.truststore.location=/home/kafka/kafka-ssl/truststore/kafka.truststore.jks
ssl.truststore.password=your_tls_password
ssl.keystore.location=/home/kafka/kafka-ssl/keystore/kafka.keystore.jks
ssl.keystore.password=your_tls_password
ssl.key.password=your_tls_password
ssl.client.auth=required

sasl.enabled.mechanisms=PLAIN
sasl.mechanism.controller.protocol=PLAIN
sasl.mechanism.inter.broker.protocol=PLAIN

authorizer.class.name=org.apache.kafka.metadata.authorizer.StandardAuthorizer
allow.everyone.if.no.acl.found=false
super.users=User:admin
You first define the locations and passwords for the generated trust and key stores. You set the ssl.client.auth parameter to required, instructing Kafka to disallow any connections that do not present a valid TLS certificate. Then, you set the SASL mechanism to PLAIN, which enables it. PLAIN is different from PLAINTEXT in that it requires the use of an encrypted connection, and both rely on a username and password credential combination.
Finally, you set the StandardAuthorizer as the authorizer class, which checks the credentials against a configuration file that you’ll soon create. Then, you set the allow.everyone.if.no.acl.found parameter to false, restricting access for connections with inappropriate credentials. You also denote the admin user as the superuser, because there has to be at least one for performing administrative tasks in the cluster.
Remember to replace your_tls_password with the password you’ve passed in to the script in the previous section, then save and close the file.
Now that you’ve configured Kafka, you’ll need to create a file that defines allowed credentials for connecting. Kafka supports the Java Authentication and Authorization Service (JAAS), a framework for implementing authentication workflows, and accepts credential definitions in the JAAS format.
You’ll store them in a file named kafka-server-jaas.conf under config/kraft. Create and open it for editing by running:
nano config/kraft/kafka-server-jaas.conf
Add the following lines:
KafkaServer {
 org.apache.kafka.common.security.plain.PlainLoginModule required
 username="admin"
 password="admin"
 user_admin="admin";
};
The username and password define the main credentials which are used for inter-broker communication in the cluster when multiple nodes are present. The user_admin line defines a user whose username is admin with password admin, which can connect to the broker from the outside. Save and close the file when you’re done.
Kafka needs to be aware of the kafka-server-jaas.conf file because it complements the main configuration. You’ll need to modify the kafka systemd service configuration and pass in a reference to it. Run the following command to open the service for editing:
sudo systemctl edit --full kafka
By passing in --full, you get access to the complete contents of the service. Find the ExecStart line:
...
User=kafka
ExecStart=/bin/sh -c '/home/kafka/kafka/bin/kafka-server-start.sh /home/kafka/kafka/config/kraft/server.properties > /home/kafka/kafka/kafka.log 2>&1'
...
Add the following line above it, so that it looks like this:
...
User=kafka
Environment="KAFKA_OPTS=-Djava.security.auth.login.config=/home/kafka/kafka/config/kraft/kafka-server-jaas.conf"
ExecStart=/bin/sh -c '/home/kafka/kafka/bin/kafka-server-start.sh /home/kafka/kafka/config/kraft/server.properties > /home/kafka/kafka/kafka.log 2>&1'
...
With this, you set the java.security.auth.login.config parameter in the config to the path of the JAAS config file, decoupling it from the main Kafka config. When you’re done, save and close the file. Reload the service definition by running:
sudo systemctl daemon-reload
Then, restart Kafka:
sudo systemctl restart kafka
You’ve now configured both TLS encryption and SASL authentication for your Kafka installation, and you’ll now learn how to connect to it with the provided console scripts.
Step 2 - Connecting To a Secured Cluster
In this step, you’ll learn how to connect to a secured Kafka cluster using JAAS config files with the provided console scripts.
The provided scripts for manipulating topics producing and consuming messages also use Java internally, and thus accept a JAAS configuration detailing the trust and key store locations, as well as SASL credentials.
You’ll store that configuration in a file named client-jaas.conf in your home directory. Create and open it for editing:
nano ~/client-jaas.conf
Add the following lines:
security.protocol=SASL_SSL
ssl.truststore.location=/home/kafka/kafka-ssl/truststore/kafka.truststore.jks
ssl.truststore.password=your_tls_password
ssl.keystore.location=/home/kafka/kafka-ssl/keystore/kafka.keystore.jks
ssl.keystore.password=your_tls_password

sasl.mechanism=PLAIN
sasl.jaas.config=org.apache.kafka.common.security.plain.PlainLoginModule required username="admin" password="admin";
ssl.endpoint.identification.algorithm=
Similarly to before, you set the protocol to be SASL_SSL and provide the paths and password for the key and trust stores you’ve created. Then, you set the SASL mechanism to PLAIN and provide the credentials for user admin. You explicitly clear the ssl.endpoint.identification.algorithm parameter to prevent connection issues, as the initial scripts sets the hostname of the machine it’s run on as the certificate endpoint, which may not be correct.
Replace your_tls_password with the proper value, then save and close the file.
To pass in this file to the scripts, you can use the --command-config parameter. Try creating a new topic in the cluster with the following command:
bin/kafka-topics.sh --bootstrap-server localhost:9092 --create --topic new_topic --command-config ~/client-jaas.conf
The command should execute successfully:
Output...
Created topic new_topic.
To verify that it’s been created, list all topics in the cluster by running:
bin/kafka-topics.sh --bootstrap-server localhost:9092 --list --command-config ~/client-jaas.conf
The output will show that new_topic is present:
Output__consumer_offsets
new_topic
...
In this section, you’ve configured your Kafka installation to use TLS encryption for traffic and SASL for authentication with combinations of a username and password. You’ll now learn how to export various Kafka metrics through JMX using Prometheus.
Step 3 - Monitoring Kafka JMX Metrics Using Prometheus
In this section, you’ll use Prometheus to gather Kafka metrics and make them queryable in Grafana. This entails setting up the JMX exporter for Kafka and connecting it to Prometheus.
[Java Management Extensions (JMX) is a framework for Java applications that allows developers to gather general and custom metrics about the app operation at runtime in a standardized format. Since Kafka is written in Java, it supports the JMX protocol and exposes its custom metrics through it, such as the status of topics and brokers.
Configuring Kafka and Prometheus
Before proceeding, you’ll need to install Prometheus. On Ubuntu machines, you can use apt. Update its repositories by running:
sudo apt update
Then, install Prometheus:
sudo apt install prometheus -y
For other platforms, please follow the installation instructions on the official website.
Once it’s installed, you’ll need to add the JMX exporter library for Prometheus to your Kafka installation. Navigate to the releases page and select the latest release with javaagent in the name. At the time of writing, the latest available version was 0.20.0. Use the following command to download it to the libs/ directory where Kafka is installed:
curl https://repo.maven.apache.org/maven2/io/prometheus/jmx/jmx_prometheus_javaagent/0.20.0/jmx_prometheus_javaagent-0.20.0.jar -o ~/kafka/libs/jmx_prometheus_javaagent.jar
The JMX exporter library will now be picked up by Kafka.
Before activating the exporter, you need to define what metrics it will report to Prometheus, and you’ll store that configuration in a file named jmx-exporter.yml under config/ of Kafka installation. The JMX exporter project provides a suitable default configuration, so run the following command to store it as jmx-exporter.yml under config/ of your Kafka installation:
curl https://raw.githubusercontent.com/prometheus/jmx_exporter/main/example_configs/kafka-2_0_0.yml -o ~/kafka/config/jmx-exporter.yml
Next, to activate the exporter, you’ll need to modify the Kafka systemd service. You’ll need to modify the KAFKA_OPTS environment variable to include the exporter, as well as its configuration. Run the following command to edit the service:
sudo systemctl edit --full kafka
Modify the Environment line to look like this:
Environment="KAFKA_OPTS=-Djava.security.auth.login.config=/home/kafka/kafka/config/kraft/kafka-server-jaas.conf -javaagent:/home/kafka/kafka/libs/jmx_prometheus_javaagent.jar=7075:/home/kafka/kafka/config/jmx-exporter.yml"
Here, you utilize the -javaagent argument to initialize the JMX exporter with its configuration.
Save and close the file when you’re done, then restart Kafka by running:
sudo systemctl restart kafka
After a minute, verify that the JMX exporter is running by querying if the port 7075 is used:
sudo ss -tunelp | grep 7075
The output should look like this:
Outputtcp LISTEN 0 3 *:7075 *:* users:(("java",pid=6311,fd=137)) uid:1000 ino:48151 sk:8 cgroup:/system.slice/kafka.service v6only:0 <->
This line shows that the port 7075 is in use by a Java process that is started by the Kafka service, which refers to the JMX exporter.
You’ll now configure Prometheus to watch over the exported JMX metrics. Its main configuration file is located at /etc/prometheus/prometheus.yml, so open it for editing:
sudo nano /etc/prometheus/prometheus.yml
Find the following lines:
...
# A scrape configuration containing exactly one endpoint to scrape:
# Here it's Prometheus itself.
scrape_configs:
  # The job name is added as a label `job=<job_name>` to any timeseries scraped from this config.
  - job_name: 'prometheus'

    # Override the global default and scrape targets from this job every 5 seconds.
    scrape_interval: 5s
    scrape_timeout: 5s

    # metrics_path defaults to '/metrics'
    # scheme defaults to 'http'.

    static_configs:
      - targets: ['localhost:9090']

  - job_name: node
    # If prometheus-node-exporter is installed, grab stats about the local
    # machine by default.
    static_configs:
      - targets: ['localhost:9100']
Under scrape_configs, which specifies which endpoints Prometheus should watch, add a new section for scraping Kafka metrics:
# A scrape configuration containing exactly one endpoint to scrape:
# Here it's Prometheus itself.
scrape_configs:
  # The job name is added as a label `job=<job_name>` to any timeseries scraped from this config.
  - job_name: 'prometheus'

    # Override the global default and scrape targets from this job every 5 seconds.
    scrape_interval: 5s
    scrape_timeout: 5s

    # metrics_path defaults to '/metrics'
    # scheme defaults to 'http'.

    static_configs:
      - targets: ['localhost:9090']

  - job_name: node
    # If prometheus-node-exporter is installed, grab stats about the local
    # machine by default.
    static_configs:
      - targets: ['localhost:9100']

  - job_name: 'kafka'
    static_configs:
    - targets: ['your_domain:7075']
The kafka job has one target, which points to the JMX exporter endpoint.
Remember to replace your_domain with your domain name, then save and close the file. Then, restart Prometheus by running:
sudo systemctl restart prometheus
In your browser, navigate to the port 9090 at your domain. You’ll access the Prometheus UI. Under Status, press on Targets to list the jobs:
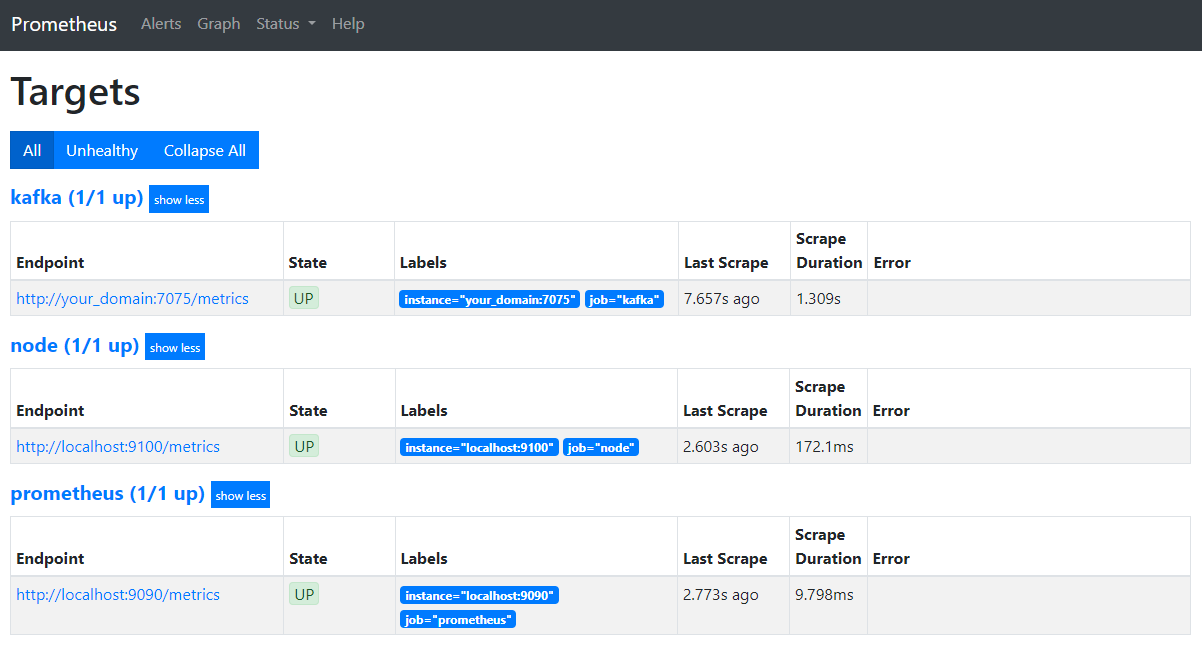
Notice that Prometheus has accepted the kafka job and started scraping its metrics. You’ll now learn how to access them in Grafana.
Querying Metrics in Grafana
As part of the prerequisites, you’ve installed Grafana on your Droplet and exposed it at your_domain. Navigate to it in your browser, and under Connections in the sidebar, press on Add New Connection, then type in Prometheus in the search field.
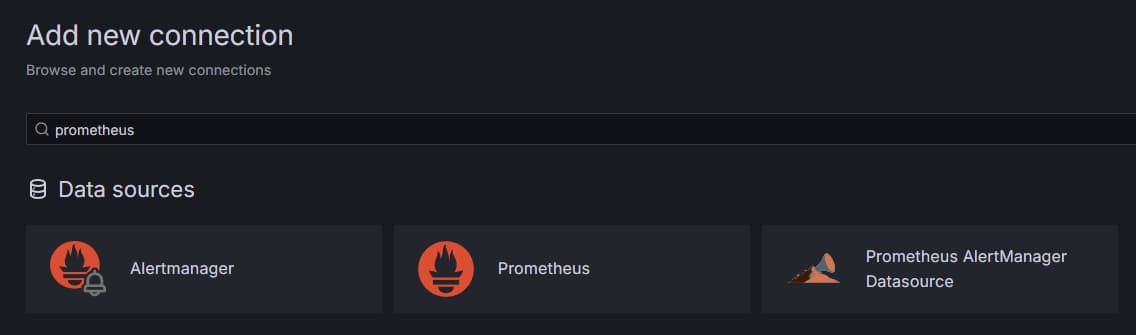
Press on Prometheus, then click on Add New Data Source button in the upper right. You’ll be asked to fill in the address of a Prometheus instance:
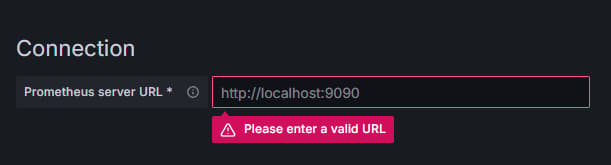
Enter in http://your_domain_name:9090, replace with your actual domain name, then scroll down and press on Save & test. You should receive a success message:

The Prometheus connection has been added to Grafana. Press on Explore in the sidebar, and you’ll be prompted to select a metric. You can type in kafka_ to list all metrics related to the cluster, as shown:
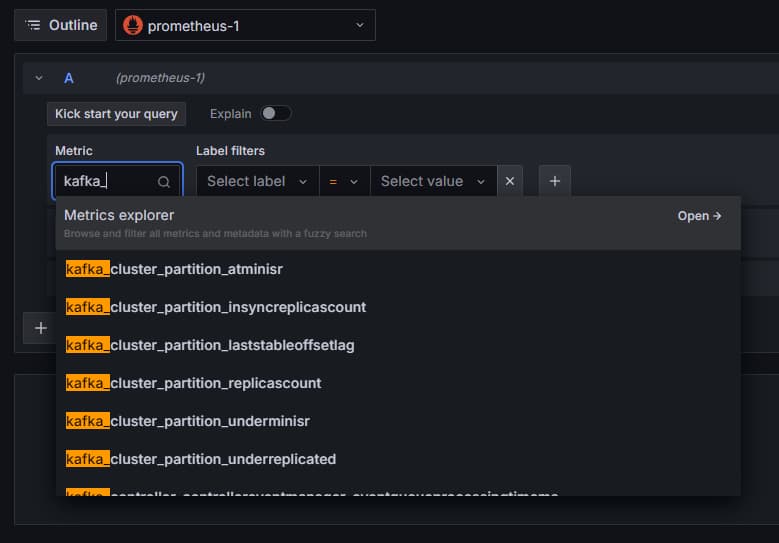
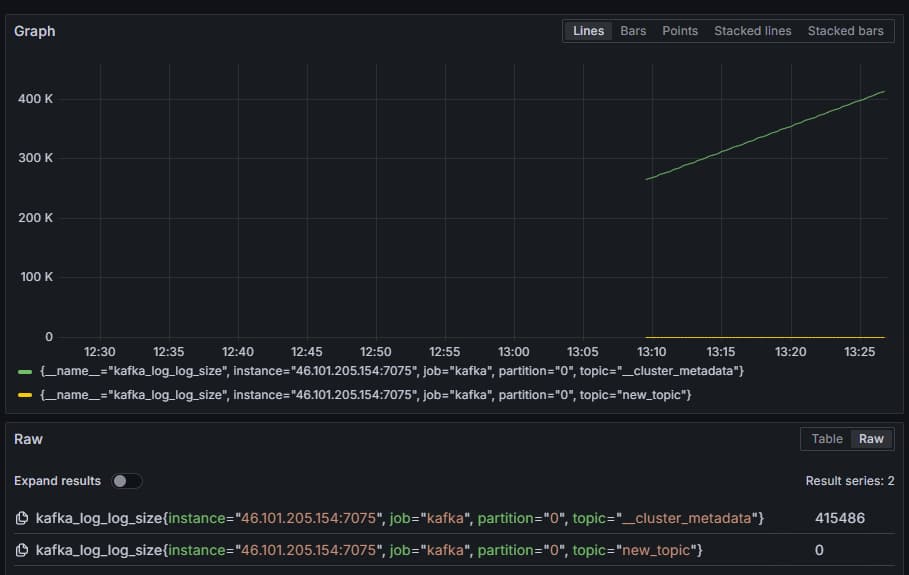
For example, select the kafka_log_log_size metric, which shows how big the internal log on disk is per partition, then press Run query in the upper right corner. You’ll see the resulting sizes through time for each of the available topics:
In this step, you’ve set up exporting JMX metrics that Kafka provides and configured Prometheus to scrape them. Then, you’ve connected to it from within Grafana and ran a query on the Kafka metrics. You’ll now learn how to manage a Kafka cluster using a web interface.
Step 4 - Managing Kafka Clusters With AKHQ
In this step, you’ll learn how to set up and use AKHQ, a web app for managing Kafka clusters. It allows you to list and manipulate topics, partitions, consumer groups and configuration parameters, as well as produce and consume messages from topics from a single place.
You’ll store the executable and its configuration in a directory named akhq. Create it in your home directory by running:
mkdir ~/akhq
Navigate to it:
cd ~/akhq
In your browser, visit the official releases page and copy the link to JAR file of the latest release. At the time of writing, the latest version was 0.24.0. Run the following command to download it to your home directory:
curl -L https://github.com/tchiotludo/akhq/releases/download/0.24.0/akhq-0.24.0-all.jar -o ~/akhq/akhq.jar
You’ve now downloaded AKHQ, and are ready to define its configuration for connecting to your cluster. You’ll store that in a file called akhq-config.yml. Create and open it for editing by running:
nano ~/akhq/akhq-config.yml
Add the following lines:
akhq:
  connections:
    localhost-sasl:
      properties:
        bootstrap.servers: "localhost:9092"
        security.protocol: SASL_SSL
        sasl.mechanism: PLAIN
        sasl.jaas.config: org.apache.kafka.common.security.plain.PlainLoginModule required username="admin" password="admin";
        ssl.truststore.location: /home/kafka/kafka-ssl/truststore/kafka.truststore.jks
        ssl.truststore.password: secret
        ssl.keystore.location: /home/kafka/kafka-ssl/keystore/kafka.keystore.jks
        ssl.keystore.password: secret
        ssl.key.password: secret
        ssl.endpoint.identification.algorithm: ""
This is a basic AKHQ configuration, specifying one cluster at localhost:9092 with the accompanying SASL and TLS parameters specified. Multiple clusters simultaneously are also supported because you can define as many connections as you want. This makes AKHQ versatile for managing Kafka. When you’re done, save and close the file.
Next, you’ll need to define a systemd service for running AKHQ in the background. systemd services can be started, stopped, and restarted consistently.
You’ll store the service configuration in a file named code-server.service, in the /lib/systemd/system directory, where systemd stores its services. Create it using your text editor:
sudo nano /etc/systemd/system/akhq.service
Add the following lines:
[Unit]
Description=akhq

[Service]
Type=simple
User=kafka
ExecStart=/bin/sh -c 'java -Dmicronaut.config.files=/home/kafka/akhq/akhq-config.yml -jar /home/kafka/akhq/akhq.jar'
Restart=on-abnormal

[Install]
WantedBy=multi-user.target
You first specify the service’s description. Then, in the [Service] section, you define the type of the service (simple means that the command should simply execute) and provide the command that will be run. You also specify that the user it runs as is kafka and that the service should be automatically restarted if it exits.
The [Install] section orders systemd to start this service when you can log in to your server. Save and close the file when you’re done.
Load the service configuration by running:
sudo systemctl daemon-reload
Start the AKHQ service by running the following command:
sudo systemctl start akhq
Then, check that it’s started correctly by observing its status:
sudo systemctl status akhq
The output should look like this:
Output● akhq.service - akhq
     Loaded: loaded (/etc/systemd/system/akhq.service; disabled; vendor preset: enabled)
     Active: active (running) since Wed 2024-05-15 07:37:10 UTC; 3s ago
   Main PID: 3241 (sh)
      Tasks: 21 (limit: 4647)
     Memory: 123.3M
        CPU: 4.474s
     CGroup: /system.slice/akhq.service
             ├─3241 /bin/sh -c "java -Dmicronaut.config.files=/home/kafka/akhq/akhq-config.yml -jar /home/kafka/akhq/akhq.jar"
             └─3242 java -Dmicronaut.config.files=/home/kafka/akhq/akhq-config.yml -jar /home/kafka/akhq/akhq.jar
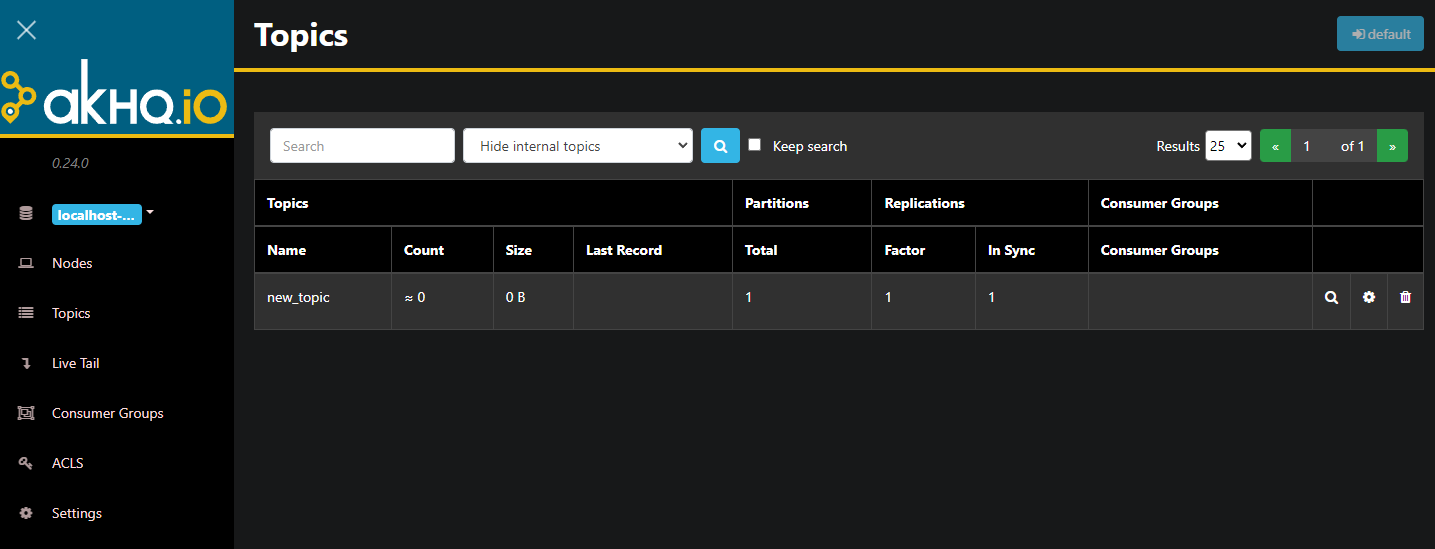
AKHQ is now running in the background. By default, it’s exposed at port 8080. In your browser, navigate to your domain with that port to access it. You’ll see the default view, showing the list of topics:
You can double-click on the accompanying row of the topic in the table to access it to get a detailed view:
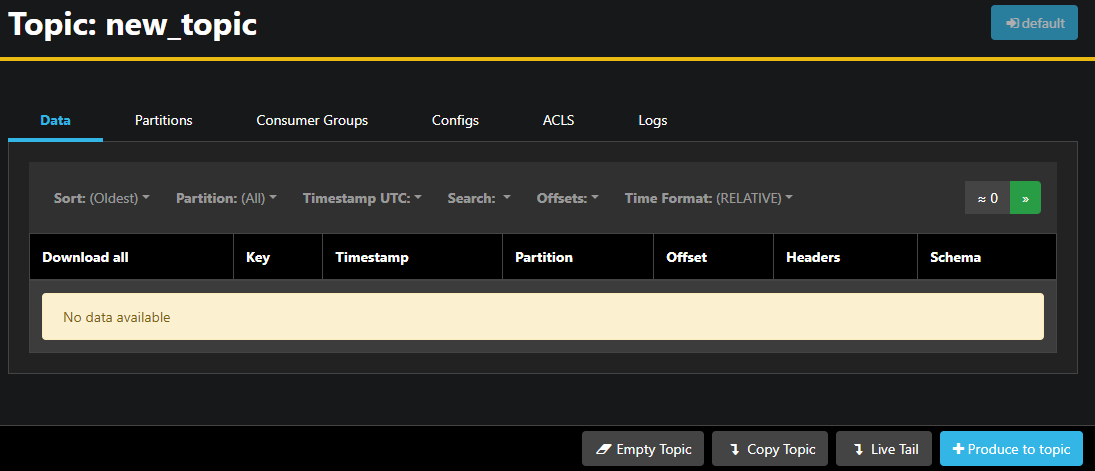
AKHQ allows you to see the messages in the topic, as well as partitions, consumer groups, and their configuration. You can also empty or copy the topic using the buttons on the lower right.
Since the new_topic topic is empty, press the Produce to topic button, which will open the interface for selecting the parameters of the new message:
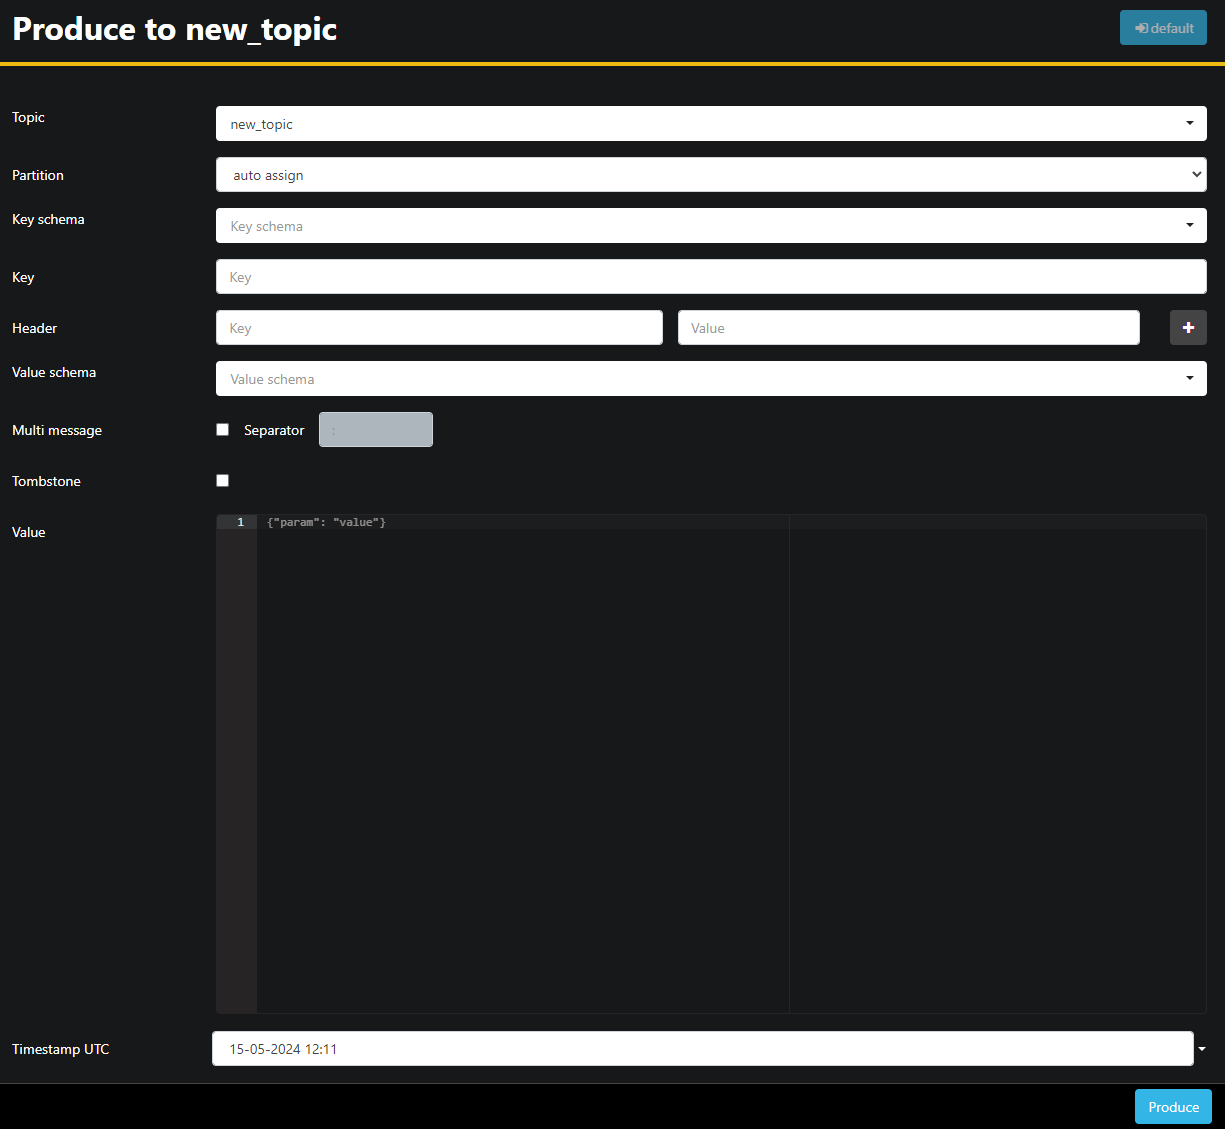
AKHQ will automatically fill in the topic name for you. In the Value field, enter Hello World!, then press Produce. The message will be sent to Kafka, and you’ll see it in the Data tab:
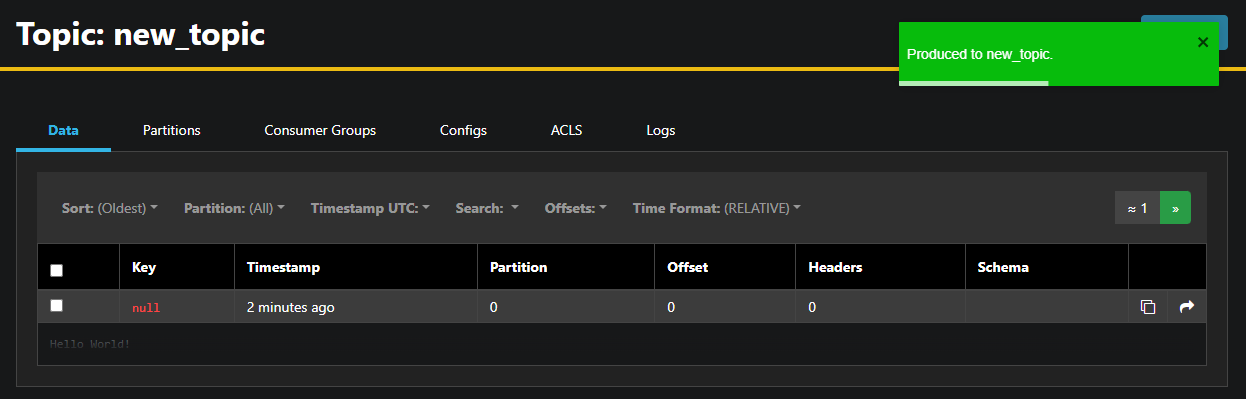
Since a message’s contents may be very large, AKHQ only shows the first line. To view the complete message, press on the darkened area after the row to reveal it.
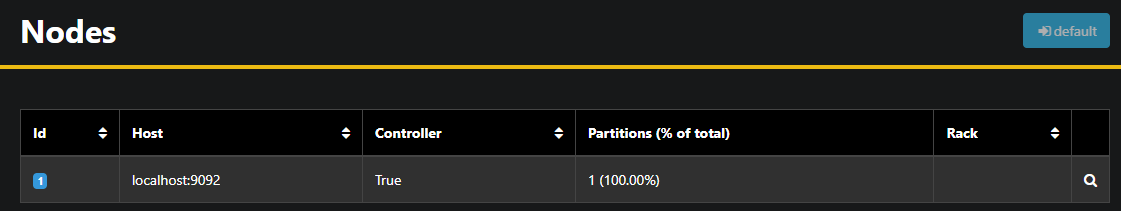
In the left sidebar, you can also list the brokers in the cluster by pressing on Nodes. Right now, the cluster consists of only one node:
Double-clicking on a node will open its configuration, allowing you to change any of the settings remotely:
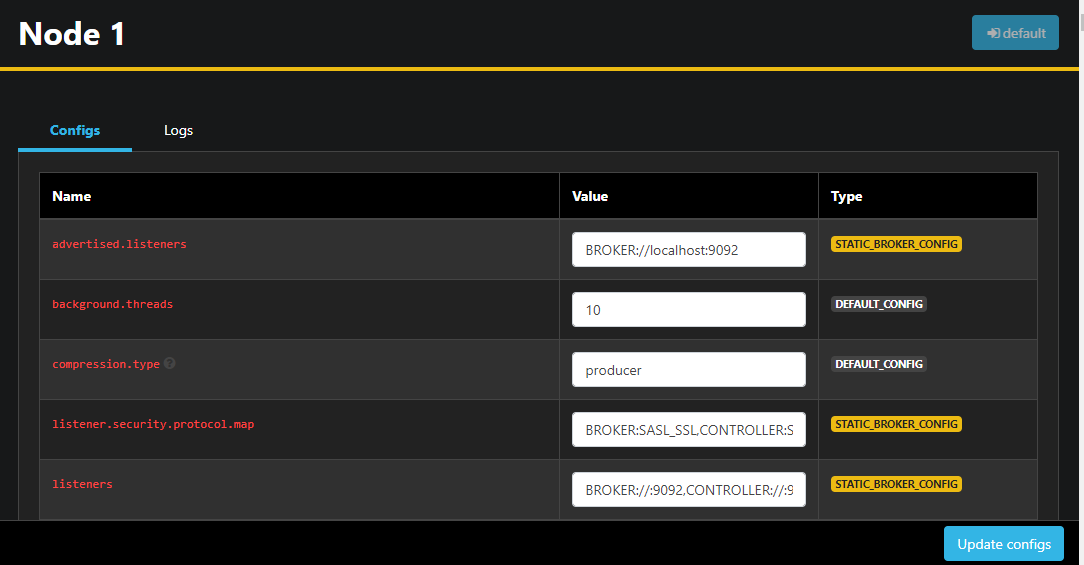
Once you’ve made changes, you can apply them by pressing the Update configs button on the lower right. Similarly, you can view and modify the configuration of any of the topics by accessing them and switching to the Configs tab.
In this section, you’ve set up AKHQ, a web app providing an easy-to-use UI for managing and observing Kafka nodes and topics remotely. It allows you to produce and consume messages in topics and update the configuration parameters of both topics and nodes on the fly.
Conclusion
In this tutorial, you’ve secured your Kafka installation by configuring TLS for encryption and SASL for user authentication. You’ve also set up metric exporting using Prometheus and visualized them in Grafana. Then, you’ve learned how to use AKHQ, a web app for managing Kafka clusters.
The author selected Apache Software Foundation to receive a donation as part of the Write for DOnations program.
Thanks for learning with the DigitalOcean Community. Check out our offerings for compute, storage, networking, and managed databases.
About the author(s)
Expert in cloud topics including Kafka, Kubernetes, and Ubuntu.
Anish is a Sr Technical Content Strategist and Team Lead at DigitalOcean with 7+ years of experience as an DevOps SRE at Nutanix and Cloud consultant at AMEX, and technical writing at DOCN, and shipping deep infra and AI inference tutorials that help developers deploy production‑ready applications on DigitalOcean.
Still looking for an answer?
This textbox defaults to using Markdown to format your answer.
You can type !ref in this text area to quickly search our full set of tutorials, documentation & marketplace offerings and insert the link!
 This work is licensed under a Creative Commons Attribution-NonCommercial- ShareAlike 4.0 International License.
Become a contributor for community
Get paid to write technical tutorials and select a tech-focused charity to receive a matching donation.

DigitalOcean Documentation
Full documentation for every DigitalOcean product.

Resources for startups and AI-native businesses
The Wave has everything you need to know about building a business, from raising funding to marketing your product.
The developer cloud
Scale up as you grow — whether you're running one virtual machine or ten thousand.

Start building today
From GPU-powered inference and Kubernetes to managed databases and storage, get everything you need to build, scale, and deploy intelligent applications.
