
Introduction
A service mesh is an infrastructure layer that allows you to manage communication between your application’s microservices. As more developers work with microservices, service meshes have evolved to make that work easier and more effective by consolidating common management and administrative tasks in a distributed setup.
Taking a microservice approach to application architecture involves breaking your application into a collection of loosely-coupled services. This approach offers certain benefits: teams can iterate designs and scale quickly, using a wider range of tools and languages. On the other hand, microservices pose new challenges for operational complexity, data consistency, and security.
Service meshes are designed to address some of these challenges by offering a granular level of control over how services communicate with one another. Specifically, they offer developers a way to manage:
- Service discovery
- Routing and traffic configuration
- Encryption and authentication/authorization
- Metrics and monitoring
Though it is possible to do these tasks natively with container orchestrators like Kubernetes, this approach involves a greater amount of up-front decision-making and administration when compared to what service mesh solutions like Istio and Linkerd offer out of the box. In this sense, service meshes can streamline and simplify the process of working with common components in a microservice architecture. In some cases they can even extend the functionality of these components.
Why Services Meshes?
Service meshes are designed to address some of the challenges inherent to distributed application architectures.
These architectures grew out of the three-tier application model, which broke applications into a web tier, application tier, and database tier. At scale, this model has proved challenging to organizations experiencing rapid growth. Monolithic application code bases can grow to be unwieldy “big balls of mud”, posing challenges for development and deployment.
In response to this problem, organizations like Google, Netflix, and Twitter developed internal “fat client” libraries to standardize runtime operations across services. These libraries provided load balancing, circuit breaking, routing, and telemetry — precursors to service mesh capabilities. However, they also imposed limitations on the languages developers could use and required changes across services when they themselves were updated or changed.
A microservice design avoids some of these issues. Instead of having a large, centralized application codebase, you have a collection of discretely managed services that represent a feature of your application. Benefits of a microservice approach include:
- Greater agility in development and deployment, since teams can work on and deploy different application features independently.
- Better options for CI/CD, since individual microservices can be tested and redeployed independently.
- More options for languages and tools. Developers can use the best tools for the tasks at hand, rather than being restricted to a given language or toolset.
- Ease in scaling.
- Improvements in uptime, user experience, and stability.
At the same time, microservices have also created challenges:
- Distributed systems require different ways of thinking about latency, routing, asynchronous workflows, and failures.
- Microservice setups cannot necessarily meet the same requirements for data consistency as monolithic setups.
- Greater levels of distribution necessitate more complex operational designs, particularly when it comes to service-to-service communication.
- Distribution of services increases the surface area for security vulnerabilities.
Service meshes are designed to address these issues by offering coordinated and granular control over how services communicate. In the sections that follow, we’ll look at how service meshes facilitate service-to-service communication through service discovery, routing and internal load balancing, traffic configuration, encryption, authentication and authorization, and metrics and monitoring. We will use Istio’s Bookinfo sample application — four microservices that together display information about particular books — as a concrete example to illustrate how service meshes work.
Service Discovery
In a distributed framework, it’s necessary to know how to connect to services and whether or not they are available. Service instance locations are assigned dynamically on the network and information about them is constantly changing as containers are created and destroyed through autoscaling, upgrades, and failures.
Historically, there have been a few tools for doing service discovery in a microservice framework. Key-value stores like etcd were paired with other tools like Registrator to offer service discovery solutions. Tools like Consul iterated on this by combining a key-value store with a DNS interface that allows users to work directly with their DNS server or node.
Taking a similar approach, Kubernetes offers DNS-based service discovery by default. With it, you can look up services and service ports, and do reverse IP lookups using common DNS naming conventions. In general, an A record for a Kubernetes service matches this pattern: service.namespace.svc.cluster.local. Let’s look at how this works in the context of the Bookinfo application. If, for example, you wanted information on the details service from the Bookinfo app, you could look at the relevant entry in the Kubernetes dashboard:
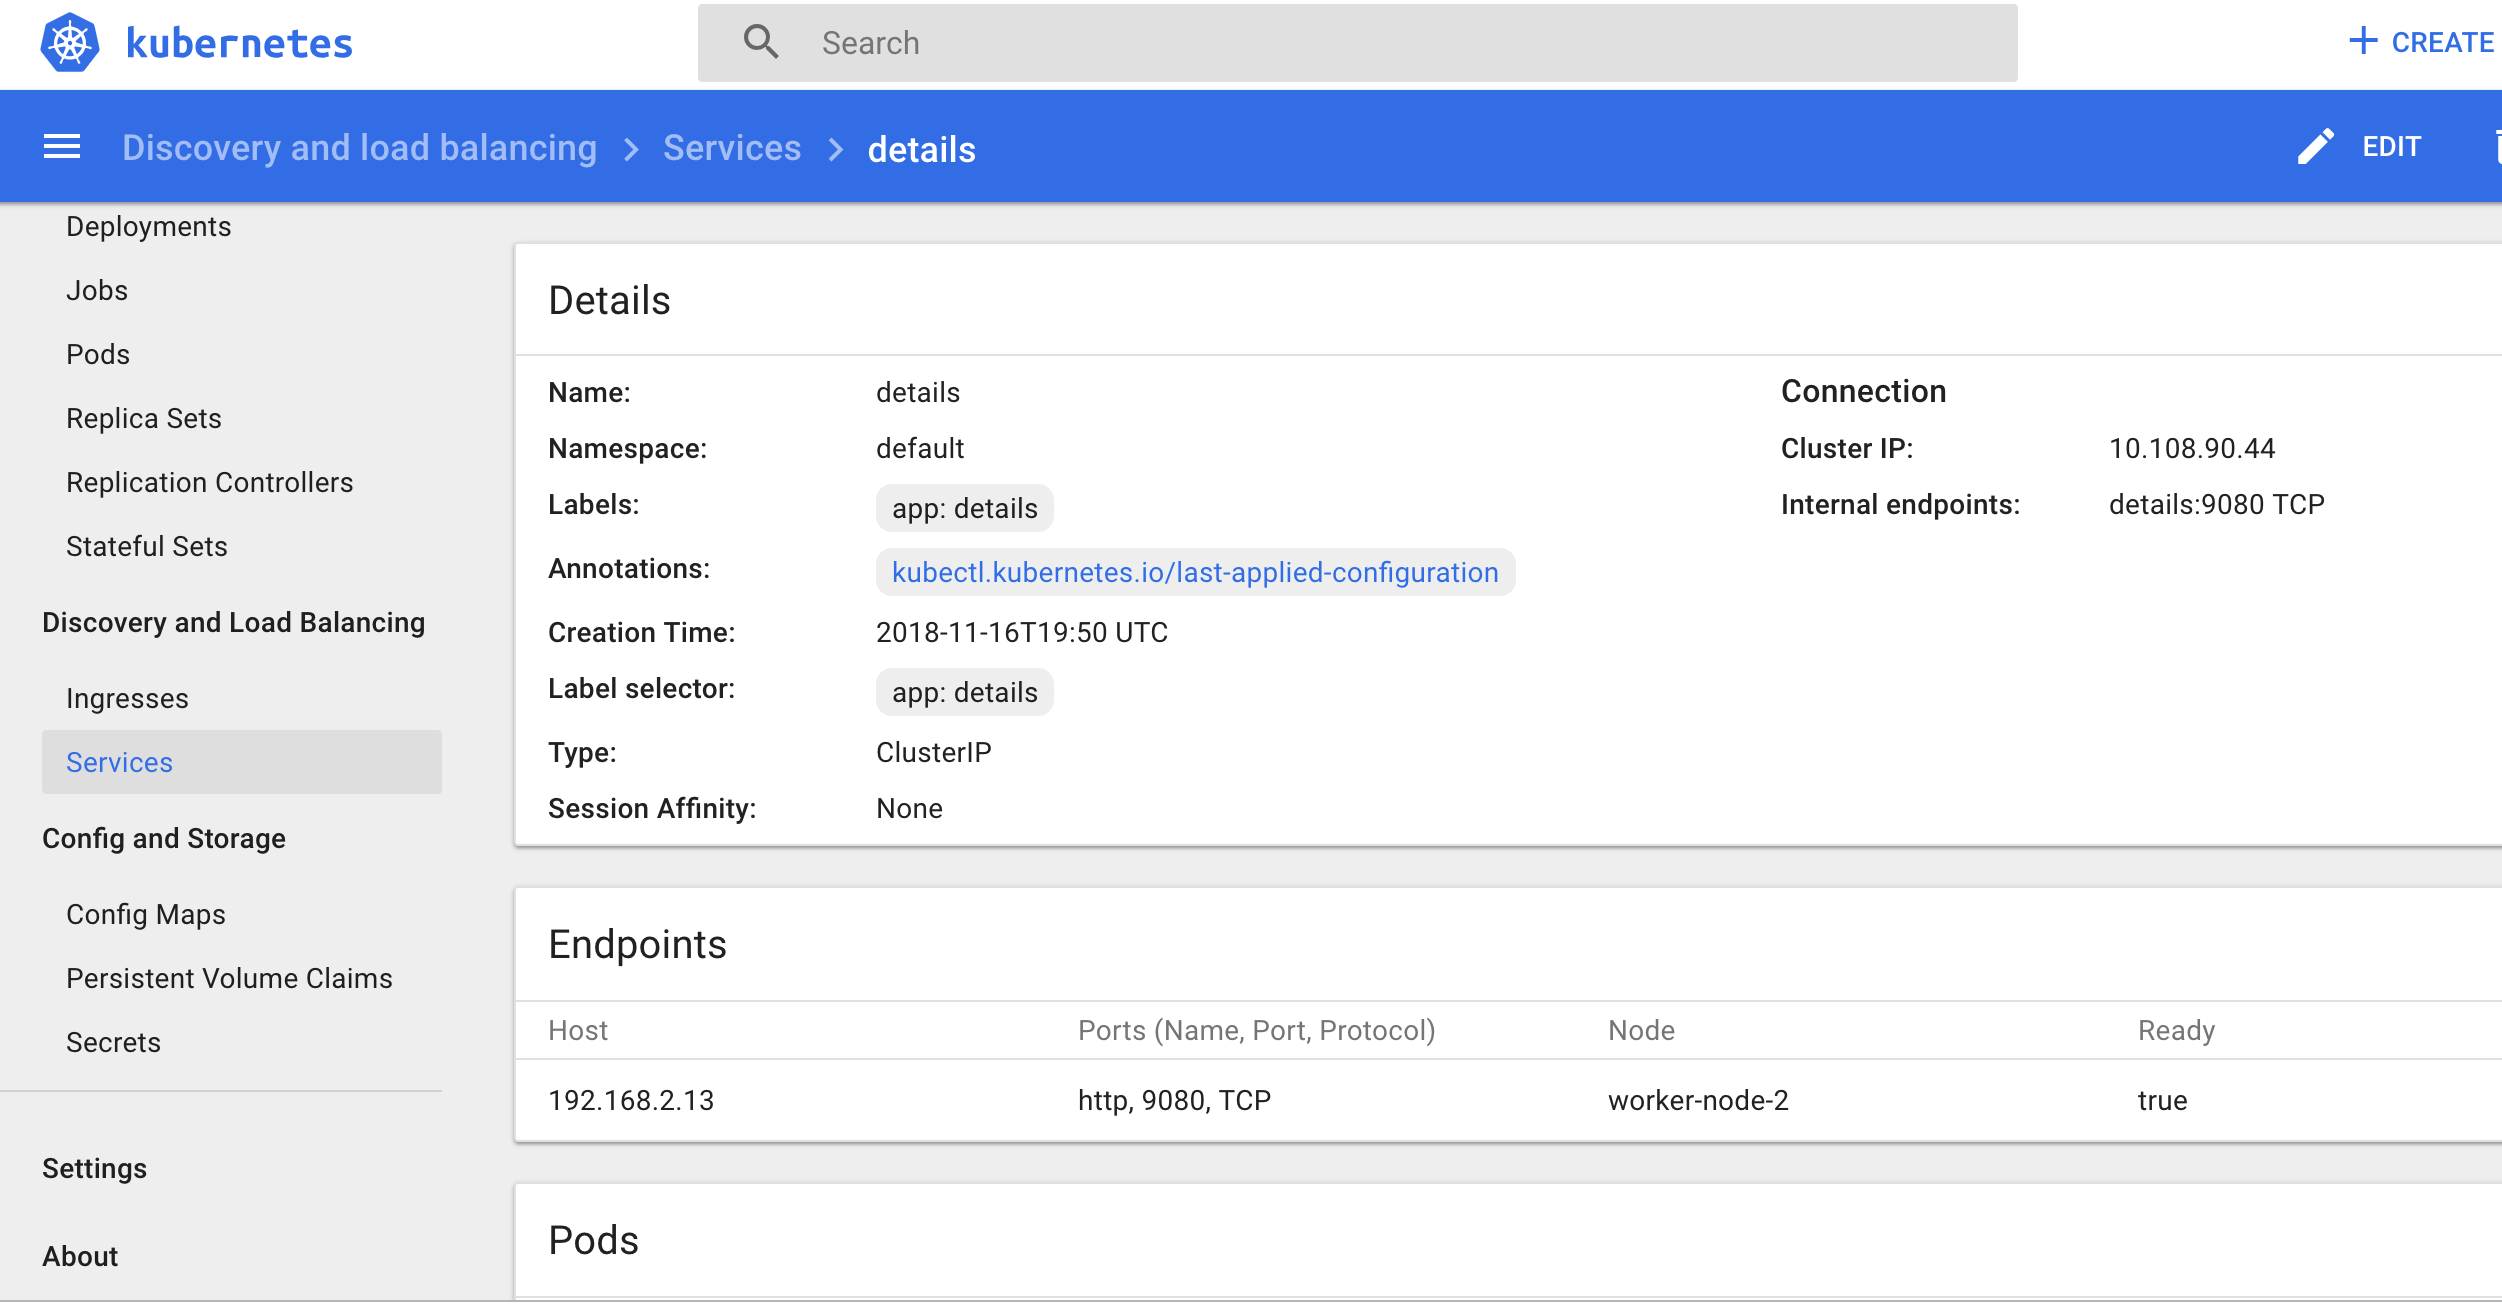
This will give you relevant information about the Service name, namespace, and ClusterIP, which you can use to connect with your Service even as individual containers are destroyed and recreated.
A service mesh like Istio also offers service discovery capabilities. To do service discovery, Istio relies on communication between the Kubernetes API, Istio’s own control plane, managed by the traffic management component Pilot, and its data plane, managed by Envoy sidecar proxies. Pilot interprets data from the Kubernetes API server to register changes in Pod locations. It then translates that data into a canonical Istio representation and forwards it onto the sidecar proxies.
This means that service discovery in Istio is platform agnostic, which we can see by using Istio’s Grafana add-on to look at the details service again in Istio’s service dashboard:
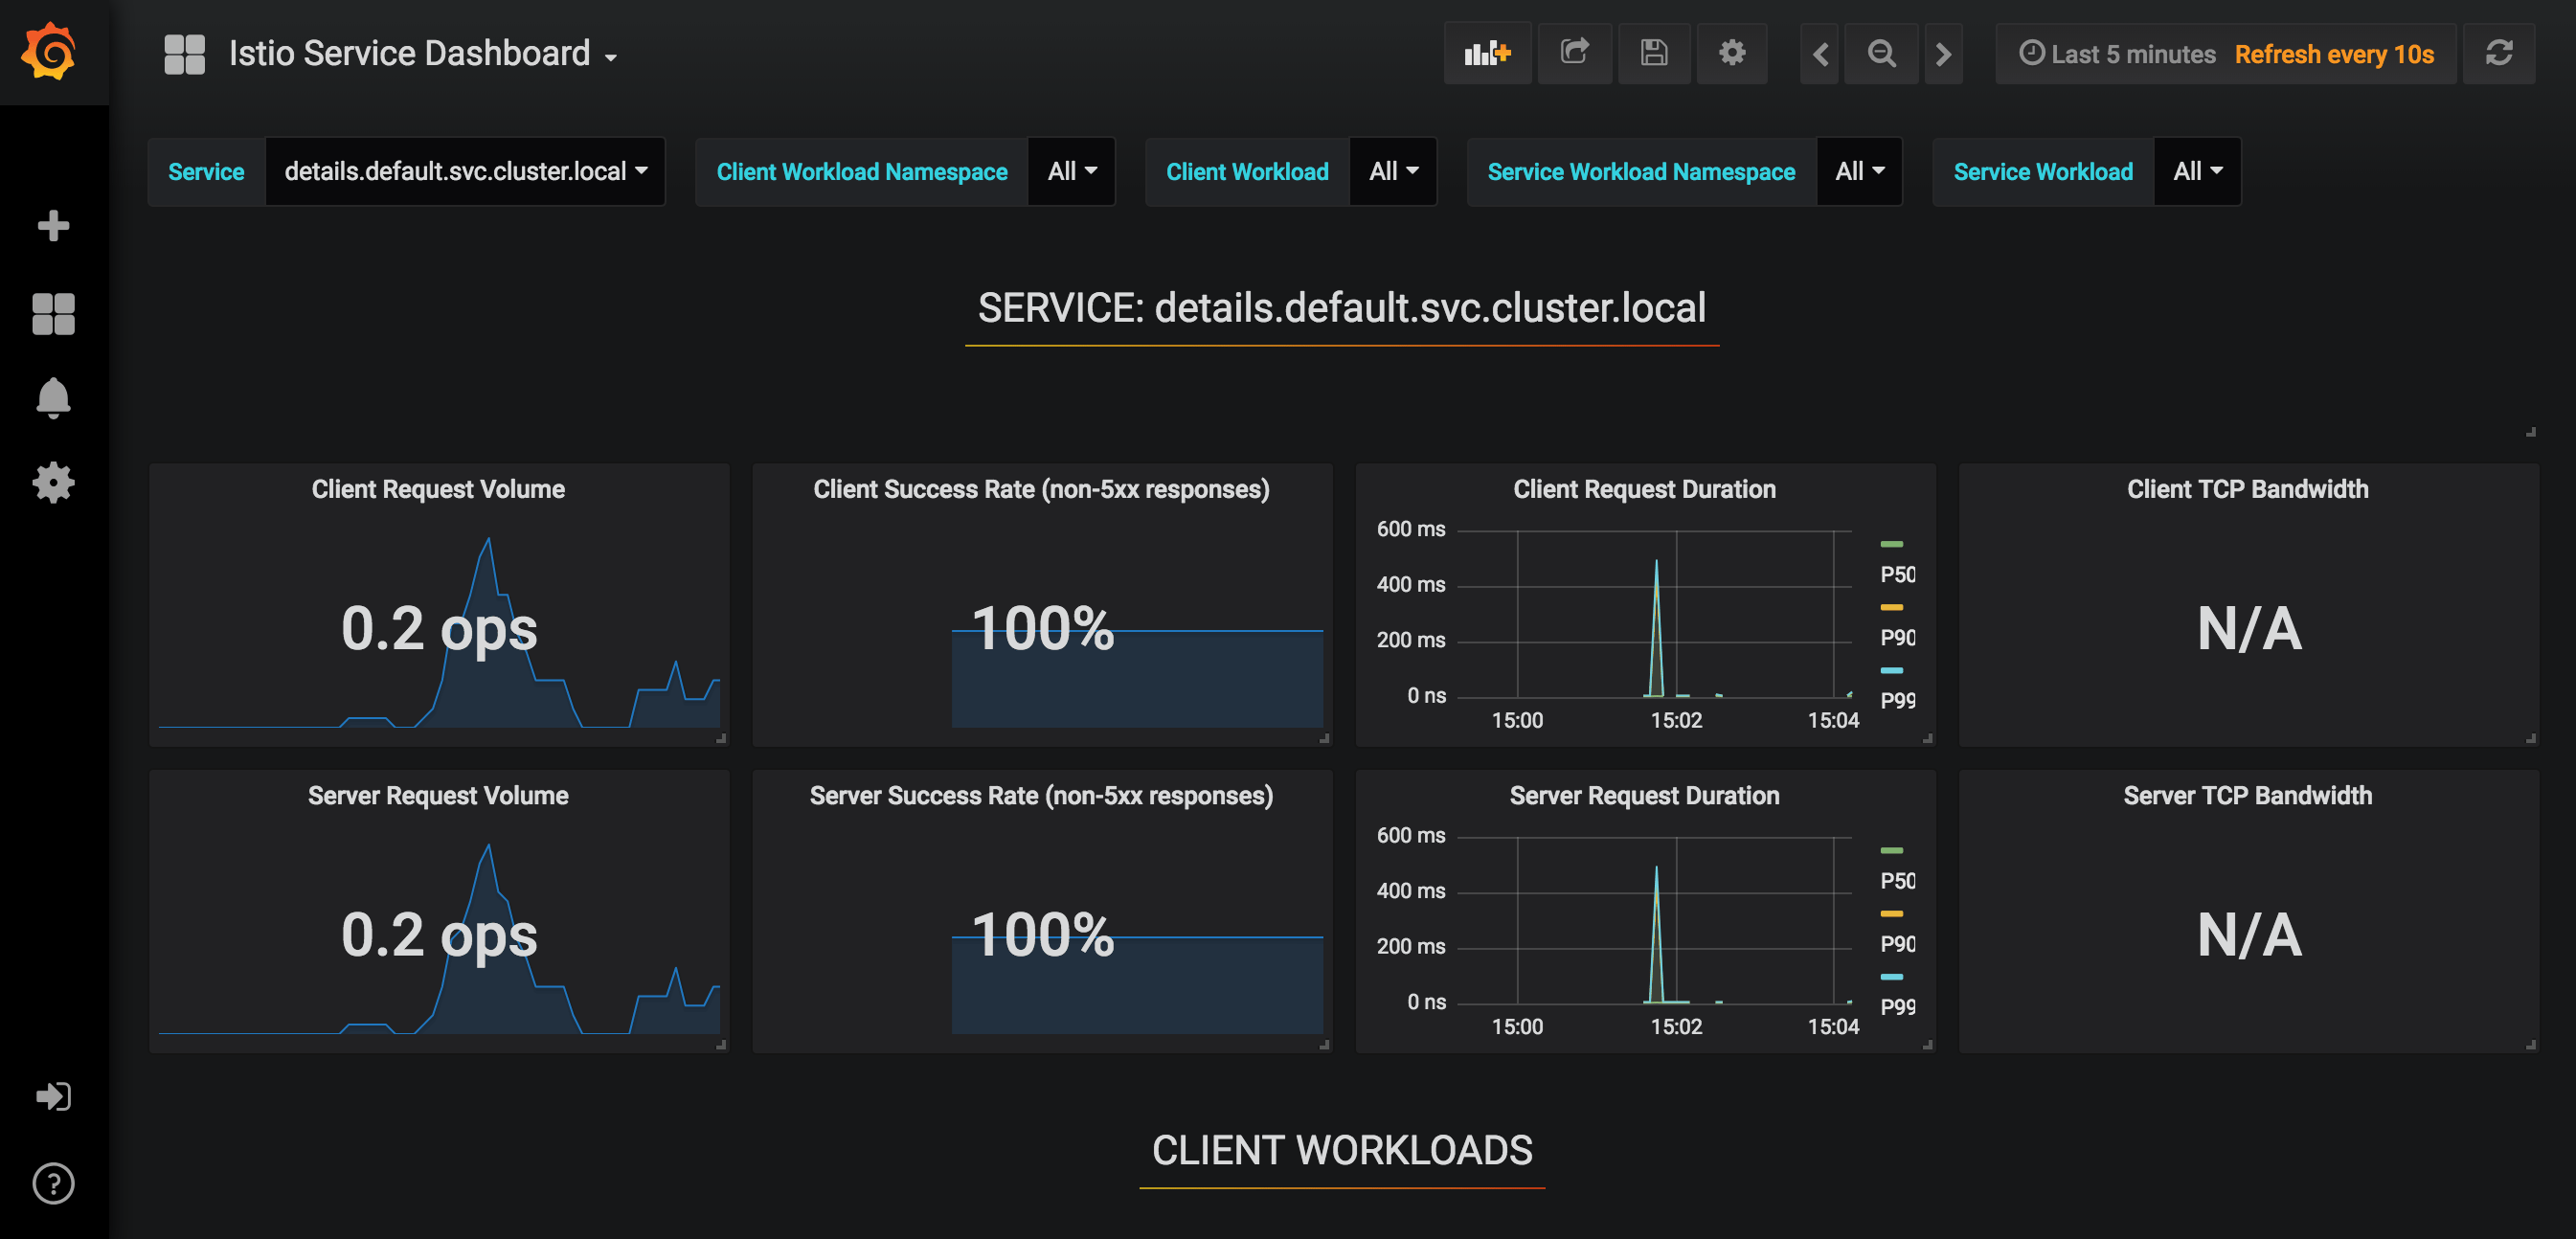
Our application is running on a Kubernetes cluster, so once again we can see the relevant DNS information about the details Service, along with other performance data.
In a distributed architecture, it’s important to have up-to-date, accurate, and easy-to-locate information about services. Both Kubernetes and service meshes like Istio offer ways to obtain this information using DNS conventions.
Routing and Traffic Configuration
Managing traffic in a distributed framework means controlling how traffic gets to your cluster and how it’s directed to your services. The more control and specificity you have in configuring external and internal traffic, the more you will be able to do with your setup. For example, in cases where you are working with canary deployments, migrating applications to new versions, or stress testing particular services through fault injection, having the ability to decide how much traffic your services are getting and where it is coming from will be key to the success of your objectives.
Kubernetes offers different tools, objects, and services that allow developers to control external traffic to a cluster: kubectl proxy, NodePort, Load Balancers, and Ingress Controllers and Resources. Both kubectl proxy and NodePort allow you to quickly expose your services to external traffic: kubectl proxy creates a proxy server that allows access to static content with an HTTP path, while NodePort exposes a randomly assigned port on each node. Though this offers quick access, drawbacks include having to run kubectl as an authenticated user, in the case of kubectl proxy, and a lack of flexibility in ports and node IPs, in the case of NodePort. And though a Load Balancer optimizes for flexibility by attaching to a particular Service, each Service requires its own Load Balancer, which can be costly.
An Ingress Resource and Ingress Controller together offer a greater degree of flexibility and configurability over these other options. Using an Ingress Controller with an Ingress Resource allows you to route external traffic to Services and configure internal routing and load balancing. To use an Ingress Resource, you need to configure your Services, the Ingress Controller and LoadBalancer, and the Ingress Resource itself, which will specify the desired routes to your Services. Currently, Kubernetes supports its own Nginx Controller, but there are other options you can choose from as well, managed by Nginx, Kong, and others.
Istio iterates on the Kubernetes Controller/Resource pattern with Istio Gateways and VirtualServices. Like an Ingress Controller, a Gateway defines how incoming traffic should be handled, specifying exposed ports and protocols to use. It works in conjunction with a VirtualService, which defines routes to Services within the mesh. Both of these resources communicate information to Pilot, which then forwards that information to the Envoy proxies. Though they are similar to Ingress Controllers and Resources, Gateways and VirtualServices offer a different level of control over traffic: instead of combining Open Systems Interconnection (OSI) layers and protocols, Gateways and VirtualServices allow you to differentiate between OSI layers in your settings. For example, by using VirtualServices, teams working with application layer specifications could have a separation of concerns from security operations teams working with different layer specifications. VirtualServices make it possible to separate work on discrete application features or within different trust domains, and can be used for things like canary testing, gradual rollouts, A/B testing, etc.
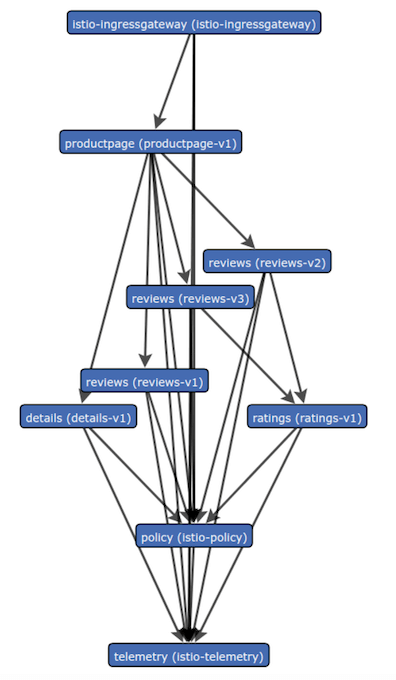
To visualize the relationship between Services, you can use Istio’s Servicegraph add-on, which produces a dynamic representation of the relationship between Services using real-time traffic data. The Bookinfo application might look like this without any custom routing applied:
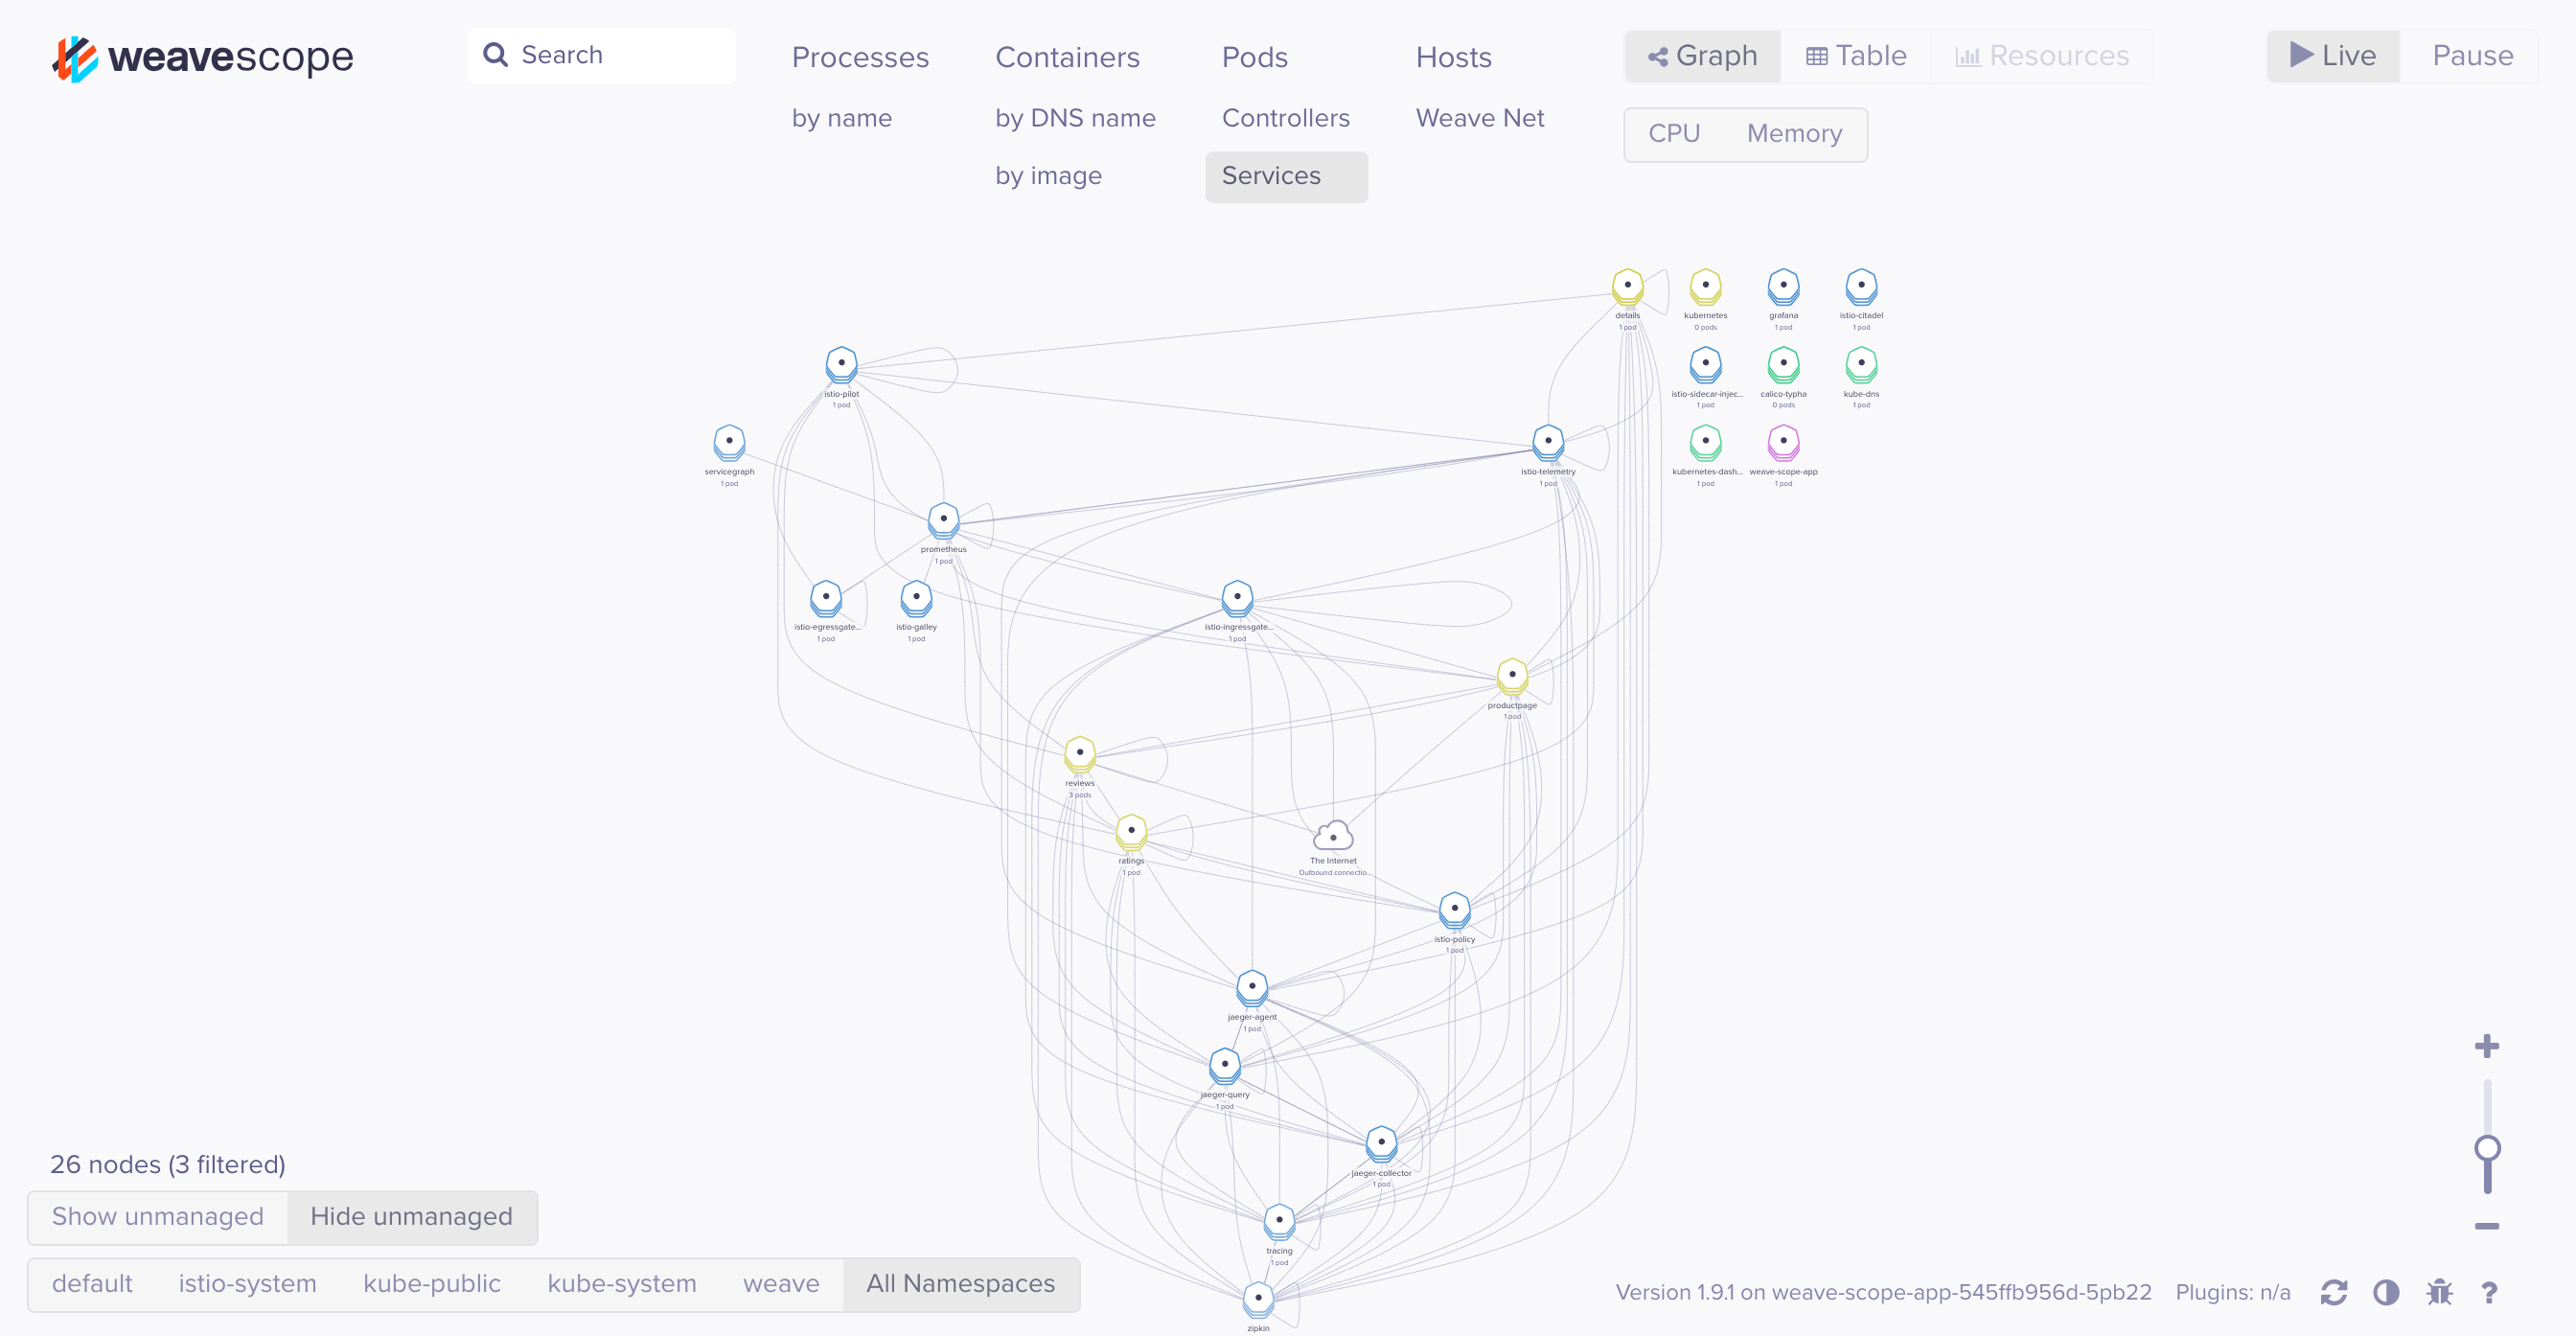
Similarly, you can use a visualization tool like Weave Scope to see the relationship between your Services at a given time. The Bookinfo application without advanced routing might look like this:
When configuring application traffic in a distributed framework, there are a number of different solutions — from Kubernetes-native options to service meshes like Istio — that offer various options for determining how external traffic will reach your application resources and how these resources will communicate with one another.
Encryption and Authentication/Authorization
A distributed framework presents opportunities for security vulnerabilities. Instead of communicating through local internal calls, as they would in a monolithic setup, services in a microservice architecture communicate information, including privileged information, over the network. Overall, this creates a greater surface area for attacks.
Securing Kubernetes clusters involves a range of procedures; we will focus on authentication, authorization, and encryption. Kubernetes offers native approaches to each of these:
- Authentication: API requests in Kubernetes are tied to user or service accounts, which need to be authenticated. There are several different ways to manage the necessary credentials: Static Tokens, Bootstrap Tokens, X509 client certificates, and external tools like OpenID Connect.
- Authorization: Kubernetes has different authorization modules that allow you to determine access based on things like roles, attributes, and other specialized functions. Since all requests to the API server are denied by default, each part of an API request must be defined by an authorization policy.
- Encryption: This can refer to any of the following: connections between end users and services, secret data, endpoints in the Kubernetes control plane, and communication between worker cluster components and master components. Kubernetes has different solutions for each of these:
- Ingress Controllers and Resources, which can be used in conjunction with add-ons like cert-manager to manage TLS certificates.
- Encryption of secret data at rest for encrypting the secrets resources in
etcd. - TLS bootstrapping to bootstrap client certificates for kubelets and secure communication between worker nodes and the
kube-apisever. You can also use an overlay network like Weave Net to do this.
Configuring individual security policies and protocols in Kubernetes requires administrative investment. A service mesh like Istio can consolidate some of these activities.
Istio is designed to automate some of the work of securing services. Its control plane includes several components that handle security:
- Citadel: manages keys and certificates.
- Pilot: oversees authentication and naming policies and shares this information with Envoy proxies.
- Mixer: manages authorization and auditing.
For example, when you create a Service, Citadel receives that information from the kube-apiserver and creates SPIFFE certificates and keys for this Service. It then transfers this information to Pods and Envoy sidecars to facilitate communication between Services.
You can also implement some security features by enabling mutual TLS during the Istio installation. These include strong service identities for cross- and inter-cluster communication, secure service-to-service and user-to-service communication, and a key management system that can automate key and certificate creation, distribution, and rotation.
By iterating on how Kubernetes handles authentication, authorization, and encryption, service meshes like Istio are able to consolidate and extend some of the recommended best practices for running a secure Kubernetes cluster.
Metrics and Monitoring
Distributed environments have changed the requirements for metrics and monitoring. Monitoring tools need to be adaptive, accounting for frequent changes to services and network addresses, and comprehensive, allowing for the amount and type of information passing between services.
Kubernetes includes some internal monitoring tools by default. These resources belong to its resource metrics pipeline, which ensures that the cluster runs as expected. The cAdvisor component collects network usage, memory, and CPU statistics from individual containers and nodes and passes that information to kubelet; kubelet in turn exposes that information via a REST API. The Metrics Server gets this information from the API and then passes it to the kube-aggregator for formatting.
You can extended these internal tools and monitoring capabilities with a full metrics solution. Using a service like Prometheus as a metrics aggregator allows you to build directly on top of the Kubernetes resource metrics pipeline. Prometheus integrates directly with cAdvisor through its own agents, located on the nodes. Its main aggregation service collects and stores data from the nodes and exposes it though dashboards and APIs. Additional storage and visualization options are also available if you choose to integrate your main aggregation service with backend storage, logging, and visualization tools like InfluxDB, Grafana, ElasticSearch, Logstash, Kibana, and others.
In a service mesh like Istio, the structure of the full metrics pipeline is part of the mesh’s design. Envoy sidecars operating at the Pod level communicate metrics to Mixer, which manages policies and telemetry. Additionally, Prometheus and Grafana services are enabled by default (though if you are installing Istio with Helm you will need to specify granafa.enabled=true during installation). As is the case with the full metrics pipeline, you can also configure other services and deployments for logging and viewing options.
With these metric and visualization tools in place, you can access current information about services and workloads in a central place. For example, a global view of the BookInfo application might look like this in the Istio Grafana dashboard:
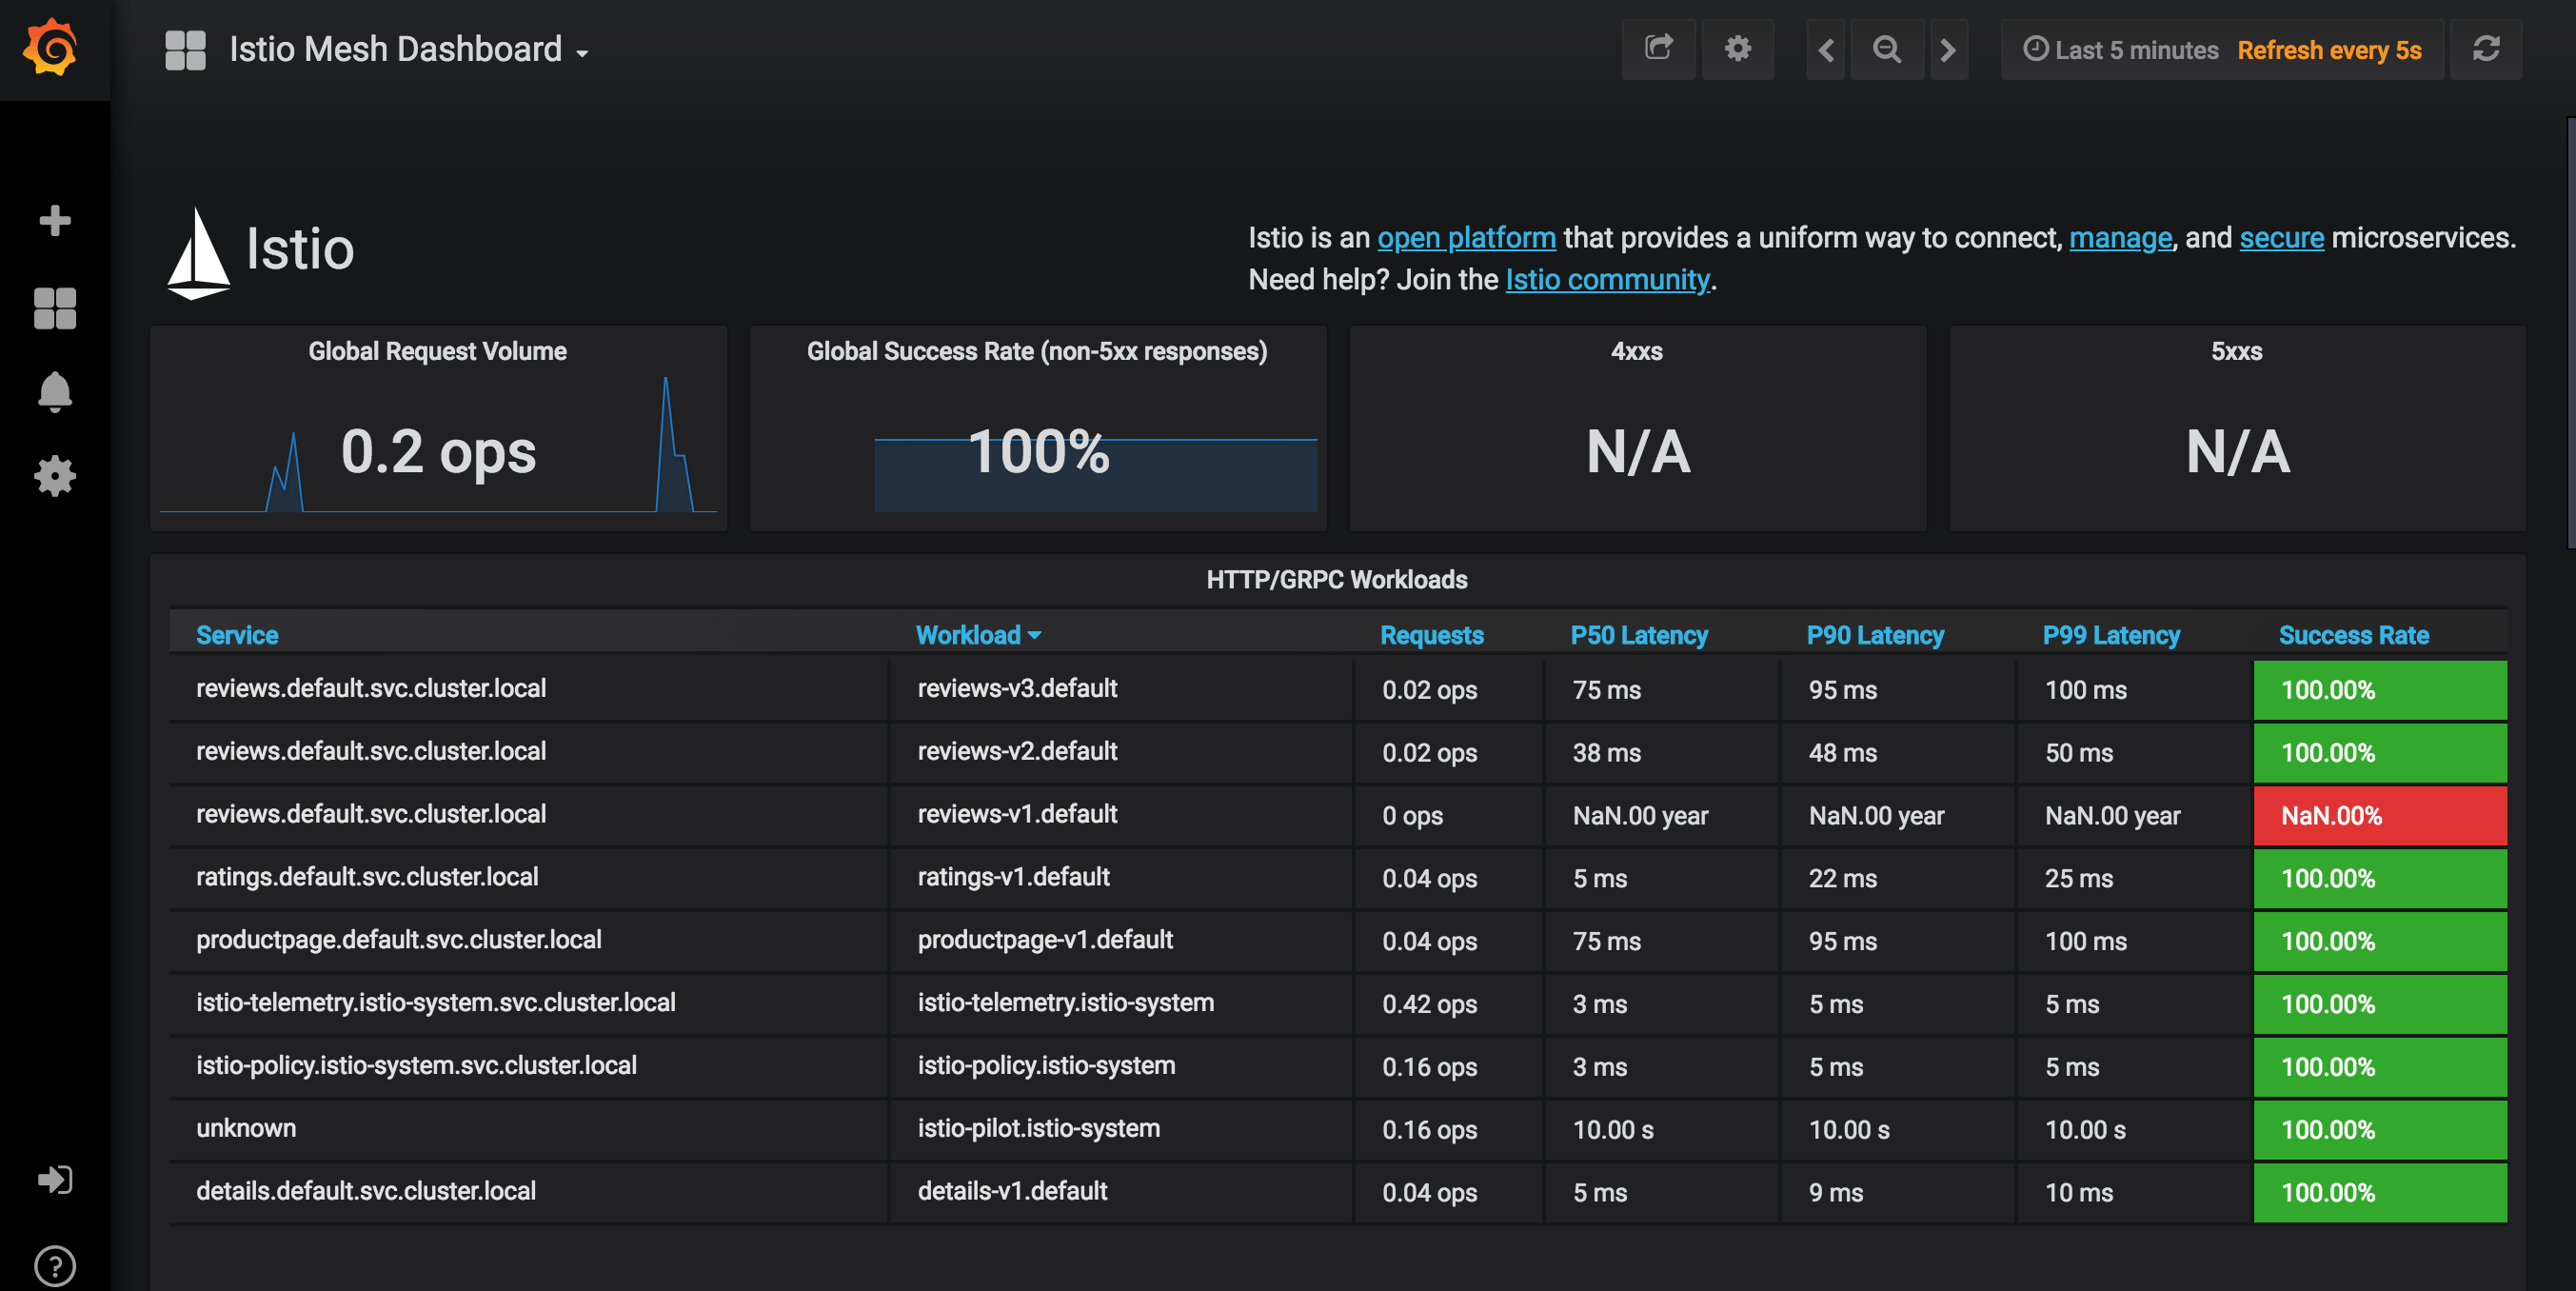
By replicating the structure of a Kubernetes full metrics pipeline and simplifying access to some of its common components, service meshes like Istio streamline the process of data collection and visualization when working with a cluster.
Conclusion
Microservice architectures are designed to make application development and deployment fast and reliable. Yet an increase in inter-service communication has changed best practices for certain administrative tasks. This article discusses some of those tasks, how they are handled in a Kubernetes-native context, and how they can be managed using a service mesh — in this case, Istio.
For more information on some of the Kubernetes topics covered here, please see the following resources:
- How to Set Up an Nginx Ingress with Cert-Manager on DigitalOcean Kubernetes.
- How To Set Up an Elasticsearch, Fluentd and Kibana (EFK) Logging Stack on Kubernetes.
- An Introduction to the Kubernetes DNS Service.
Additionally, the Kubernetes and Istio documentation hubs are great places to find detailed information about the topics discussed here.
Thanks for learning with the DigitalOcean Community. Check out our offerings for compute, storage, networking, and managed databases.
About the author
Former Developer at DigitalOcean community. Expertise in areas including Ubuntu, Docker, Ruby on Rails, Debian, and more.
Still looking for an answer?
This textbox defaults to using Markdown to format your answer.
You can type !ref in this text area to quickly search our full set of tutorials, documentation & marketplace offerings and insert the link!
 This work is licensed under a Creative Commons Attribution-NonCommercial- ShareAlike 4.0 International License.
Become a contributor for community
Get paid to write technical tutorials and select a tech-focused charity to receive a matching donation.

DigitalOcean Documentation
Full documentation for every DigitalOcean product.

Resources for startups and AI-native businesses
The Wave has everything you need to know about building a business, from raising funding to marketing your product.
The developer cloud
Scale up as you grow — whether you're running one virtual machine or ten thousand.

Start building today
From GPU-powered inference and Kubernetes to managed databases and storage, get everything you need to build, scale, and deploy intelligent applications.
