By Savic and Kathryn Hancox

The author selected the Free and Open Source Fund to receive a donation as part of the Write for DOnations program.
Introduction
Database monitoring is the continuous process of systematically tracking various metrics that show how the database is performing. By observing the performance data, you can gain valuable insights and identify possible bottlenecks, as well as find additional ways of improving database performance. Such systems often implement alerting, which notifies administrators when things go wrong. Gathered statistics can be used to not only improve the configuration and workflow of the database, but also those of client applications.
The benefit of using the Elastic Stack (ELK stack) for monitoring your managed database is its excellent support for searching and the ability to ingest new data very quickly. It does not excel at updating the data, but this trade-off is acceptable for monitoring and logging purposes, where past data is almost never changed. Elasticsearch offers a powerful means of querying the data, which you can use through Kibana to get a better understanding of how the database fares through different time periods. This will allow you to correlate database load with real-life events to gain insight into how the database is being used.
In this tutorial, you’ll import database metrics, generated by the PostgreSQL statistics collector, into Elasticsearch via Logstash. This entails configuring Logstash to pull data from the database using the PostgreSQL JDBC connector to send it to Elasticsearch for indexing immediately afterward. The imported data can later be analyzed and visualized in Kibana. Then, if your database is brand new, you’ll use pgbench, a PostgreSQL benchmarking tool, to create more interesting visualizations. In the end, you’ll have an automated system pulling in PostgreSQL statistics for later analysis.
Prerequisites
-
An Ubuntu 18.04 server with at least 8 GB RAM, root privileges, and a secondary, non-root account. You can set this up by following this initial server setup guide. For this tutorial, the non-root user is
sammy. -
Java 8 installed on your server. For installation instructions, visit How To Install Java with
apton Ubuntu 18.04. -
Nginx installed on your server. For a guide on how to do that, see How To Install Nginx on Ubuntu 18.04.
-
Elasticsearch and Kibana installed on your server. Complete the first two steps of the How To Install Elasticsearch, Logstash, and Kibana (Elastic Stack) on Ubuntu 18.04 tutorial.
-
A PostgreSQL 13 managed database provisioned from DigitalOcean with connection information available. Make sure that your server’s IP address is on the whitelist. For a guide on creating a PostgreSQL managed database using the DigitalOcean Control Panel, visit the PostgreSQL Quickstart guide.
Step 1 — Setting up Logstash and the PostgreSQL JDBC Driver
In this section, you will install Logstash and download the PostgreSQL JDBC driver so that Logstash will be able to connect to your managed database.
Begin by installing Logstash with the following command:
- sudo apt install logstash -y
Once Logstash is installed, enable the service to automatically start on boot:
- sudo systemctl enable logstash
Logstash is written in Java, so in order to connect to PostgreSQL it requires the PostgreSQL JDBC (Java Database Connectivity) library to be available on the system it is running on. Because of an internal limitation, Logstash will properly load the library only if it is found under the /usr/share/logstash/logstash-core/lib/jars directory, where it stores third-party libraries it uses.
Head over to the download page of the JDBC library and copy the link to latest version. Then, download it using curl by running the following command:
- sudo curl https://jdbc.postgresql.org/download/postgresql-42.3.3.jar -o /usr/share/logstash/logstash-core/lib/jars/postgresql-jdbc.jar
At the time of writing, the latest version of the library was 42.3.3, with Java 8 as the supported runtime version. Ensure you download the latest version; pairing it with the correct Java version that both JDBC and Logstash support. Logstash stores its configuration files under /etc/logstash/conf.d, and is itself stored under /usr/share/logstash/bin.
You’ve installed Logstash using apt and downloaded the PostgreSQL JDBC library so that Logstash can use it to connect to your managed database. In the next step, you will configure Logstash to pull statistical data from it.
Step 2 — Configuring Logstash To Pull Statistics
In this section, you will configure Logstash to pull metrics from your managed PostgreSQL database.
You’ll configure Logstash to watch over three system databases in PostgreSQL, namely:
pg_stat_database: provides statistics about each database, including its name, number of connections, transactions, rollbacks, rows returned by querying the database, deadlocks, and so on. It has astats_resetfield, which specifies when the statistics were last reset.pg_stat_user_tables: provides statistics about each table created by the user, such as the number of inserted, deleted, and updated rows.pg_stat_user_indexes: collects data about all indexes in user-created tables, such as the number of times a particular index has been scanned.
You’ll store the configuration for indexing PostgreSQL statistics in Elasticsearch in a file named postgresql.conf under the /etc/logstash/conf.d directory, where Logstash stores configuration files. When started as a service, it will automatically run them in the background.
Create postgresql.conf using your favorite editor (for example, nano):
- sudo nano /etc/logstash/conf.d/postgresql.conf
Add the following lines:
input {
        # pg_stat_database
        jdbc {
                jdbc_driver_library => ""
                jdbc_driver_class => "org.postgresql.Driver"
                jdbc_connection_string => "jdbc:postgresql://host:port/defaultdb"
                jdbc_user => "username"
                jdbc_password => "password"
                statement => "SELECT * FROM pg_stat_database"
                schedule => "* * * * *"
                type => "pg_stat_database"
        }

        # pg_stat_user_tables
        jdbc {
                jdbc_driver_library => ""
                jdbc_driver_class => "org.postgresql.Driver"
                jdbc_connection_string => "jdbc:postgresql://host:port/defaultdb"
                jdbc_user => "username"
                jdbc_password => "password"
                statement => "SELECT * FROM pg_stat_user_tables"
                schedule => "* * * * *"
                type => "pg_stat_user_tables"
        }

        # pg_stat_user_indexes
        jdbc {
                jdbc_driver_library => ""
                jdbc_driver_class => "org.postgresql.Driver"
                jdbc_connection_string => "jdbc:postgresql://host:port/defaultdb"
                jdbc_user => "username"
                jdbc_password => "password"
                statement => "SELECT * FROM pg_stat_user_indexes"
                schedule => "* * * * *"
                type => "pg_stat_user_indexes"
        }
}

output {
        elasticsearch {
                hosts => "http://localhost:9200"
                index => "%{type}"
        }
}
Remember to replace host with your host address, port with the port to which you can connect to your database, username with the database user username, and password with its password. All these values can be found in the Control Panel of your managed database.
In this configuration, you define three JDBC inputs and one Elasticsearch output. The three inputs pull data from the pg_stat_database, pg_stat_user_tables, and pg_stat_user_indexes databases, respectively. They all set the jdbc_driver_library parameter to an empty string, because the PostgreSQL JDBC library is in a folder that Logstash automatically loads.
Then, they set the jdbc_driver_class, whose value is specific to the JDBC library, and provide a jdbc_connection_string, which details how to connect to the database. The jdbc: part signifies that it is a JDBC connection, while postgres:// indicates that the target database is PostgreSQL. Next come the host and port of the database, and after the forward slash you also specify a database to connect to; this is because PostgreSQL requires you to be connected to a database to be able to issue any queries. Here, it is set to the default database that always exists and can not be deleted, aptly named defaultdb.
Next, they set a username and password of the user through which the database will be accessed. The statement parameter contains a SQL query that should return the data you wish to process—in this configuration, it selects all rows from the appropriate database.
The schedule parameter accepts a string in cron syntax that defines when Logstash should run this input; omitting it completely will make Logstash run it only once. Specifying * * * * *, as you have done so here, will tell Logstash to run it every minute. You can specify your own cron string if you want to collect data at different intervals.
There is only one output, which accepts data from three inputs. They all send data to Elasticsearch, which is running locally and is reachable at http://localhost:9200. The index parameter defines to which Elasticsearch index it will send the data, and its value is passed in from the type field of the input.
When you are done with editing, save and close the file.
You’ve configured Logstash to gather data from various PostgreSQL statistical tables and send them to Elasticsearch for storage and indexing. Next, you’ll run Logstash to test the configuration.
Step 3 — Testing the Logstash Configuration
In this section, you will test the configuration by running Logstash to verify it will properly pull the data. Then, you will make this configuration run in the background by configuring it as a Logstash pipeline.
Logstash supports running a specific configuration by passing its file path to the -f parameter. Run the following command to test your new configuration from the last step:
- sudo /usr/share/logstash/bin/logstash -f /etc/logstash/conf.d/postgresql.conf
It may take some time before it shows any output, which will look similar to this:
OutputUsing bundled JDK: /usr/share/logstash/jdk
OpenJDK 64-Bit Server VM warning: Option UseConcMarkSweepGC was deprecated in version 9.0 and will likely be removed in a future release.
WARNING: Could not find logstash.yml which is typically located in $LS_HOME/config or /etc/logstash. You can specify the path using --path.settings. Continuing using the defaults
Could not find log4j2 configuration at path /usr/share/logstash/config/log4j2.properties. Using default config which logs errors to the console
[INFO ] 2022-02-24 08:49:36.664 [main] runner - Starting Logstash {"logstash.version"=>"7.17.0", "jruby.version"=>"jruby 9.2.20.1 (2.5.8) 2021-11-30 2a2962fbd1 OpenJDK 64-Bit Server VM 11.0.13+8 on 11.0.13+8 +indy +jit [linux-x86_64]"}
[INFO ] 2022-02-24 08:49:36.671 [main] runner - JVM bootstrap flags: [-Xms1g, -Xmx1g, -XX:+UseConcMarkSweepGC, -XX:CMSInitiatingOccupancyFraction=75, -XX:+UseCMSInitiatingOccupancyOnly, -Djava.awt.headless=true, -Dfile.encoding=UTF-8, -Djruby.compile.invokedynamic=true, -Djruby.jit.threshold=0, -Djruby.regexp.interruptible=true, -XX:+HeapDumpOnOutOfMemoryError, -Djava.security.egd=file:/dev/urandom, -Dlog4j2.isThreadContextMapInheritable=true]
[INFO ] 2022-02-24 08:49:36.700 [main] settings - Creating directory {:setting=>"path.queue", :path=>"/usr/share/logstash/data/queue"}
[INFO ] 2022-02-24 08:49:36.710 [main] settings - Creating directory {:setting=>"path.dead_letter_queue", :path=>"/usr/share/logstash/data/dead_letter_queue"}
[WARN ] 2022-02-24 08:49:36.992 [LogStash::Runner] multilocal - Ignoring the 'pipelines.yml' file because modules or command line options are specified
[INFO ] 2022-02-24 08:49:37.018 [LogStash::Runner] agent - No persistent UUID file found. Generating new UUID {:uuid=>"bfd27cc5-f2d0-4b19-8870-a125586135ed", :path=>"/usr/share/logstash/data/uuid"}
[INFO ] 2022-02-24 08:49:38.085 [Api Webserver] agent - Successfully started Logstash API endpoint {:port=>9600, :ssl_enabled=>false}
[INFO ] 2022-02-24 08:49:39.284 [Converge PipelineAction::Create<main>] Reflections - Reflections took 68 ms to scan 1 urls, producing 119 keys and 417 values
...
[INFO ] 2022-02-24 08:50:03.102 [Ruby-0-Thread-34@[d39f109727b9e1a2b881639e708f21ce1d65378257869071cbed233a3946468d]<jdbc__scheduler_worker-00: /usr/share/logstash/vendor/bundle/jruby/2.5.0/gems/logstash-integration-jdbc-5.2.2/lib/logstash/plugin_mixins/jdbc/scheduler.rb:77] jdbc - (0.194969s) SELECT * FROM pg_stat_user_tables
[INFO ] 2022-02-24 08:50:03.104 [Ruby-0-Thread-32@[bd7d166b46e4ae8c53b4d498eaec7d53de881ea0f8a9bdfb08f574f9cbd3a4f6]<jdbc__scheduler_worker-00: /usr/share/logstash/vendor/bundle/jruby/2.5.0/gems/rufus-scheduler-3.0.9/lib/rufus/scheduler/jobs.rb:284] jdbc - (0.192893s) SELECT * FROM pg_stat_database
[INFO ] 2022-02-24 08:50:03.104 [Ruby-0-Thread-33@[fc2c0b0065c00ee9f942e75f35edf001a9e285c77ba7cf4ae127886e43c140fc]<jdbc__scheduler_worker-00: /usr/share/logstash/vendor/bundle/jruby/2.5.0/gems/rufus-scheduler-3.0.9/lib/rufus/scheduler/jobs.rb:284] jdbc - (0.197744s) SELECT * FROM pg_stat_user_indexes
...
If Logstash does not show any errors and logs that it has successfully SELECTed rows from the three databases, your database metrics will be shipped to Elasticsearch. If you get an error, double check all the values in the configuration file to ensure that the machine you’re running Logstash on can connect to the managed database.
Logstash will continue importing the data at specified times. You can safely stop it by pressing CTRL+C.
If you created a new database just for this tutorial, only one user (doadmin) should be present. This means that the pg_stat_user_tables and pg_stat_user_indexes tables will be empty (because no other users are present and have created tables) and won’t show up in Elasticsearch.
As previously mentioned, when started as a service, Logstash automatically runs all configuration files it finds under /etc/logstash/conf.d in the background. Run the following command to start it as a service:
- sudo systemctl start logstash
In this step, you ran Logstash to check if it can connect to your database and gather data. Next, you’ll visualize and explore some of the statistical data in Kibana.
Step 4 — Exploring Imported Data in Kibana
In this section, you’ll explore and visualize the statistical data describing your database’s performance in Kibana.
In your web browser, navigate to your domain where you exposed Kibana as a part of the prerequisite. You’ll see the default welcome page:
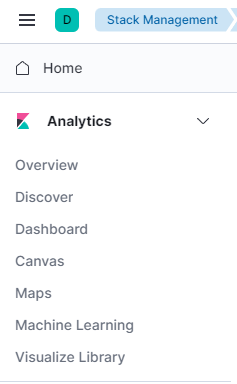
Before exploring the data Logstash is sending to Elasticsearch, you’ll first need to add the pg_stat_database index to Kibana. To do so, first press on Explore on my own, then open the hamburger menu in the upper left corner. Under Analytics, click on Discover.
Kibana will then prompt you to create a new index pattern:
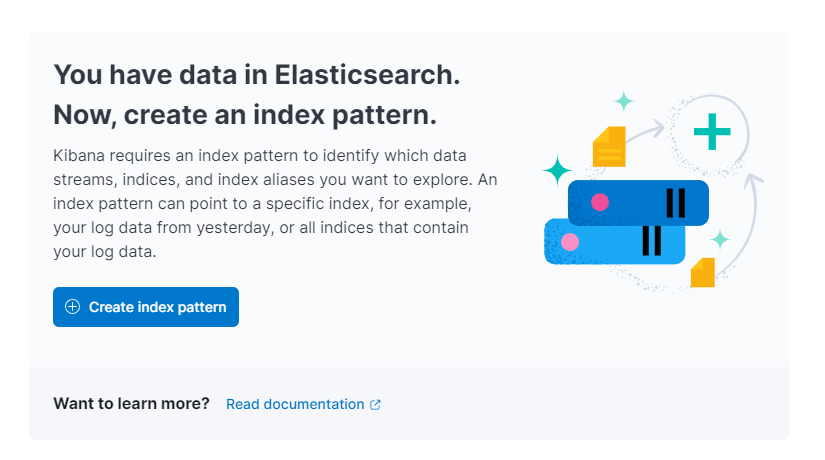
Press on Create index pattern. You’ll see a form for creating a new Index Pattern. Index Patterns in Kibana provide a way to pull in data from multiple Elasticsearch indexes at once, and can be used to explore only one index.
Listed on the right are the three indexes where Logstash has been sending statistics. Type in pg_stat_database in the Name text field and select @timestamp from the dropdown as the Timestamp field. When you’re done, press on the Create index pattern button below.
To create and see existing visualizations, open the hamburger menu. Under Analytics, select Dashboard. When it loads, click on Create new dashboard, then press on Create visualization to start creating a new one:
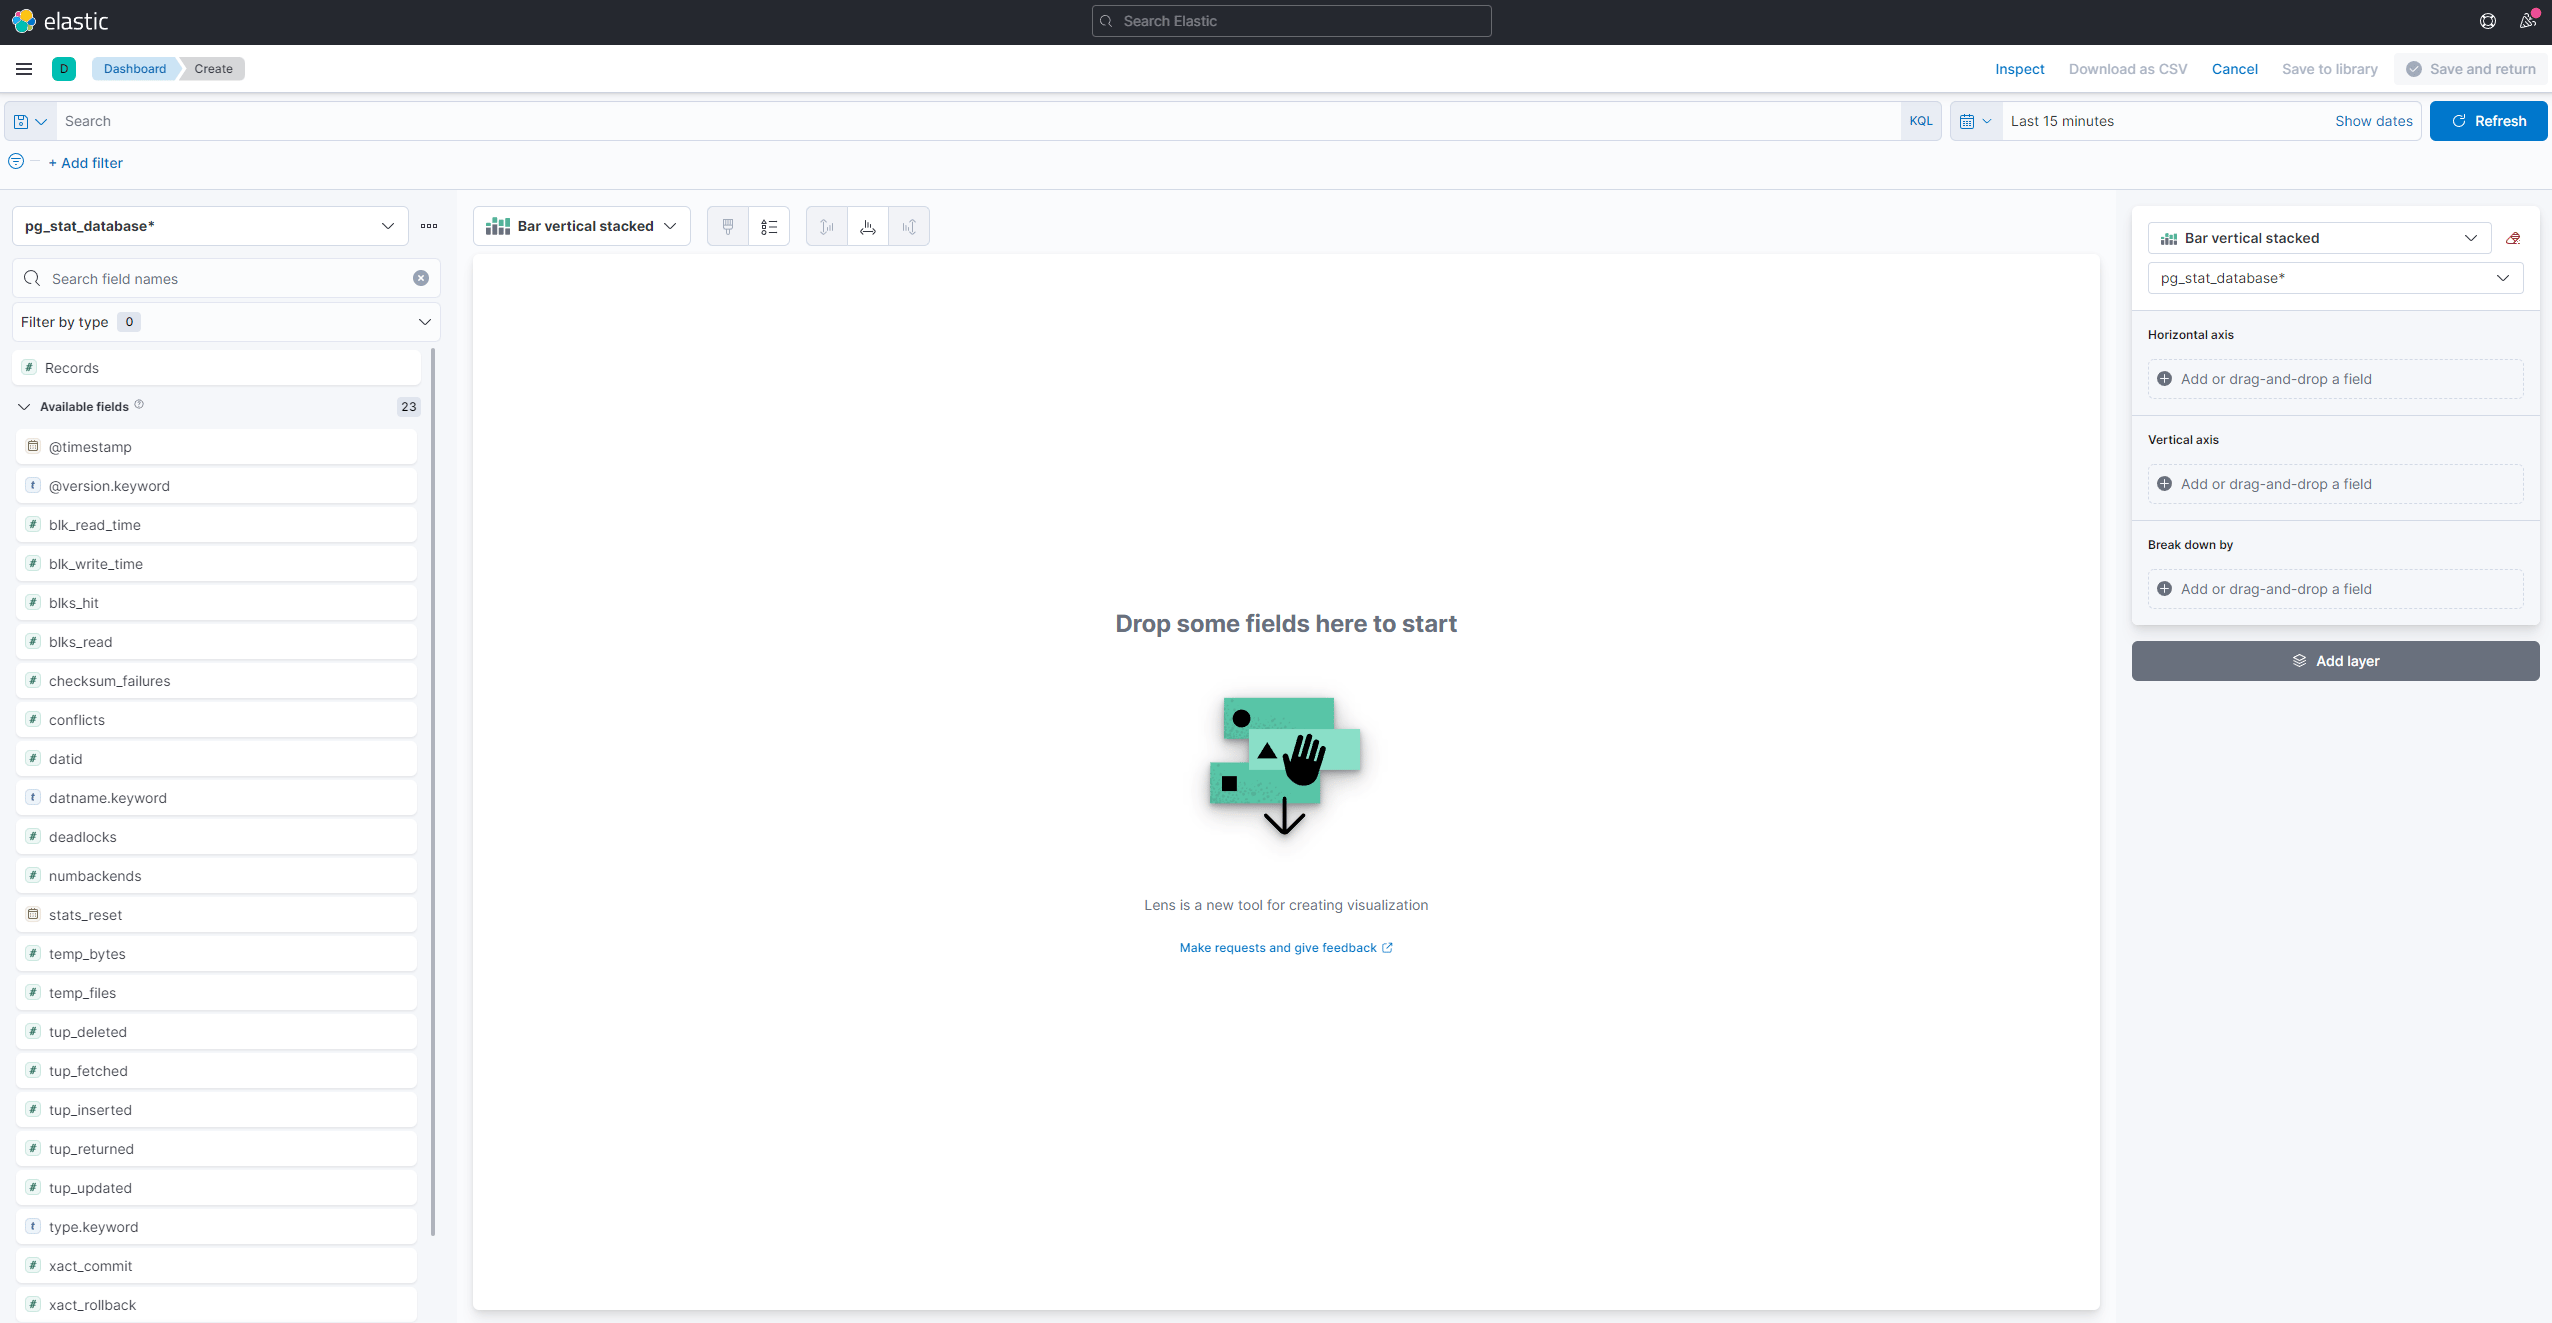
The left-side panel provides a list of values that Kibana can use to draw the visualization, which will be shown on the central part of the screen. On the upper-right hand side of the screen is the date range picker. If the @timestamp field is being used in the visualization, Kibana will only show the data belonging to the time interval specified in the range picker.
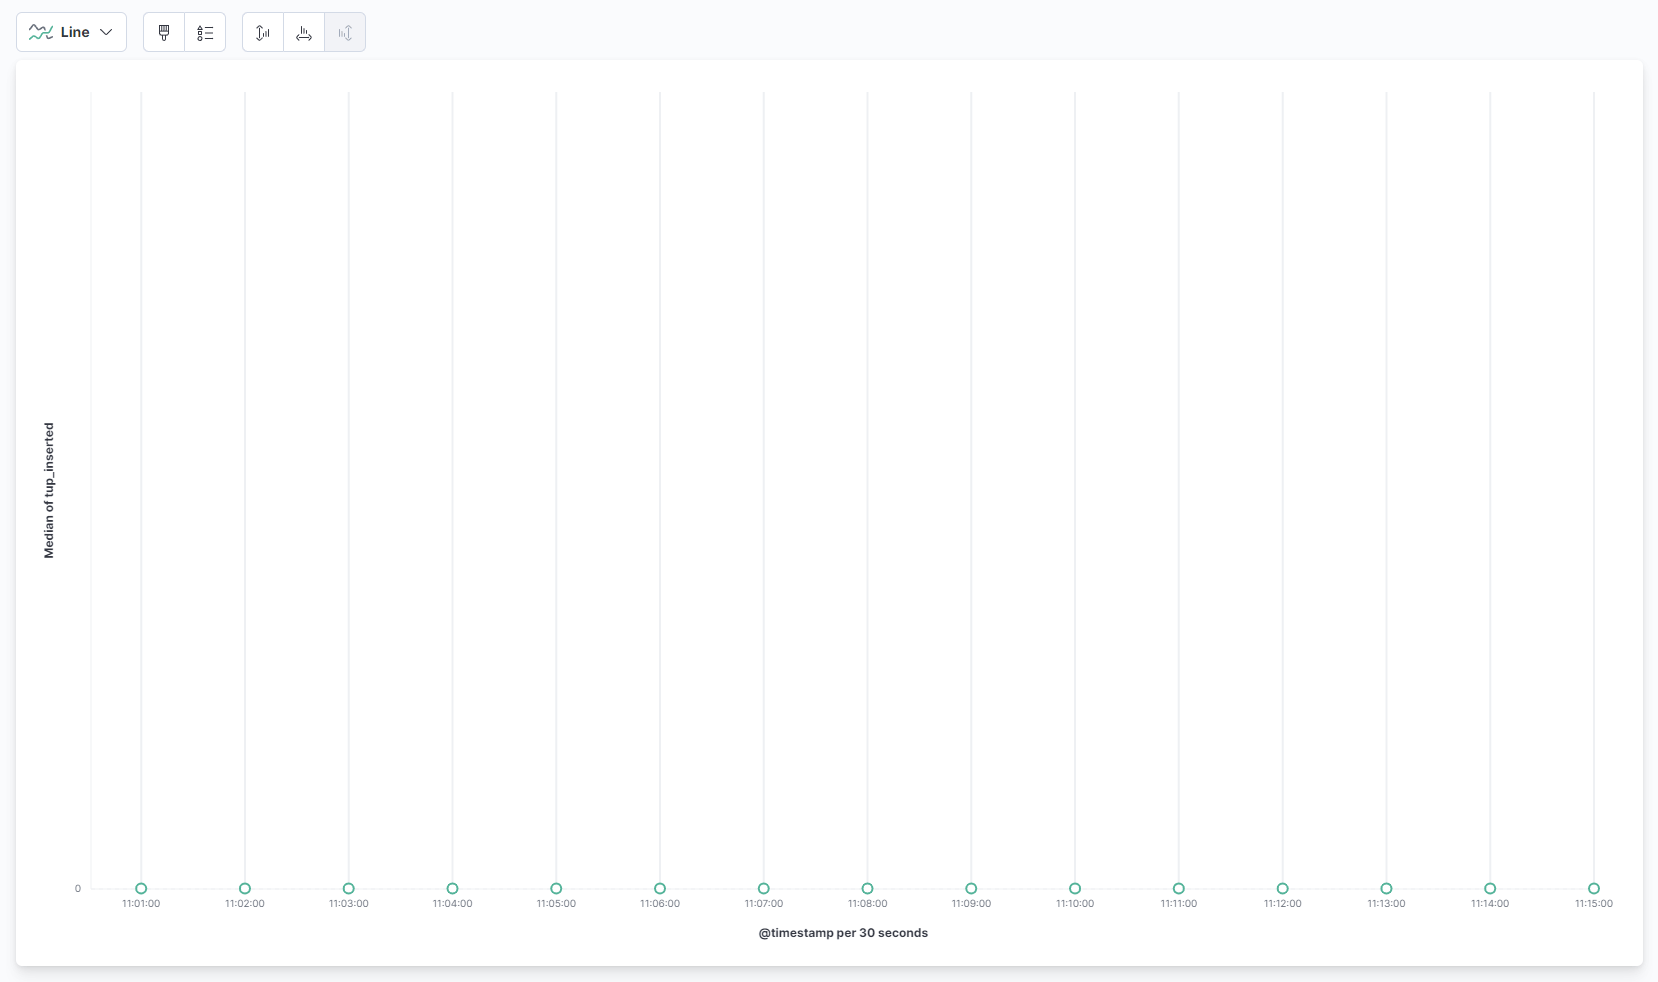
You’ll now visualize the average number of data tuples INSERTed on minutes in the given interval. From the dropdown in the main part of the page, select Line under the Line and area section. Then, find the tup_inserted field from the list on the left and drag it to the central part. You’ll soon see a line visualization of the median amount of INSERT queries through time. If your database is brand new and not used, you won’t see anything yet. In all cases, however, you will see an accurate portrayal of database usage:
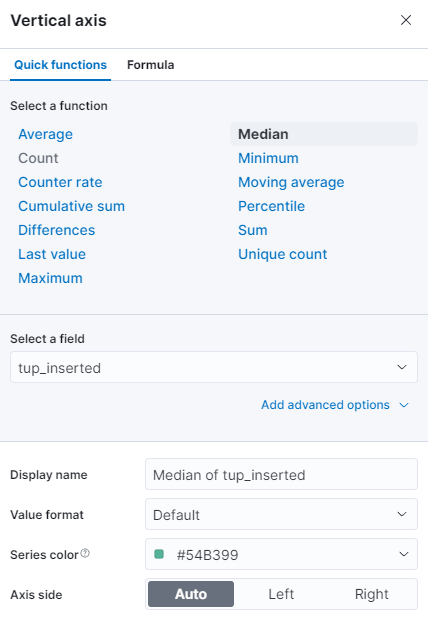
On the right side, you can configure how the horizontal and vertical axes are processed. There, you can set the vertical axis to show the Average value instead of Median by pressing on the shown axis:
You can select a different function, or supply your own:
The graph will be immediately refreshed with the updated values.
In this step, you have learned how to visualize some of the PostgreSQL statistical data using Kibana.
Step 5 — (Optional) Benchmarking Using pgbench
If you haven’t yet worked in your database outside of this tutorial, you can complete this step to create more interesting visualizations by using pgbench to benchmark your database. pgbench will run the same SQL commands over and over, simulating real-world database use by an actual client.
You’ll first need to install pgbench by running the following command:
- sudo apt install postgresql-contrib -y
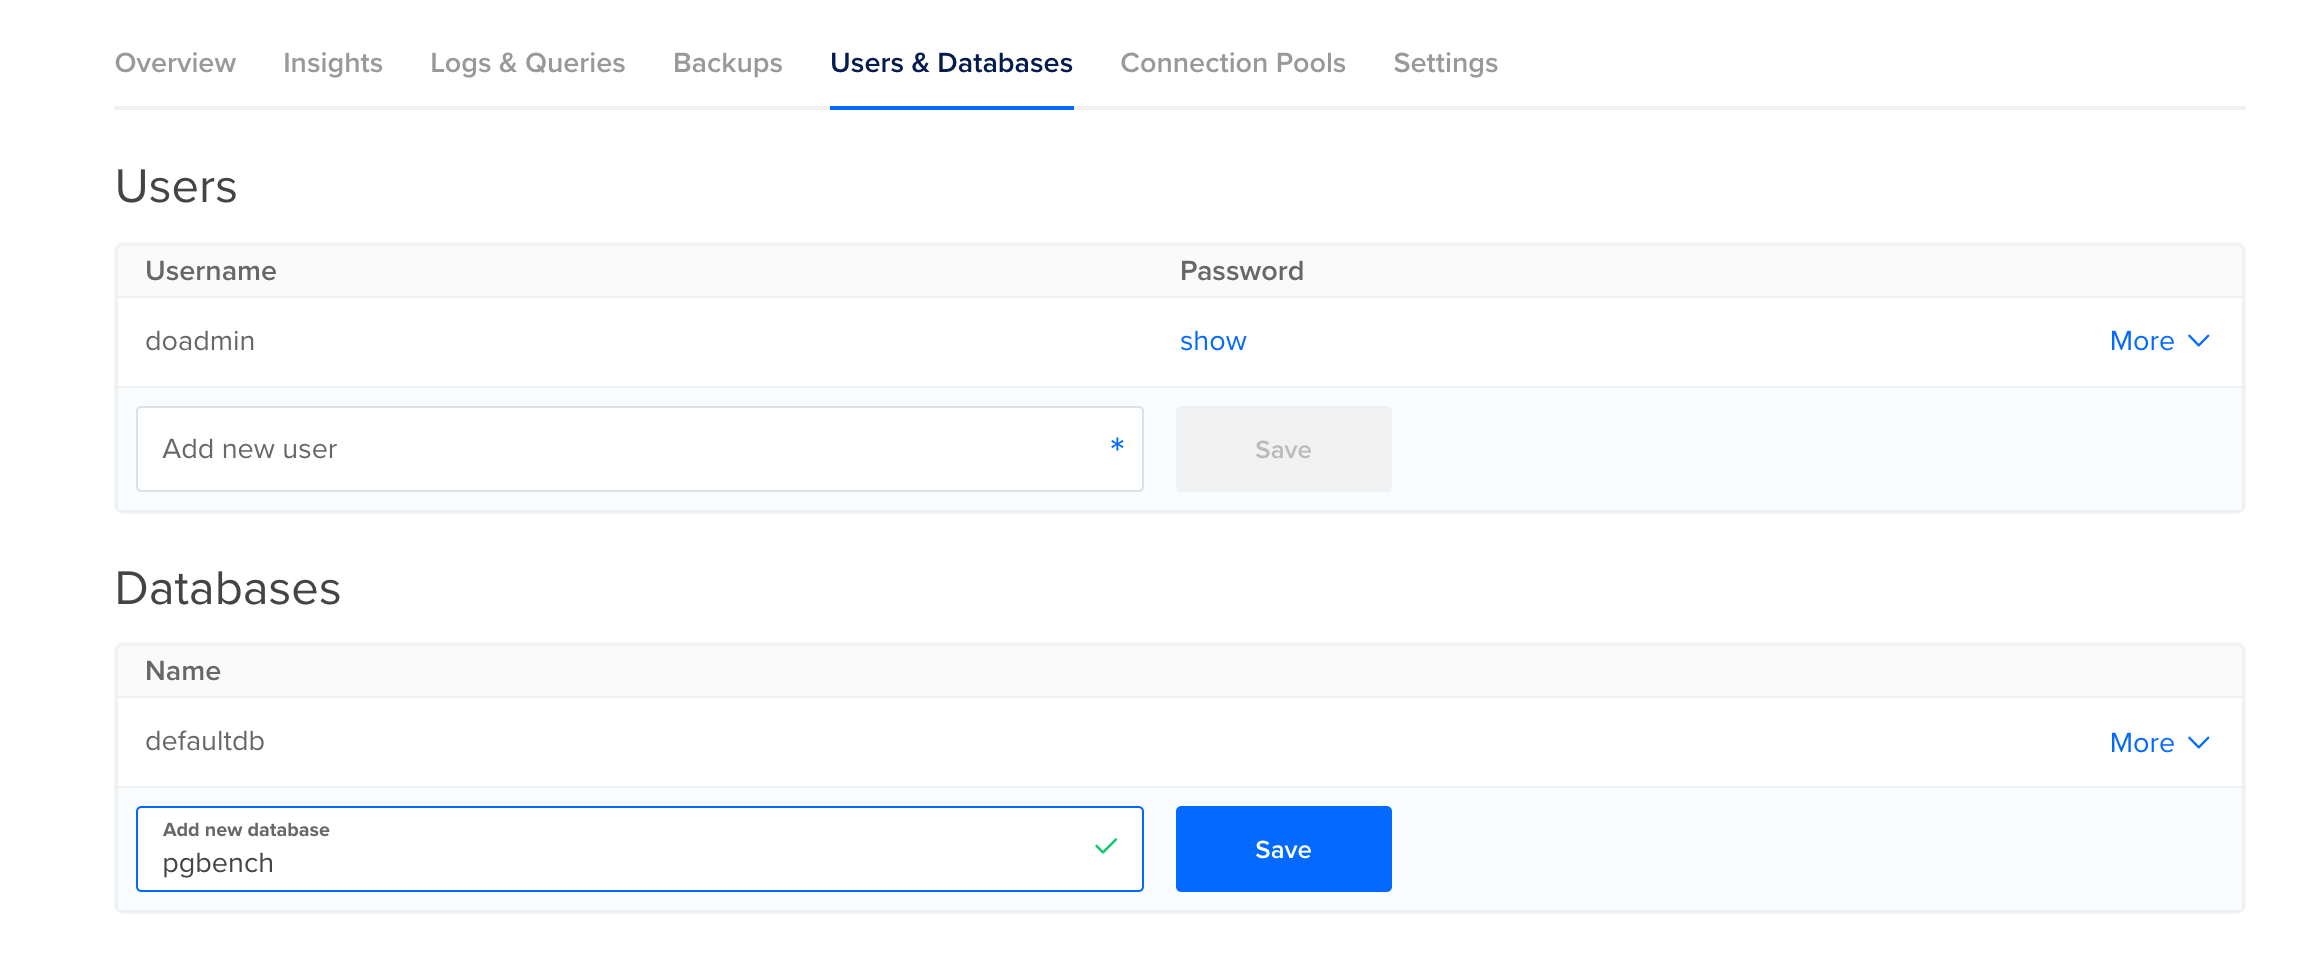
Because pgbench will insert and update test data, you’ll need to create a separate database for it. To do so, head over to the Users & Databases tab in the Control Panel of your managed database, and scroll down to the Databases section. Type in pgbench as the name of the new database, and then press on Save. You’ll pass this name, as well as the host, port, and username information to pgbench.
Before actually running pgbench, you’ll need to run it with the -i flag to initialize its database:
- pgbench -h host -p port -U username -i pgbench
You’ll need to replace host with your host address, port with the port to which you can connect to your database, and username with the database user username. You can find all these values in the Control Panel of your managed database.
Notice that pgbench does not have a password argument; instead, you’ll be asked for it every time you run it.
The output will look like the following:
OutputNOTICE:  table "pgbench_history" does not exist, skipping
NOTICE:  table "pgbench_tellers" does not exist, skipping
NOTICE:  table "pgbench_accounts" does not exist, skipping
NOTICE:  table "pgbench_branches" does not exist, skipping
creating tables...
100000 of 100000 tuples (100%) done (elapsed 0.16 s, remaining 0.00 s)
vacuum...
set primary keys...
done.
pgbench created four tables, which it will use for benchmarking, and populated them with some example rows. You’ll now be able to run benchmarks.
The two most important arguments that limit how long the benchmark will run are -t, which specifies the number of transactions to complete, and -T, which defines how many seconds the benchmark should run for. These two options are mutually exclusive. At the end of each benchmark, you’ll receive statistics, such as the number of transactions per second (tps).
Now, start a benchmark that will last for 30 seconds by running the following command:
- pgbench -h host -p port -U username pgbench -T 30
The output will look similar to this:
Outputstarting vacuum...end.
transaction type: <builtin: TPC-B (sort of)>
scaling factor: 1
query mode: simple
number of clients: 1
number of threads: 1
duration: 30 s
number of transactions actually processed: 11991
latency average = 2.502 ms
tps = 399.664353 (including connections establishing)
tps = 399.987202 (excluding connections establishing)
In this output, you see the general info about the benchmark, such as the total number of transactions executed. The effect of these benchmarks is that the statistics Logstash ships to Elasticsearch will reflect that number, which will in turn make visualizations in Kibana more interesting and closer to real-world graphs. You can run the preceding command a few more times, and possibly alter the duration.
When you are done, head over to Kibana and press on Refresh in the upper right corner. You’ll now see a different line than before, which shows the number of INSERTs. Feel free to change the time range of the data shown by changing the values in the picker positioned above the refresh button. Here is how the graph may look after multiple benchmarks of varying duration:
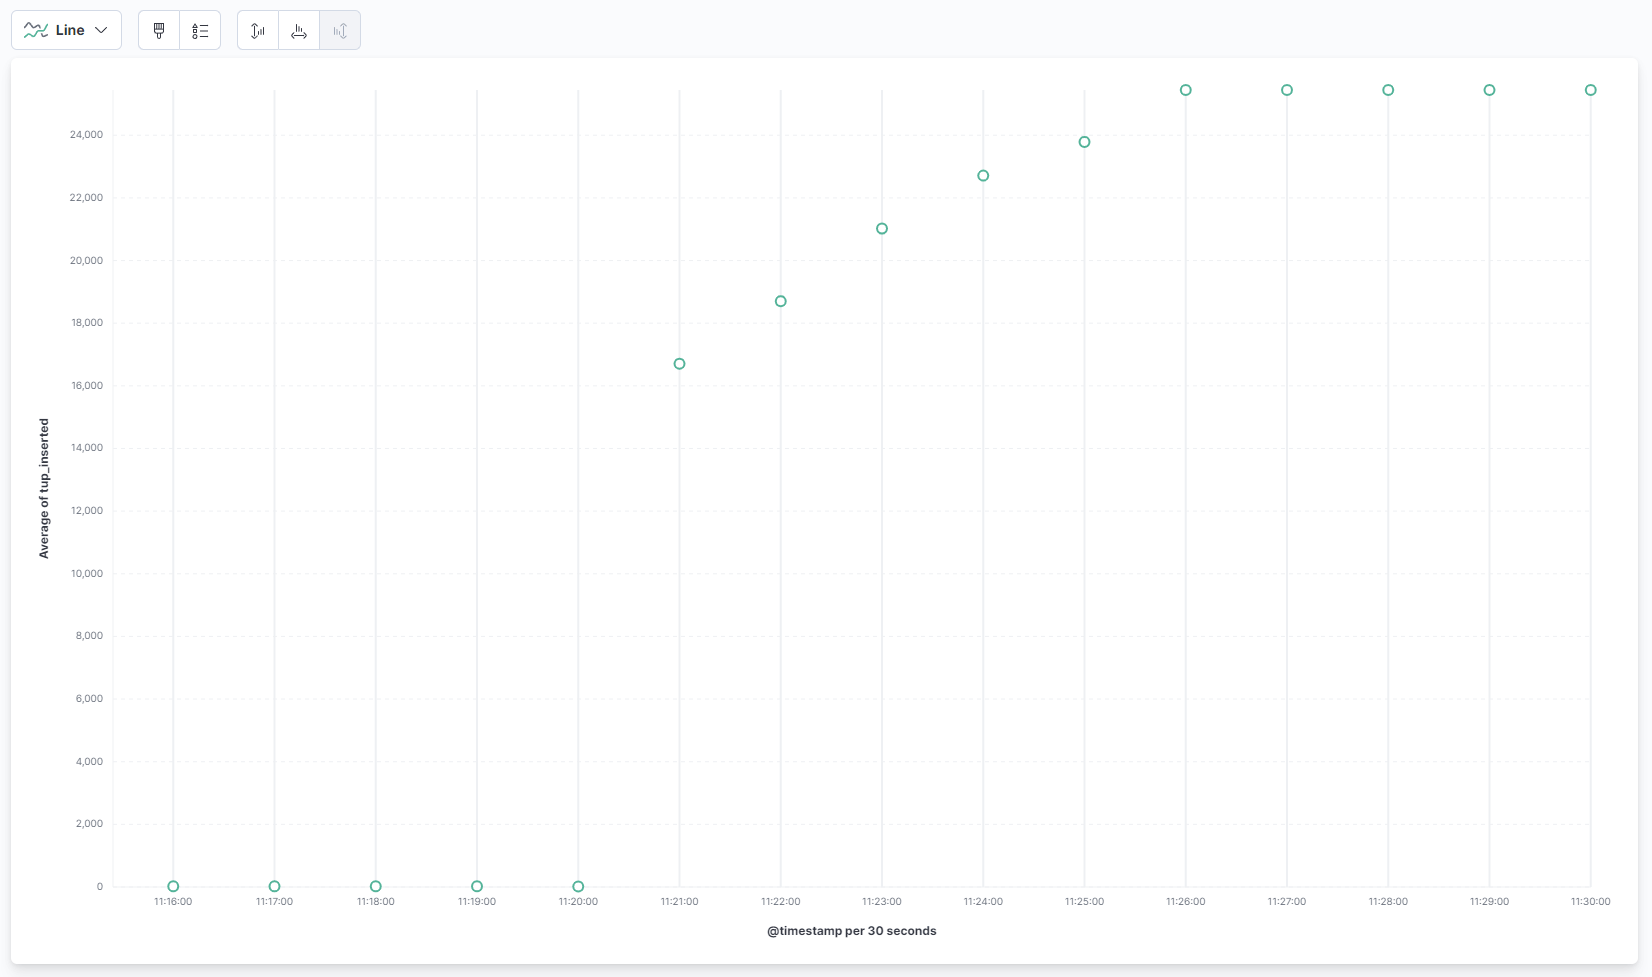
You’ve used pgbench to benchmark your database, and evaluated the resulting graphs in Kibana.
Conclusion
You now have the Elastic stack installed on your server and configured to pull statistics data from your managed PostgreSQL database on a regular basis. You can analyze and visualize the data using Kibana, or some other suitable software, which will help you gather valuable insights about and real-world correlations into how your database is performing.
For more information about what you can do with your PostgreSQL Managed Database, visit the product docs.
Thanks for learning with the DigitalOcean Community. Check out our offerings for compute, storage, networking, and managed databases.
About the author(s)
Expert in cloud topics including Kafka, Kubernetes, and Ubuntu.
Former Senior Technical Editor at DigitalOcean, with a strong focus on DevOps and System Administration content. Areas of expertise include Terraform, PyTorch, Python, and Django.
Still looking for an answer?
This textbox defaults to using Markdown to format your answer.
You can type !ref in this text area to quickly search our full set of tutorials, documentation & marketplace offerings and insert the link!
 This work is licensed under a Creative Commons Attribution-NonCommercial- ShareAlike 4.0 International License.
Become a contributor for community
Get paid to write technical tutorials and select a tech-focused charity to receive a matching donation.

DigitalOcean Documentation
Full documentation for every DigitalOcean product.

Resources for startups and AI-native businesses
The Wave has everything you need to know about building a business, from raising funding to marketing your product.
The developer cloud
Scale up as you grow — whether you're running one virtual machine or ten thousand.

Start building today
From GPU-powered inference and Kubernetes to managed databases and storage, get everything you need to build, scale, and deploy intelligent applications.
