
Status: Deprecated
This article covers a version of CentOS that is no longer supported. If you are currently operating a server running CentOS 6, we highly recommend upgrading or migrating to a supported version of CentOS.
Reason: CentOS 6 reached end of life (EOL) on November 30th, 2020 and no longer receives security patches or updates. For this reason, this guide is no longer maintained.
See Instead:
This guide might still be useful as a reference, but may not work on other CentOS releases. If available, we strongly recommend using a guide written for the version of CentOS you are using.
The following DigitalOcean tutorial may be of immediate interest, as it outlines installing Nagios on a CentOS 7 server:
Step 1 - Install Packages on Monitoring Server
rpm -Uvh http://dl.fedoraproject.org/pub/epel/6/x86_64/epel-release-6-8.noarch.rpm
rpm -Uvh http://rpms.famillecollet.com/enterprise/remi-release-6.rpm
yum -y install nagios nagios-plugins-all nagios-plugins-nrpe nrpe php httpd
chkconfig httpd on && chkconfig nagios on
service httpd start && service nagios start
We should also enable SWAP memory on this droplet, at least 2GB:
dd if=/dev/zero of=/swap bs=1024 count=2097152
mkswap /swap && chown root. /swap && chmod 0600 /swap && swapon /swap
echo /swap swap swap defaults 0 0 >> /etc/fstab
echo vm.swappiness = 0 >> /etc/sysctl.conf && sysctl -p
Step 2 - Set Password Protection
Set Nagios Admin Panel Password:
htpasswd -c /etc/nagios/passwd nagiosadmin

Make sure to keep this username as "nagiosadmin" - otherwise you would have to change /etc/nagios/cgi.cfg and redefine authorized admin.
Now you can navigate over to your droplet's IP address http://IP/nagios and login.
You will be prompted for password you set in Step 2:

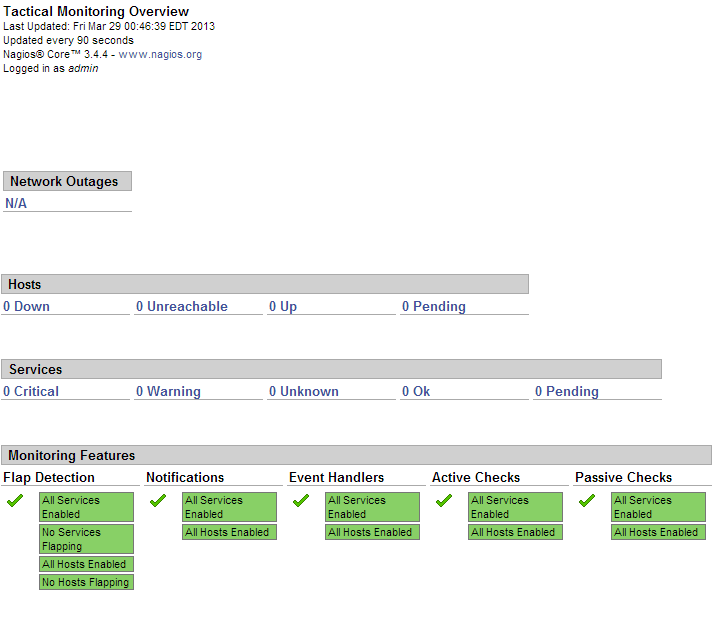
This is what the Nagios admin panel looks like:

Since this is a fresh installation, we don't have any hosts currently being monitored.
Now we should add our hosts that will be monitored by Nagios. For example, we will use cloudmail.tk (198.211.107.218) and emailocean.tk (198.211.112.99).
From public ports, we can monitor ping, any open ports such as webserver, e-mail server, etc.
For internal services that are listening on localhost, such as MySQL, memcached, system services, we will need to use NRPE.
Step 4 - Install NRPE on Clients
rpm -Uvh http://dl.fedoraproject.org/pub/epel/6/x86_64/epel-release-6-8.noarch.rpm
rpm -Uvh http://rpms.famillecollet.com/enterprise/remi-release-6.rpm
yum -y install nagios nagios-plugins-all nrpe
chkconfig nrpe on
This next step is where you get to specify any manual commands that Monitoring server can send via NRPE to these client hosts.
Make sure to change allowed_hosts to your own values.
Edit /etc/nagios/nrpe.cfg
log_facility=daemon
pid_file=/var/run/nrpe/nrpe.pid
server_port=5666
nrpe_user=nrpe
nrpe_group=nrpe
allowed_hosts=198.211.117.251
dont_blame_nrpe=1
debug=0
command_timeout=60
connection_timeout=300
include_dir=/etc/nrpe.d/
command[check_users]=/usr/lib64/nagios/plugins/check_users -w 5 -c 10
command[check_load]=/usr/lib64/nagios/plugins/check_load -w 15,10,5 -c 30,25,20
command[check_disk]=/usr/lib64/nagios/plugins/check_disk -w 20% -c 10% -p /dev/vda
command[check_zombie_procs]=/usr/lib64/nagios/plugins/check_procs -w 5 -c 10 -s Z
command[check_total_procs]=/usr/lib64/nagios/plugins/check_procs -w 150 -c 200
command[check_procs]=/usr/lib64/nagios/plugins/check_procs -w $ARG1$ -c $ARG2$ -s $ARG3$
Note:
In check_disk above, the partition being checked is /dev/vda - make sure your droplet has the same partition by running df -h / You can also modify when to trigger warnings or critical alerts - above configuration sets Warning at 20% free disk space remaining, and Critical alert at 10% free space remaining.
We should also setup firewall rules to allow connections from our Monitoring server to those clients and drop everyone else:
iptables -N NRPE
iptables -I INPUT -s 0/0 -p tcp --dport 5666 -j NRPE
iptables -I NRPE -s 198.211.117.251 -j ACCEPT
iptables -A NRPE -s 0/0 -j DROP
/etc/init.d/iptables save
Now you can start NRPE on all of your client hosts:
service nrpe start
Step 5 - Add Server Configurations on Monitoring Server
Back on our Monitoring server, we will have to create config files for each of our client servers:
echo "cfg_dir=/etc/nagios/servers" >> /etc/nagios/nagios.cfg
cd /etc/nagios/servers
touch cloudmail.tk.cfg
touch emailocean.tk.cfg
Edit each client's configuration file and define which services you would like monitored.
nano /etc/nagios/servers/cloudmail.tk.cfg
Add the following lines:
define host {
        use                     linux-server
        host_name               cloudmail.tk
        alias                   cloudmail.tk
        address                 198.211.107.218
        }

define service {
        use                             generic-service
        host_name                       cloudmail.tk
        service_description             PING
        check_command                   check_ping!100.0,20%!500.0,60%
        }

define service {
        use                             generic-service
        host_name                       cloudmail.tk
        service_description             SSH
        check_command                   check_ssh
        notifications_enabled           0
        }

define service {
        use                             generic-service
        host_name                       cloudmail.tk
        service_description             Current Load
        check_command                   check_local_load!5.0,4.0,3.0!10.0,6.0,4.0
        }
You can add more services to be monitored as desired. Same configuration should be added for second client, emailocean.tk, with different IP address and host_name:
This is a snippet of /etc/nagios/servers/emailocean.tk.cfg:
define host {
        use                     linux-server
        host_name               emailocean.tk
        alias                   emailocean.tk
        address                 198.211.112.99
        }

...
You can add additional clients to be monitored as /etc/nagios/servers/AnotherHostName.cfg
Finally, after you are done adding all the client configurations, you should set folder permissions correctly and restart Nagios on your Monitoring Server:
chown -R nagios. /etc/nagios
service nagios restart
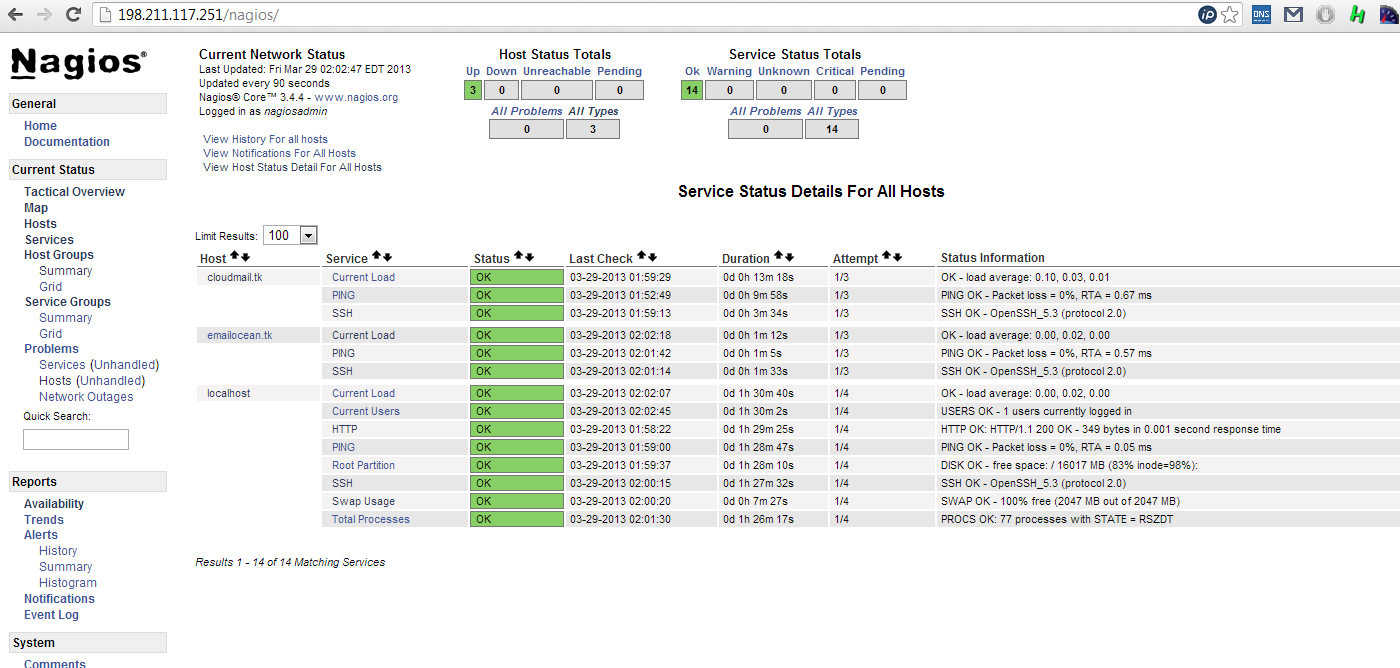
Step 6 - Monitor Hosts in Nagios
Navigate over to your Monitoring Server's IP address http://IP/nagios and enter password set in Step 2.
Now you should be able to see all the hosts and services:
And you are all done!
Thanks for learning with the DigitalOcean Community. Check out our offerings for compute, storage, networking, and managed databases.
About the author
Still looking for an answer?
This textbox defaults to using Markdown to format your answer.
You can type !ref in this text area to quickly search our full set of tutorials, documentation & marketplace offerings and insert the link!
Hi, i followed your how to and did same, but still i am unable to see remote hosts status. I am not using NRPE for remost host, just using check-host-alive … just like checking www.google.com host alive or not I wonder why the status is pending and says host not checked yet I m using Nagios Version 2.12 on Centos 5.9 … Hope you will help me to fix my problem.
My localhost shows that the HTTP service is refusing connection, HTTP CRITICAL - Unable to open TCP socket. I’ve even disabled the firewall completely with the same results. I’m running CentOS 6.3 64-bit and Nagios 3.5. I followed your instructions on installing Nagios using yum. I’m able to login to the Nagios server from a remote computer without issue.
I’m able to create hosts and service definitions without issue.
Hey this helped me a lot! I could finally add my hosts and they show up at the GUI. Thank you very much for this tutorial!
Awesome!!!
Been struggling to get this installed, but your tut worked like a charm! Thanks so much for a well documented installation.
I have one question though.
I now have Nagios® Core™ Version 3.5.0 installed. Q) How o i update it to the latest release? Version 3.5.1 as per this release http://rpmfind.net//linux/RPM/fedora/devel/rawhide/src/n/nagios-3.5.1-1.fc21.src.html
Please can you help supply a complimentary upgrade tut? That would be really appreciated.
@warren: The EPEL Repo still has 3.5.1 in testing. It’ll be merged with stable soon so you can just periodically run ‘yum update’ and it should be updated when the update is up :]
@edash: I believe you will have to compile Nagios 4 yourself as it’s not published to the repos yet: <a href=“https://raymii.org/s/tutorials/Nagios_Core_4_Installation_on_Ubuntu_12.04.html”>https://raymii.org/s/tutorials/Nagios_Core_4_Installation_on_Ubuntu_12.04.html</a>
Why do we need to add Remi’s repositories? What do they get us? I see this other tutorial http://sharadchhetri.com/2013/05/19/installing-nagios-3-5-0-in-centos-6-4-using-yum/ doesn’t use them.
 This work is licensed under a Creative Commons Attribution-NonCommercial- ShareAlike 4.0 International License.
Become a contributor for community
Get paid to write technical tutorials and select a tech-focused charity to receive a matching donation.

DigitalOcean Documentation
Full documentation for every DigitalOcean product.

Resources for startups and AI-native businesses
The Wave has everything you need to know about building a business, from raising funding to marketing your product.
The developer cloud
Scale up as you grow — whether you're running one virtual machine or ten thousand.

Start building today
From GPU-powered inference and Kubernetes to managed databases and storage, get everything you need to build, scale, and deploy intelligent applications.
