By Julius Volz and Tammy Fox

An Article from Prometheus co-creator Julius Volz
Introduction
Prometheus is an open source monitoring system and time series database. It addresses many aspects of monitoring such as the generation and collection of metrics, graphing the resulting data on dashboards, and alerting on anomalies. To achieve this, it offers a variety of components that are run separately but used in combination.
Docker provides a way for you to encapsulate server processes using Linux containers (or other encapsulation technologies) so that they are more easily managed and isolated from each other. To learn more about Docker, see The Docker Ecosystem: An Introduction to Common Components.
In this tutorial, we will learn how to install three key components for using Prometheus on Docker. These are:
- A Prometheus server to collect metrics and query them
- A Node Exporter to export system metrics in a Prometheus-compatible format
- Grafana, a web-based graphical dashboard builder that supports Prometheus among other backends
There are many more components in the Prometheus ecosystem, but these three provide a good starting point for using Prometheus.
Prerequisites
To follow this tutorial, you will need:
- CentOS 7.1 Droplet
- User with
sudoaccess (see the Initial Server Setup with CentOS 7 tutorial for details) - Docker installed with the instructions from Step 1 of How To Install and Use Docker Compose on CentOS 7
Note: This article has been tested on a 1 CPU/512 MB RAM CentOS 7.1 Droplet. The Prometheus configuration should be adjusted for different amounts of available resources as stated in Step 2 of this article.
Step 1 — Installing Prometheus
This section will explain how to install the main Prometheus server using Docker. Make sure to install Docker per the Prerequisites section before continuing. The Prometheus server is the central piece of the Prometheus ecosystem and is responsible for collecting and storing metrics as well as processing expression queries and generating alerts.
Docker container images for all Prometheus components are hosted under the prom organization on Docker Hub. Running the prom/prometheus Docker image without any further options starts the Prometheus server with an example configuration file located at /etc/prometheus/prometheus.yml inside the container. It also uses a Docker data volume mounted at /prometheus inside the container to store collected metrics data. This data volume directory is actually a directory on the host which Docker auto-creates when the container is first started. The data inside it is persisted between restarts of the same container.
There are multiple ways for overriding the default configuration file. For example, a custom configuration file may be passed into the container from the host filesystem as a Docker data volume, or you could choose to build a derived Docker container with your own configuration file baked into the container image. In this tutorial, we will choose to pass in a configuration file from the host system.
There are different patterns for organizing the storage of metrics as well. In this tutorial, we will use the Docker image’s default behavior of using a Docker data volume to store the metrics. You may alternatively consider creating a data volume container if that suits your needs better.
Note: To learn how to create a Docker data volume, read How To Work with Docker Data Volumes on Ubuntu 14.04 (the relevant parts of this article are not Ubuntu-specific).
First, create a minimal Prometheus configuration file on the host filesystem at ~/prometheus.yml:
- nano ~/prometheus.yml
Add the following contents to the file (replace your_server_ip with your Droplet’s IP address):
# A scrape configuration scraping a Node Exporter and the Prometheus server
# itself.
scrape_configs:
  # Scrape Prometheus itself every 5 seconds.
  - job_name: 'prometheus'
    scrape_interval: 5s
    target_groups:
      - targets: ['localhost:9090']

  # Scrape the Node Exporter every 5 seconds.
  - job_name: 'node'
    scrape_interval: 5s
    target_groups:
      - targets: ['your_server_ip:9100']
This example configuration makes Prometheus scrape metrics from itself (since Prometheus also exposes metrics about itself in a Prometheus-compatible format) as well as from a Node Exporter, which we will set up later. While Prometheus can connect to itself within its container using the localhost host name, it will need to scrape the Node Exporter using your server’s external IP since the Node Exporter will run in a separate container with a separate networking namespace.
Start the Prometheus Docker container with the external configuration file:
- docker run -d -p 9090:9090 -v ~/prometheus.yml:/etc/prometheus/prometheus.yml prom/prometheus -config.file=/etc/prometheus/prometheus.yml -storage.local.path=/prometheus -storage.local.memory-chunks=10000
The first time you run this command, it will pull the Docker image from the Docker Hub.
This command is quite long and contains many command line options. Let’s take a look at it in more detail:
- The
-doption starts the Prometheus container in detached mode, meaning that the container will be started in the background and will not be terminated by pressingCTRL+C. - The
-p 9090:9090option exposes Prometheus’s web port (9090) and makes it reachable via the external IP address of the host system. - The
-v [...]option mounts theprometheus.ymlconfiguration file from the host filesystem into the location within the container where Prometheus expects it (/etc/prometheus/prometheus.yml). - The
-config.fileoption is set accordingly to the location of the Prometheus configuration file within in the container. - The
-storage.local.pathoption configures the metrics storage location within the container. - Finally, the
-storage.local.memory-chunksoption adjusts Prometheus’s memory usage to the host system’s very small amount of RAM (only 512MB) and small number of stored time series in this tutorial (just under 1000). It instructs Prometheus to keep only 10000 sample chunks in memory (roughly 10 chunks per series), instead of the default of 1048576. This is a value you will definitely need to tune when running Prometheus on a machine with more RAM and when storing more time series. Refer to Prometheus’s storage documentation for more details around this.
You can list all running Docker containers using the following command:
- docker ps
For example, you will see something similar to the following for the Prometheus Docker container:
Output of `docker ps`CONTAINER ID        IMAGE                COMMAND                  CREATED             STATUS              PORTS                    NAMES
6a89ac39911e        prom/prometheus      "/bin/prometheus -con"   2 hours ago         Up 2 hours          0.0.0.0:9090->9090/tcp   stoic_pike
Using the container ID shown in the docker ps output, you may inspect the logs of the running Prometheus server with the command:
- docker logs container_id
In our example, the command would be:
- docker logs 6a89ac39911e
To find out where on the host’s filesystem the metrics storage volume is stored, you can run the following with your container_id:
- docker inspect container_id
This will output information about your container’s configuration, including host paths of any mounted Docker volumes.
Find a section in the output that looks similar to this:
Output of `docker inspect ...`...
"Mounts": [
    {
        "Source": "/home/sammy/prometheus.yml",
        "Destination": "/etc/prometheus/prometheus.yml",
        "Mode": "",
        "RW": true
    },
    {
        "Name": "821b0abc470a9c758ff35ed5cff69077423a629566082a605a01d8207d57cd6c",
        "Source": "/var/lib/docker/volumes/821b0abc470a9c758ff35ed5cff69077423a629566082a605a01d8207d57cd6c/_data",
        "Destination": "/prometheus",
        "Driver": "local",
        "Mode": "",
        "RW": true
    }
],
...
In this example, the metrics are stored in /var/lib/docker/volumes/821b0abc470a9c758ff35ed5cff69077423a629566082a605a01d8207d57cd6c/_data on the host system. This directory was automatically created by Docker when first starting the Prometheus container. It is mapped into the /prometheus directory in the container. Data in this directory is persisted across restarts of the same container. If you prefer, you may also mount an existing host directory for storing metrics data. See How To Work with Docker Data Volumes on Ubuntu 14.04 for how to achieve this. This article is written for Ubuntu 14.04, but the docker commands and configuration files are the same on CentOS 7.
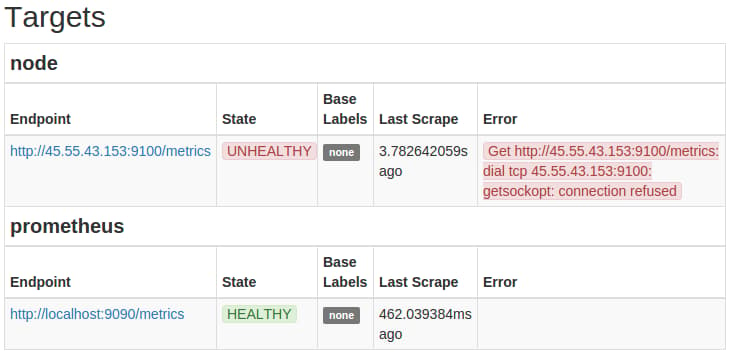
You should now be able to reach your Prometheus server at http://your_server_ip:9090/. Verify that it is collecting metrics about itself by heading to http://your_server_ip:9090/status and locating the http://localhost:9090/metrics endpoint for the prometheus job in the Targets section. The State column for this target should show the the target’s state as HEALTHY. In contrast, the http://localhost:9100/metrics (Node Exporter) endpoint should still show up as UNHEALTHY since the Node Exporter has not yet been started and thus cannot be scraped:
To summarize, you now have Prometheus running as a Docker container using the custom Prometheus configuration file ~/prometheus.yml, which is located on the host filesystem. The metrics storage is located in the /prometheus directory in the container, which is backed on the host system by the path shown by the docker inspect command explained in this section.
Step 2 — Setting up Node Exporter
In this section, we will install the Prometheus Node Exporter. The Node Exporter is a server that exposes Prometheus metrics about the host machine (node) it is running on. This includes metrics about the machine’s filesystems, networking devices, processor usage, memory usage, and more.
Note that running the Node Exporter on Docker poses some challenges since its entire purpose is to expose metrics about the host it is running on. If we run it on Docker without further options, Docker’s namespacing of resources such as the filesystem and the network devices will cause it to only export metrics about the container’s environment, which will differ from the host’s environment. Thus it is usually recommended to run the Node Exporter directly on the host system outside of Docker. However, if you have a requirement to manage all your processes using Docker, we will describe a workaround which provides a reasonable approximation for exporting host metrics from within Docker.
To start the Node Exporter on port 9100 using Docker:
- docker run -d -p 9100:9100 -v "/proc:/host/proc" -v "/sys:/host/sys" -v "/:/rootfs" --net="host" prom/node-exporter -collector.procfs /host/proc -collector.sysfs /host/proc -collector.filesystem.ignored-mount-points "^/(sys|proc|dev|host|etc)($|/)"
The following Docker and Node Exporter flags are used to provide a reasonable approximation for the host metrics:
- On Linux, the Node Exporter gathers most of its metrics from the
/procand/sysfilesystems. These filesystems are mounted from the host into the container underneath a/hostdirectory, using Docker’s-vflag. - Via the Node Exporter’s
-collector.procfsand-collector.sysfsflags, we instruct the Node Exporter to look for the/procand/sysfilesystems in a non-standard location. - To report host filesystem metrics, we also mount the entire root (
/) filesystem into the container (at/rootfs), again using Docker’s-vflag. - Use Node Exporter’s
-collector.filesystem.ignored-mount-pointsflag to ignore any other filesystems within the container that do not belong to the host system. This option takes a regular expression of mount points to exclude from the reported metrics. - Using the
--net=hostDocker flag, we place the container into the same network stack as the host, so that reading from files such as/proc/net/devwill yield the same results as on the host (reading from the/procfilesystem mounted in from the host is not sufficient).
Note that some metrics will still differ in comparison to a Node Exporter running directly on the host. Specifically, metrics reported about filesystem usage will have a /rootfs prefix in the value of their mountpoint labels, due to us mounting in the root filesystem under this prefix in the container. There is also no guarantee that the described workarounds will be sufficient for any future Node Exporter features, so run Node Exporter on Docker at your own discretion.
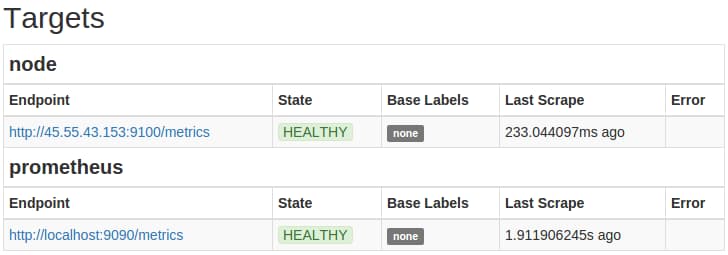
The Prometheus server should now automatically start scraping the Node Exporter. Head to your Prometheus server’s status page at http://your_server_ip:9090/status and verify that the http://your_server_ip:9100/metrics target for the node job is now showing a HEALTHY state:
Step 3 — Setting up Grafana
Finally, we will set up Grafana. Grafana is a graphical dashboard builder that supports Prometheus as a backend to query for data to graph.
Grafana stores its dashboard metadata (such as which dashboards exist and what graphs they should show) in a configurable SQL-based database. Grafana supports using a local file-backed SQLite3 database as well as external database servers such as MySQL or PostgreSQL for this.
In this tutorial, we will use a SQLite3 database backed by a Docker data volume. See How and When to Use Sqlite for more information.
Launch Grafana as a Docker container with an administrator password (admin_password) of your choosing:
- docker run -d -p 3000:3000 -e "GF_SECURITY_ADMIN_PASSWORD=admin_password" -v ~/grafana_db:/var/lib/grafana grafana/grafana
This will download the Grafana Docker image from the Docker Hub and create a new Docker volume placed at ~/grafana_db on the host system and at /var/lib/grafana in the container filesystem. In the container, Grafana will then automatically create and initialize its SQLite3 database at /var/lib/grafana/grafana.db.
The -e flag allows passing environment variables to the process launched inside the Docker container. Here, we use it to set the GF_SECURITY_ADMIN_PASSWORD environment variable to the desired dashboard administrator password, overriding the default password of admin. Environment variables may also be used to override any other Grafana configuration settings. See Using environment variables for more details.
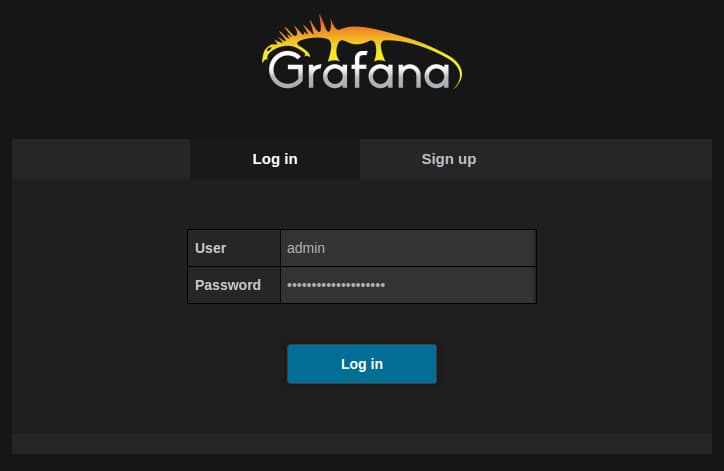
To verify that Grafana is running correctly, head to http://your_server_ip:3000/. The administrator username is admin and the password is the one you chose when starting the Docker container previously.
After logging in, you should see Grafana’s main view:
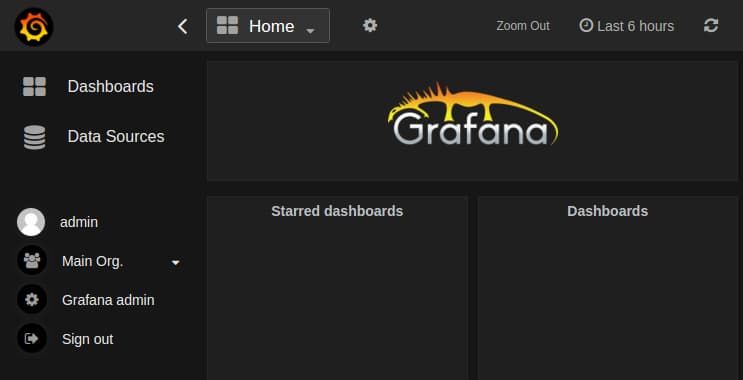
See the Grafana documentation for more on how to get started with Grafana. The Prometheus Grafana documentation also shows how to use Grafana in combination with Prometheus specifically.
Conclusion
Congratulations! You have set up a Prometheus server, a Node Exporter, and Grafana — all using Docker. Even though these are currently all running on the same machine, this is only for demonstration purposes. In production setups, one would usually run the Node Exporter on every monitored machine, multiple Prometheus servers (as needed by the organization), as well as a single Grafana server to graph the data from these servers.
To learn more about using Prometheus in general, refer to its documentation.
Thanks for learning with the DigitalOcean Community. Check out our offerings for compute, storage, networking, and managed databases.
About the author(s)
Co-creator of the Prometheus monitoring system. Infrastructure software developer.
Technical Editor, DigitalOcean
Still looking for an answer?
This textbox defaults to using Markdown to format your answer.
You can type !ref in this text area to quickly search our full set of tutorials, documentation & marketplace offerings and insert the link!
Hello! Thanks for very good tutorial! How can I including with docker prometheus alertmanager docker-container? maby: docker run -d -p 9093:9093 -v ~/alertmanager.yml:/etc/alertmanager.yml prom/alertmanager -config.file=/etc/alertmanager.yml
 This work is licensed under a Creative Commons Attribution-NonCommercial- ShareAlike 4.0 International License.
Become a contributor for community
Get paid to write technical tutorials and select a tech-focused charity to receive a matching donation.

DigitalOcean Documentation
Full documentation for every DigitalOcean product.

Resources for startups and AI-native businesses
The Wave has everything you need to know about building a business, from raising funding to marketing your product.
The developer cloud
Scale up as you grow — whether you're running one virtual machine or ten thousand.

Start building today
From GPU-powered inference and Kubernetes to managed databases and storage, get everything you need to build, scale, and deploy intelligent applications.
