By Hanif Jetha

Status: Deprecated
This article is deprecated and no longer maintained.
Reason
The steps in this tutorial still work, but will produce a configuration which is now unnecessarily difficult to maintain.
See Instead
This article may still be useful as a reference, but may not follow best practices. We strongly recommend using a more recent article.
Introduction
Along with tracing and logging, monitoring and alerting are essential components of a Kubernetes observability stack. Setting up monitoring for your DigitalOcean Kubernetes cluster allows you to track your resource usage and analyze and debug application errors.
A monitoring system usually consists of a time-series database that houses metric data and a visualization layer. In addition, an alerting layer creates and manages alerts, handing them off to integrations and external services as necessary. Finally, one or more components generate or expose the metric data that will be stored, visualized, and processed for alerts by the stack.
One popular monitoring solution is the open-source Prometheus, Grafana, and Alertmanager stack, deployed alongside kube-state-metrics and node_exporter to expose cluster-level Kubernetes object metrics as well as machine-level metrics like CPU and memory usage.
Rolling out this monitoring stack on a Kubernetes cluster requires configuring individual components, manifests, Prometheus metrics, and Grafana dashboards, which can take some time. The DigitalOcean Kubernetes Cluster Monitoring Quickstart, released by the DigitalOcean Community Developer Education team, contains fully defined manifests for a Prometheus-Grafana-Alertmanager cluster monitoring stack, as well as a set of preconfigured alerts and Grafana dashboards. It can help you get up and running quickly, and forms a solid foundation from which to build your observability stack.
In this tutorial, we’ll deploy this preconfigured stack on DigitalOcean Kubernetes, access the Prometheus, Grafana, and Alertmanager interfaces, and describe how to customize it.
Prerequisites
Before you begin, you’ll need a DigitalOcean Kubernetes cluster available to you, and the following tools installed in your local development environment:
- The
kubectlcommand-line interface installed on your local machine and configured to connect to your cluster. You can read more about installing and configuringkubectlin its official documentation. - The git version control system installed on your local machine. To learn how to install git on Ubuntu 18.04, consult How To Install Git on Ubuntu 18.04.
- The Coreutils base64 tool installed on your local machine. If you’re using a Linux machine, this will most likely already be installed. If you’re using OS X, you can use
openssl base64, which comes installed by default.
<$>[note] Note: The Cluster Monitoring Quickstart has only been tested on DigitalOcean Kubernetes clusters. To use the Quickstart with other Kubernetes clusters, some modification to the manifest files may be necessary. <$>
Step 1 — Cloning the GitHub Repository and Configuring Environment Variables
To start, clone the DigitalOcean Kubernetes Cluster Monitoring GitHub repository onto your local machine using git:
- git clone https://github.com/do-community/doks-monitoring.git
Then, navigate into the repo:
- cd doks-monitoring
You should see the following directory structure:
- ls
OutputLICENSE
README.md
changes.txt
manifest
The manifest directory contains Kubernetes manifests for all of the monitoring stack components, including Service Accounts, Deployments, StatefulSets, ConfigMaps, etc. To learn more about these manifest files and how to configure them, skip ahead to Configuring the Monitoring Stack.
If you just want to get things up and running, begin by setting the APP_INSTANCE_NAME and NAMESPACE environment variables, which will be used to configure a unique name for the stack’s components and configure the Namespace into which the stack will be deployed:
- export APP_INSTANCE_NAME=sammy-cluster-monitoring
- export NAMESPACE=default
In this tutorial, we set APP_INSTANCE_NAME to sammy-cluster-monitoring, which will prepend all of the monitoring stack Kubernetes object names. You should substitute in a unique descriptive prefix for your monitoring stack. We also set the Namespace to default. If you’d like to deploy the monitoring stack to a Namespace other than default, ensure that you first create it in your cluster:
- kubectl create namespace "$NAMESPACE"
You should see the following output:
Outputnamespace/sammy created
In this case, the NAMESPACE environment variable was set to sammy. Throughout the rest of the tutorial we’ll assume that NAMESPACE has been set to default.
Now, use the base64 command to base64-encode a secure Grafana password. Be sure to substitute a password of your choosing for your_grafana_password:
- export GRAFANA_GENERATED_PASSWORD="$(echo -n 'your_grafana_password' | base64)"
If you’re using macOS, you can substitute the openssl base64 command which comes installed by default.
At this point, you’ve grabbed the stack’s Kubernetes manifests and configured the required environment variables, so you’re now ready to substitute the configured variables into the Kubernetes manifest files and create the stack in your Kubernetes cluster.
Step 2 — Creating the Monitoring Stack
The DigitalOcean Kubernetes Monitoring Quickstart repo contains manifests for the following monitoring, scraping, and visualization components:
- Prometheus is a time series database and monitoring tool that works by polling metrics endpoints and scraping and processing the data exposed by these endpoints. It allows you to query this data using PromQL, a time series data query language. Prometheus will be deployed into the cluster as a StatefulSet with 2 replicas that uses Persistent Volumes with DigitalOcean Block Storage. In addition, a preconfigured set of Prometheus Alerts, Rules, and Jobs will be stored as a ConfigMap. To learn more about these, skip ahead to the Prometheus section of Configuring the Monitoring Stack.
- Alertmanager, usually deployed alongside Prometheus, forms the alerting layer of the stack, handling alerts generated by Prometheus and deduplicating, grouping, and routing them to integrations like email or PagerDuty. Alertmanager will be installed as a StatefulSet with 2 replicas. To learn more about Alertmanager, consult Alerting from the Prometheus docs.
- Grafana is a data visualization and analytics tool that allows you to build dashboards and graphs for your metrics data. Grafana will be installed as a StatefulSet with one replica. In addition, a preconfigured set of Dashboards generated by kubernetes-mixin will be stored as a ConfigMap.
- kube-state-metrics is an add-on agent that listens to the Kubernetes API server and generates metrics about the state of Kubernetes objects like Deployments and Pods. These metrics are served as plaintext on HTTP endpoints and consumed by Prometheus. kube-state-metrics will be installed as an auto-scalable Deployment with one replica.
- node-exporter, a Prometheus exporter that runs on cluster nodes and provides OS and hardware metrics like CPU and memory usage to Prometheus. These metrics are also served as plaintext on HTTP endpoints and consumed by Prometheus. node-exporter will be installed as a DaemonSet.
By default, along with scraping metrics generated by node-exporter, kube-state-metrics, and the other components listed above, Prometheus will be configured to scrape metrics from the following components:
- kube-apiserver, the Kubernetes API server.
- kubelet, the primary node agent that interacts with kube-apiserver to manage Pods and containers on a node.
- cAdvisor, a node agent that discovers running containers and collects their CPU, memory, filesystem, and network usage metrics.
To learn more about configuring these components and Prometheus scraping jobs, skip ahead to Configuring the Monitoring Stack. We’ll now substitute the environment variables defined in the previous step into the repo’s manifest files, and concatenate the individual manifests into a single master file.
Begin by using awk and envsubst to fill in the APP_INSTANCE_NAME, NAMESPACE, and GRAFANA_GENERATED_PASSWORD variables in the repo’s manifest files. After substituting in the variable values, the files will be combined and saved into a master manifest file called sammy-cluster-monitoring_manifest.yaml.
- awk 'FNR==1 {print "---"}{print}' manifest/* \
- | envsubst '$APP_INSTANCE_NAME $NAMESPACE $GRAFANA_GENERATED_PASSWORD' \
- > "${APP_INSTANCE_NAME}_manifest.yaml"
You should consider storing this file in version control so that you can track changes to the monitoring stack and roll back to previous versions. If you do this, be sure to scrub the admin-password variable from the file so that you don’t check your Grafana password into version control.
Now that you’ve generated the master manifest file, use kubectl apply -f to apply the manifest and create the stack in the Namespace you configured:
- kubectl apply -f "${APP_INSTANCE_NAME}_manifest.yaml" --namespace "${NAMESPACE}"
You should see output similar to the following:
Outputserviceaccount/alertmanager created
configmap/sammy-cluster-monitoring-alertmanager-config created
service/sammy-cluster-monitoring-alertmanager-operated created
service/sammy-cluster-monitoring-alertmanager created

. . .

clusterrolebinding.rbac.authorization.k8s.io/prometheus created
configmap/sammy-cluster-monitoring-prometheus-config created
service/sammy-cluster-monitoring-prometheus created
statefulset.apps/sammy-cluster-monitoring-prometheus created
You can track the stack’s deployment progress using kubectl get all. Once all of the stack components are RUNNING, you can access the preconfigured Grafana dashboards through the Grafana web interface.
Step 3 — Accessing Grafana and Exploring Metrics Data
The Grafana Service manifest exposes Grafana as a ClusterIP Service, which means that it’s only accessible via a cluster-internal IP address. To access Grafana outside of your Kubernetes cluster, you can either use kubectl patch to update the Service in-place to a public-facing type like NodePort or LoadBalancer, or kubectl port-forward to forward a local port to a Grafana Pod port. In this tutorial we’ll forward ports, so you can skip ahead to Forwarding a Local Port to Access the Grafana Service. The following section on exposing Grafana externally is included for reference purposes.
Exposing the Grafana Service using a Load Balancer (optional)
If you’d like to create a DigitalOcean Load Balancer for Grafana with an external public IP, use kubectl patch to update the existing Grafana Service in-place to the LoadBalancer Service type:
- kubectl patch svc "$APP_INSTANCE_NAME-grafana" \
- --namespace "$NAMESPACE" \
- -p '{"spec": {"type": "LoadBalancer"}}'
The kubectl patch command allows you to update Kubernetes objects in-place to make changes without having to re-deploy the objects. You can also modify the master manifest file directly, adding a type: LoadBalancer parameter to the Grafana Service spec. To learn more about kubectl patch and Kubernetes Service types, you can consult the Update API Objects in Place Using kubectl patch and Services resources in the official Kubernetes docs.
After running the above command, you should see the following:
Outputservice/sammy-cluster-monitoring-grafana patched
It may take several minutes to create the Load Balancer and assign it a public IP. You can track its progress using the following command with the -w flag to watch for changes:
- kubectl get service "$APP_INSTANCE_NAME-grafana" -w
Once the DigitalOcean Load Balancer has been created and assigned an external IP address, you can fetch its external IP using the following commands:
- SERVICE_IP=$(kubectl get svc $APP_INSTANCE_NAME-grafana \
- --namespace $NAMESPACE \
- --output jsonpath='{.status.loadBalancer.ingress[0].ip}')
- echo "http://${SERVICE_IP}/"
You can now access the Grafana UI by navigating to http://SERVICE_IP/.
Forwarding a Local Port to Access the Grafana Service
If you don’t want to expose the Grafana Service externally, you can also forward local port 3000 into the cluster directly to a Grafana Pod using kubectl port-forward.
- kubectl port-forward --namespace ${NAMESPACE} ${APP_INSTANCE_NAME}-grafana-0 3000
You should see the following output:
OutputForwarding from 127.0.0.1:3000 -> 3000
Forwarding from [::1]:3000 -> 3000
This will forward local port 3000 to containerPort 3000 of the Grafana Pod sammy-cluster-monitoring-grafana-0. To learn more about forwarding ports into a Kubernetes cluster, consult Use Port Forwarding to Access Applications in a Cluster.
Visit http://localhost:3000 in your web browser. You should see the following Grafana login page:
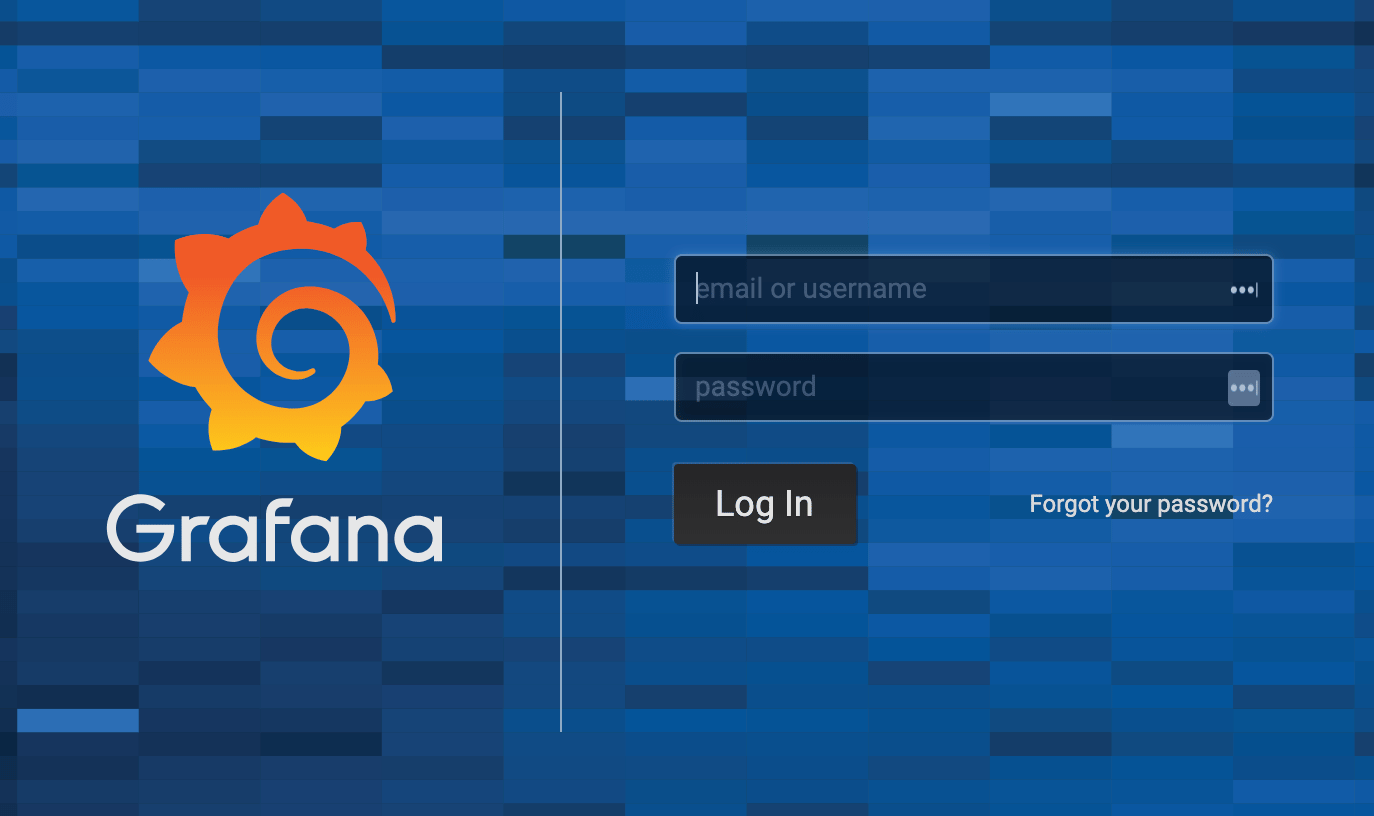
To log in, use the default username admin (if you haven’t modified the admin-user parameter), and the password you configured in Step 1.
You’ll be brought to the following Home Dashboard:
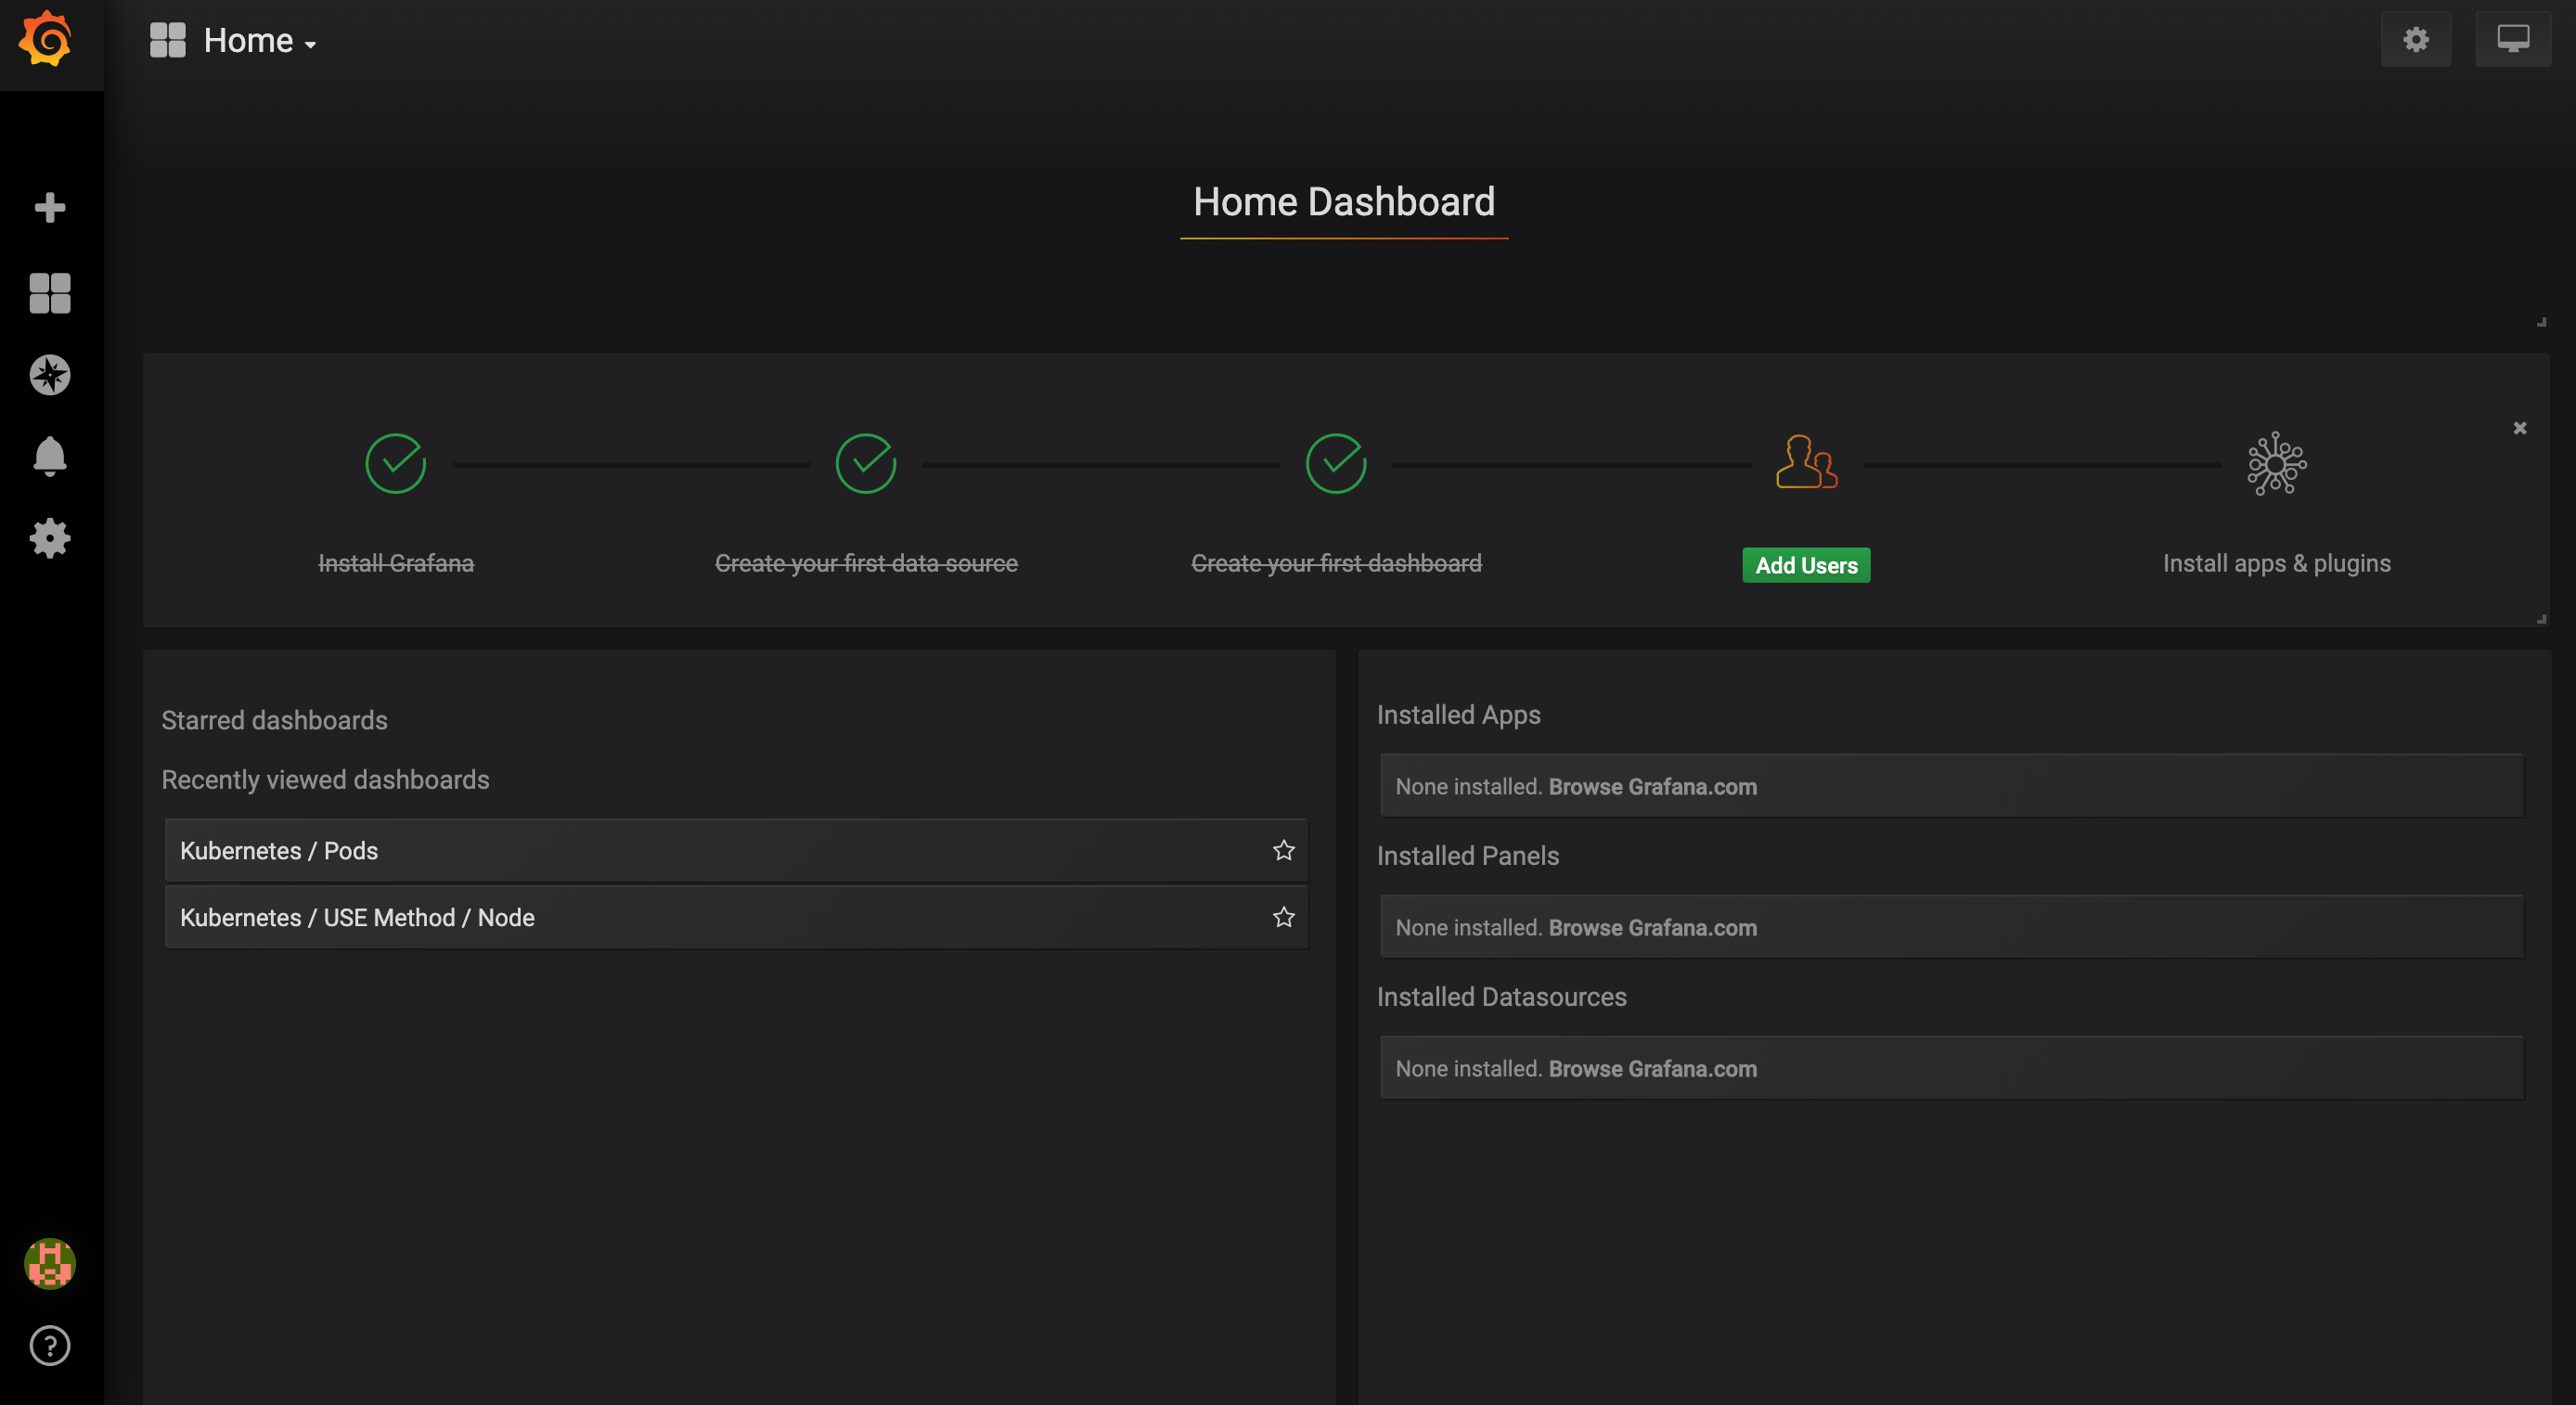
In the left-hand navigation bar, select the Dashboards button, then click on Manage:
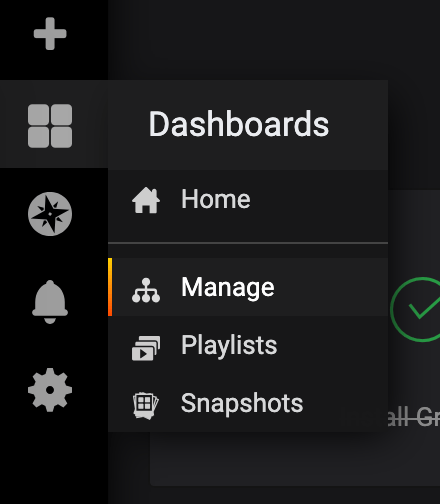
You’ll be brought to the following dashboard management interface, which lists the dashboards configured in the dashboards-configmap.yaml manifest:
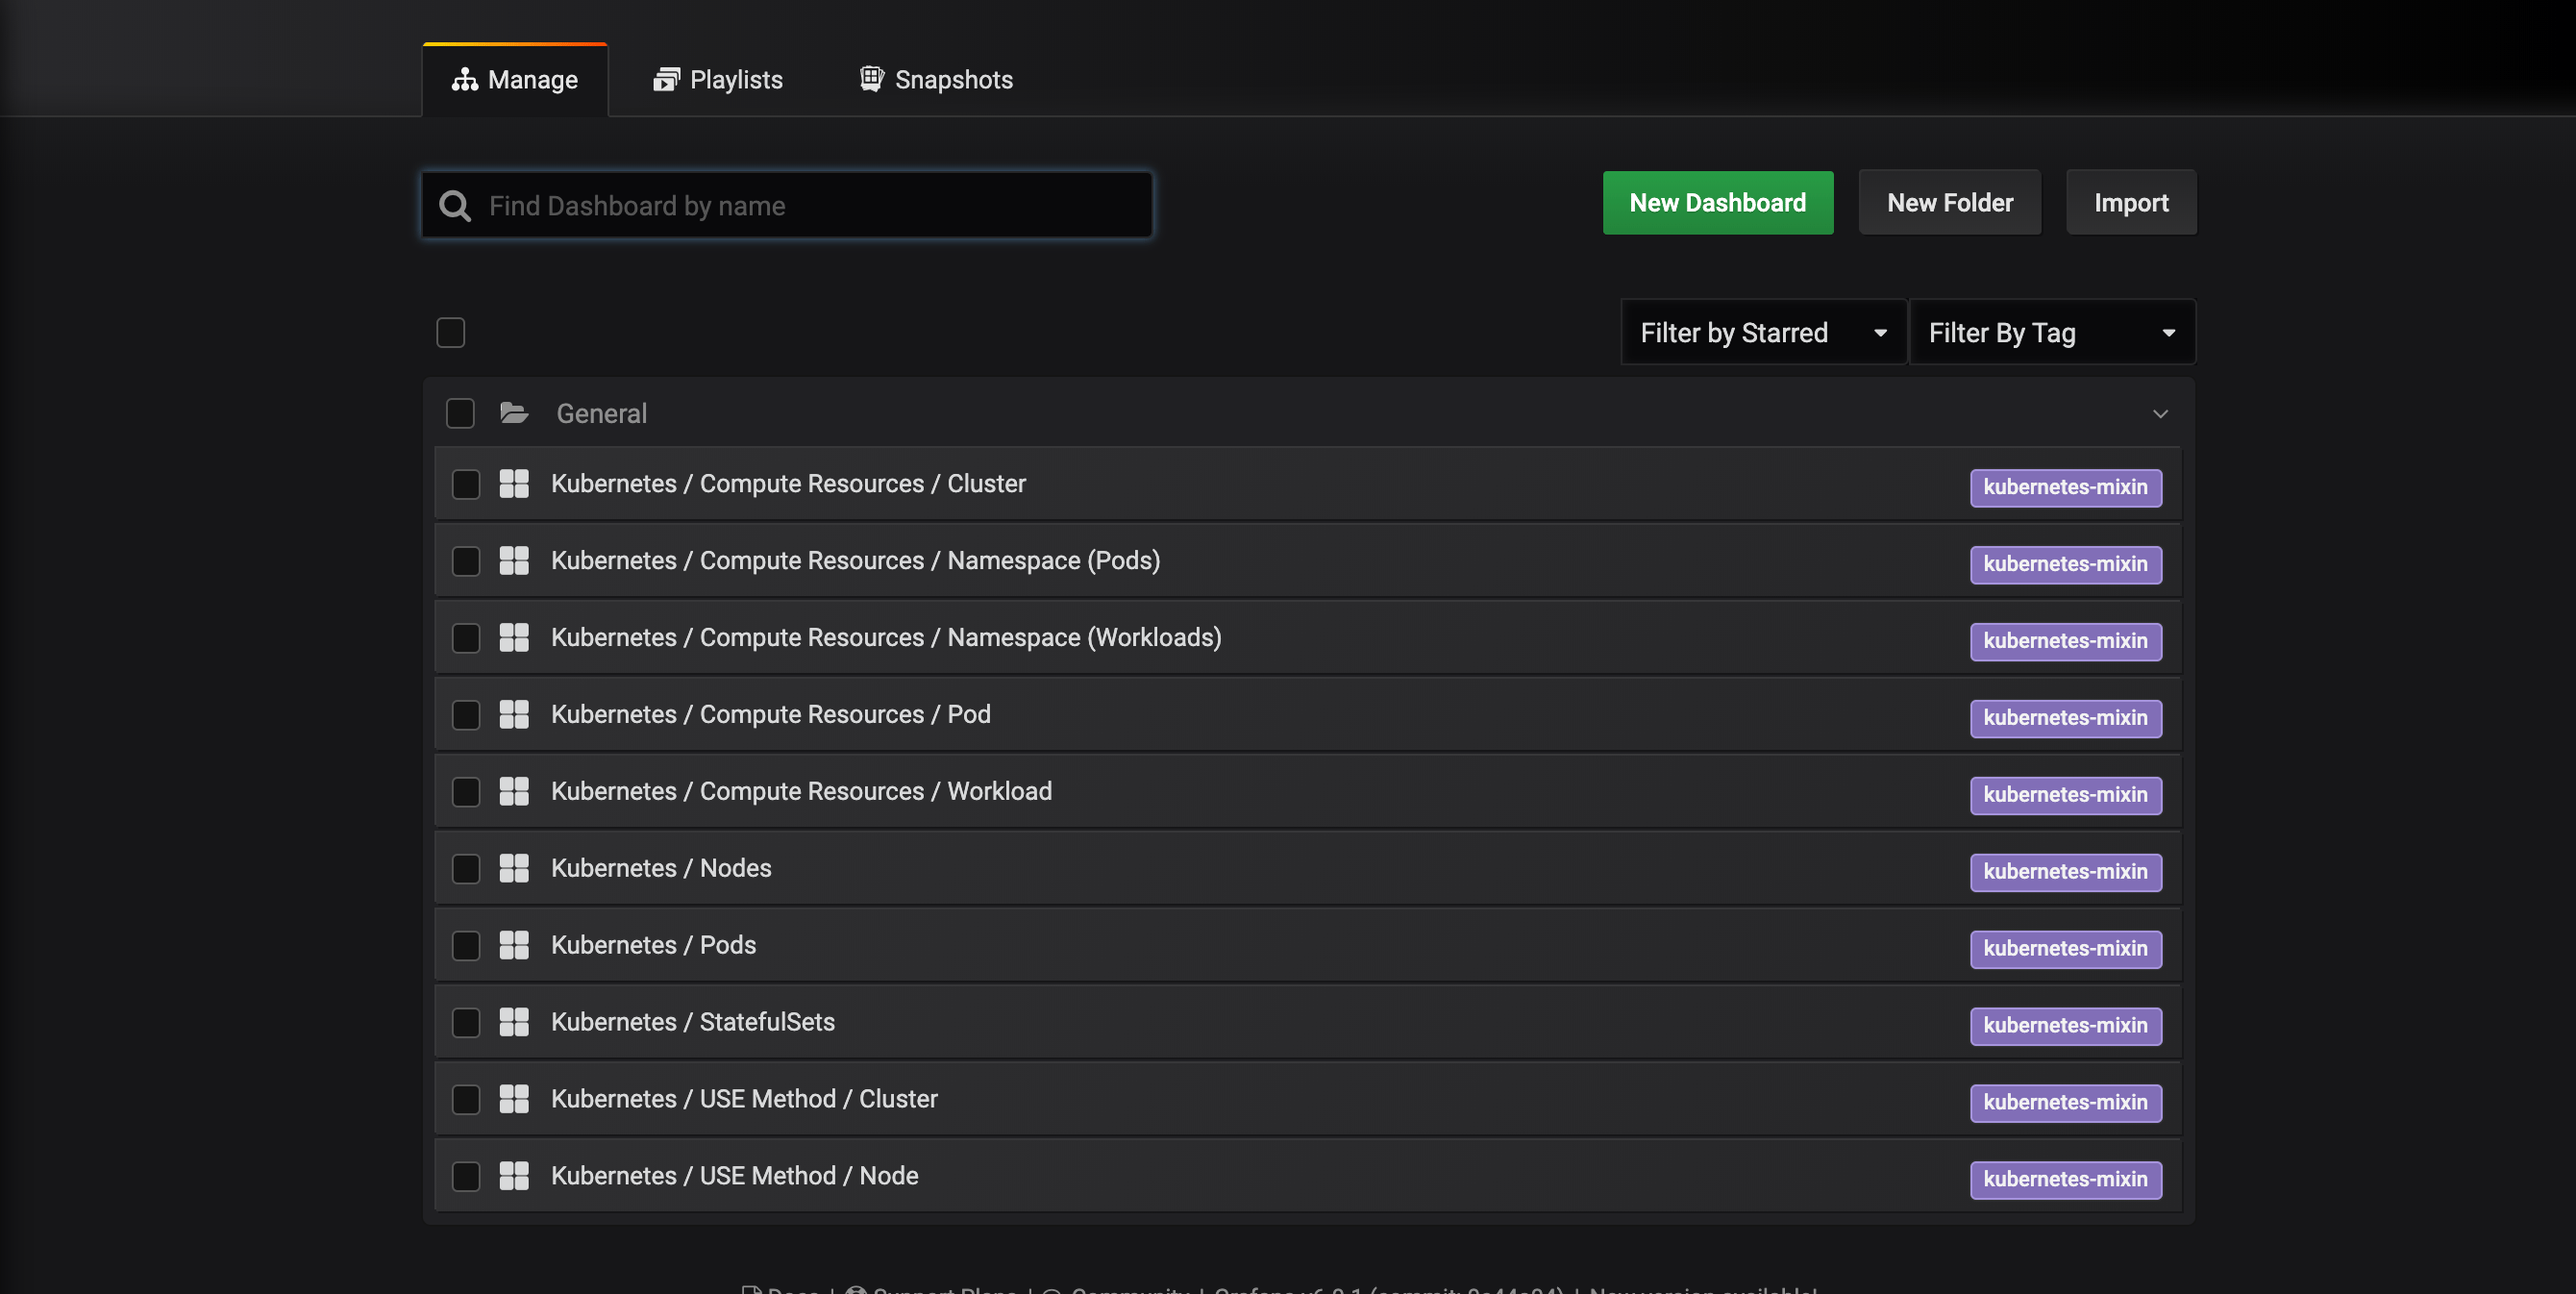
These dashboards are generated by kubernetes-mixin, an open-source project that allows you to create a standardized set of cluster monitoring Grafana dashboards and Prometheus alerts. To learn more, consult the kubernetes-mixin GitHub repo.
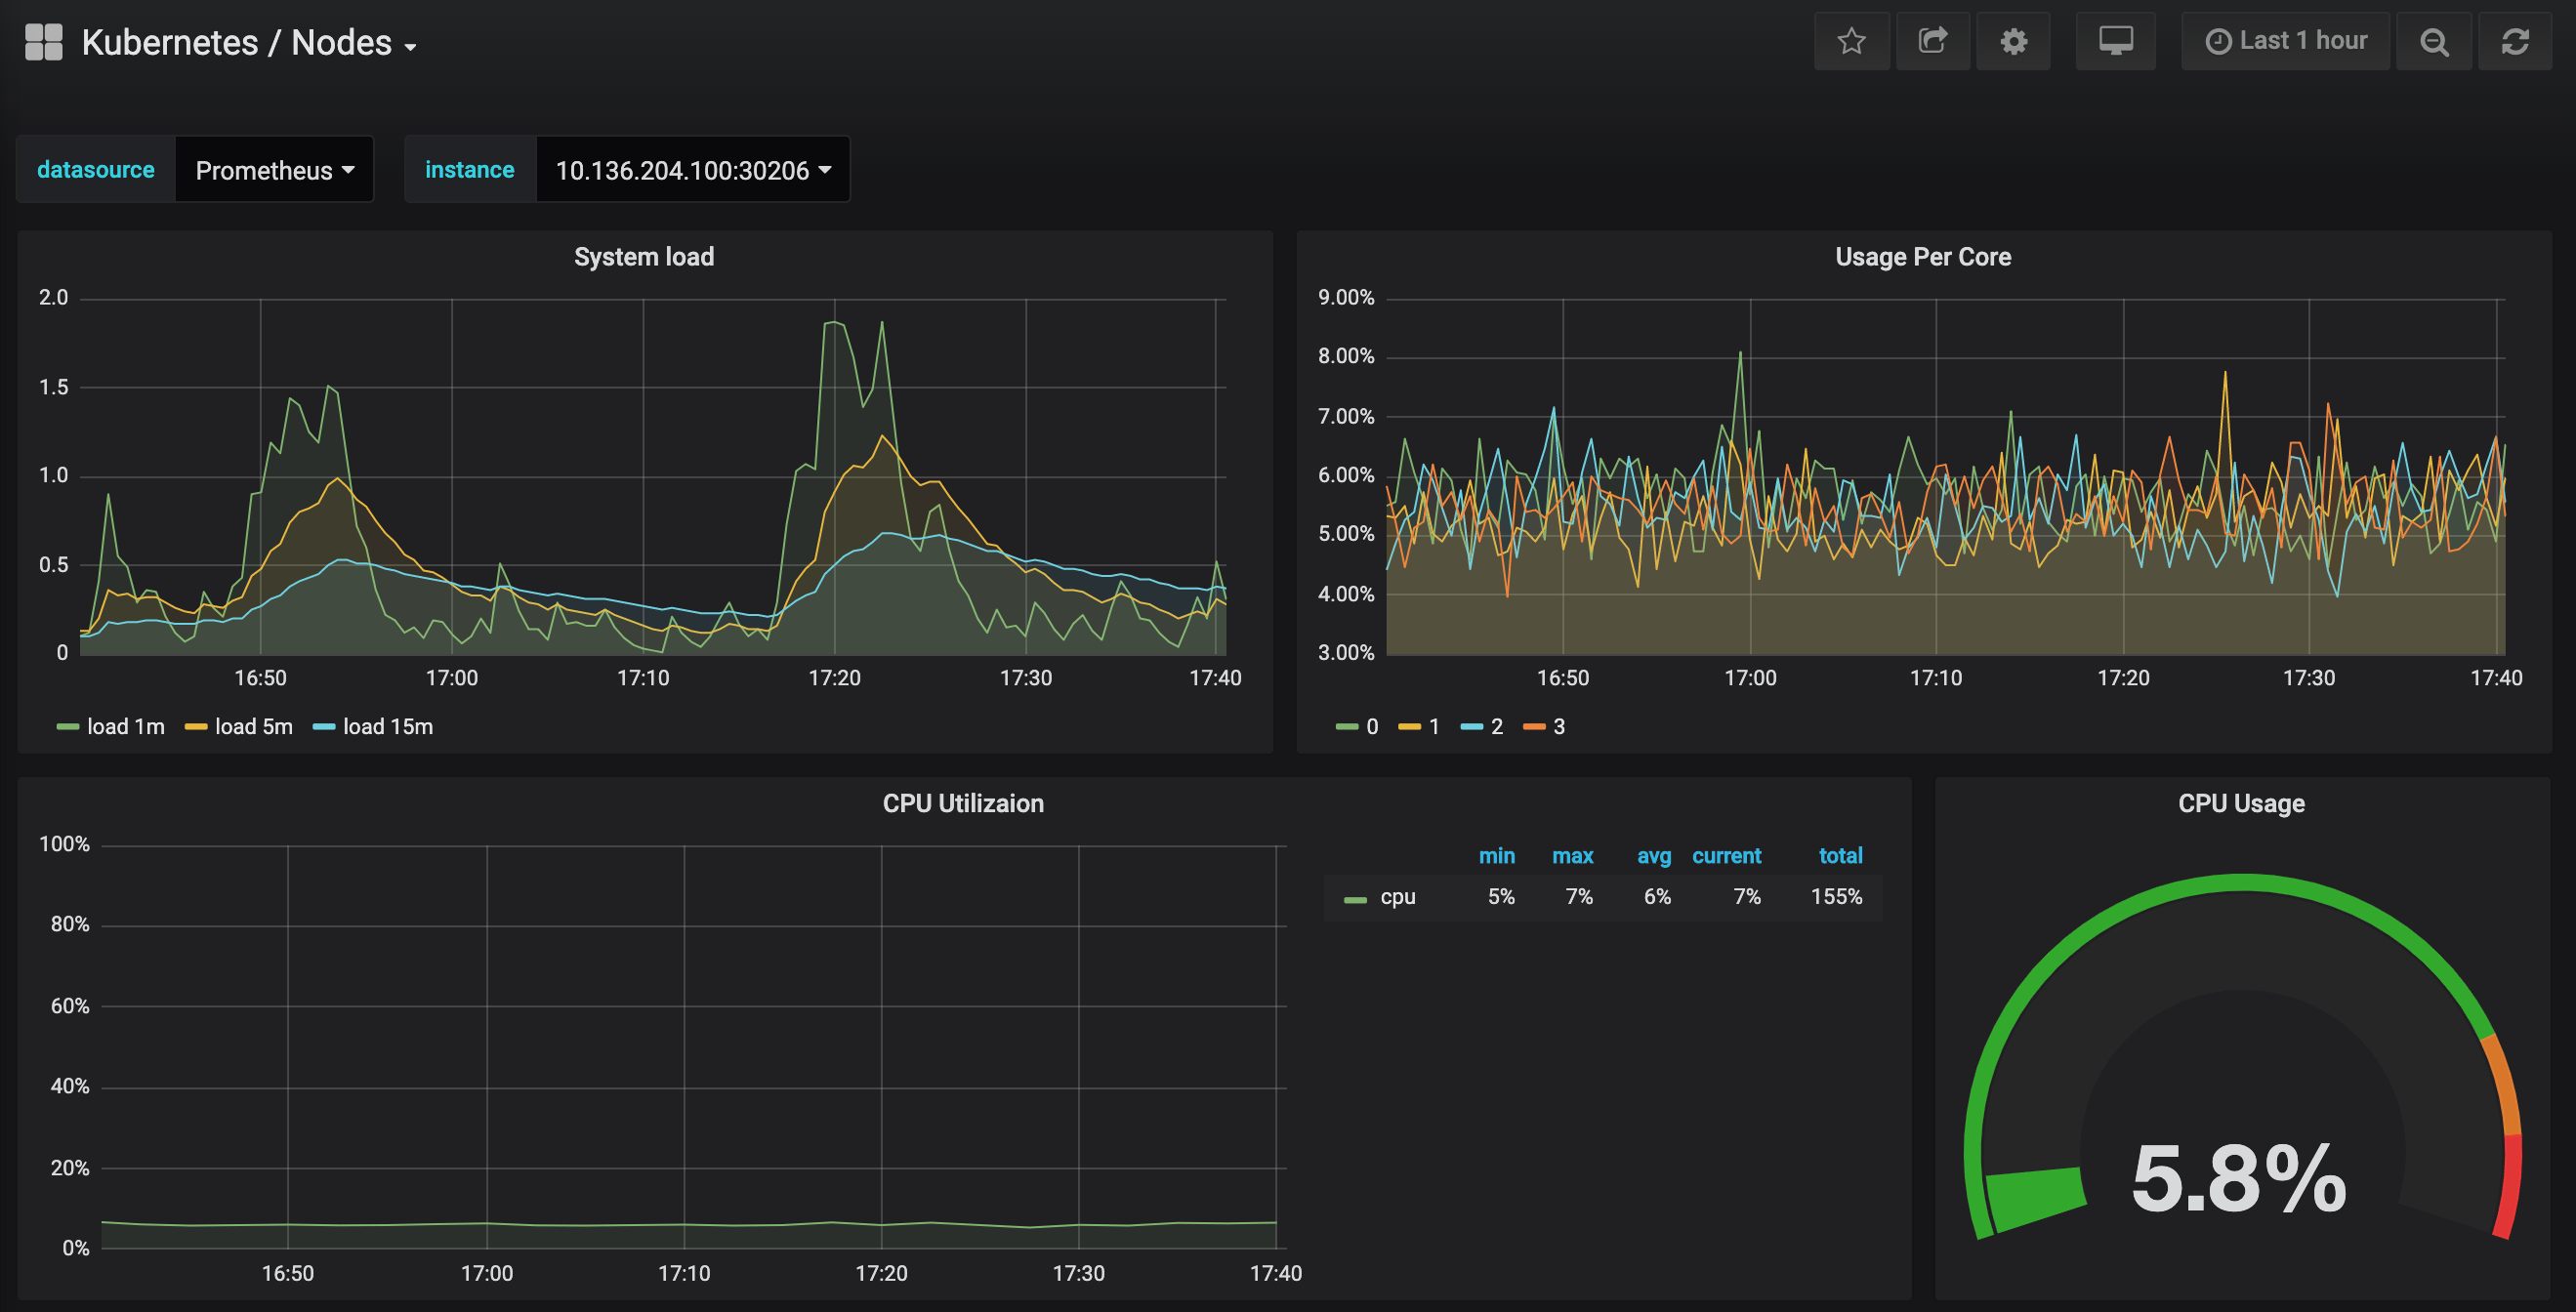
Click in to the Kubernetes / Nodes dashboard, which visualizes CPU, memory, disk, and network usage for a given node:
Describing how to use these dashboards is outside of this tutorial’s scope, but you can consult the following resources to learn more:
- To learn more about the USE method for analyzing a system’s performance, you can consult Brendan Gregg’s The Utilization Saturation and Errors (USE) Method page.
- Google’s SRE Book is another helpful resource, in particular Chapter 6: Monitoring Distributed Systems.
- To learn how to build your own Grafana dashboards, check out Grafana’s Getting Started page.
In the next step, we’ll follow a similar process to connect to and explore the Prometheus monitoring system.
Step 4 — Accessing Prometheus and Alertmanager
To connect to the Prometheus Pods, we can use kubectl port-forward to forward a local port. If you’re done exploring Grafana, you can close the port-forward tunnel by hitting CTRL-C. Alternatively, you can open a new shell and create a new port-forward connection.
Begin by listing running Pods in the default namespace:
- kubectl get pod -n default
You should see the following Pods:
Outputsammy-cluster-monitoring-alertmanager-0                      1/1     Running   0          17m
sammy-cluster-monitoring-alertmanager-1                      1/1     Running   0          15m
sammy-cluster-monitoring-grafana-0                           1/1     Running   0          16m
sammy-cluster-monitoring-kube-state-metrics-d68bb884-gmgxt   2/2     Running   0          16m
sammy-cluster-monitoring-node-exporter-7hvb7                 1/1     Running   0          16m
sammy-cluster-monitoring-node-exporter-c2rvj                 1/1     Running   0          16m
sammy-cluster-monitoring-node-exporter-w8j74                 1/1     Running   0          16m
sammy-cluster-monitoring-prometheus-0                        1/1     Running   0          16m
sammy-cluster-monitoring-prometheus-1                        1/1     Running   0          16m
We are going to forward local port 9090 to port 9090 of the sammy-cluster-monitoring-prometheus-0 Pod:
- kubectl port-forward --namespace ${NAMESPACE} sammy-cluster-monitoring-prometheus-0 9090
You should see the following output:
OutputForwarding from 127.0.0.1:9090 -> 9090
Forwarding from [::1]:9090 -> 9090
This indicates that local port 9090 is being forwarded successfully to the Prometheus Pod.
Visit http://localhost:9090 in your web browser. You should see the following Prometheus Graph page:
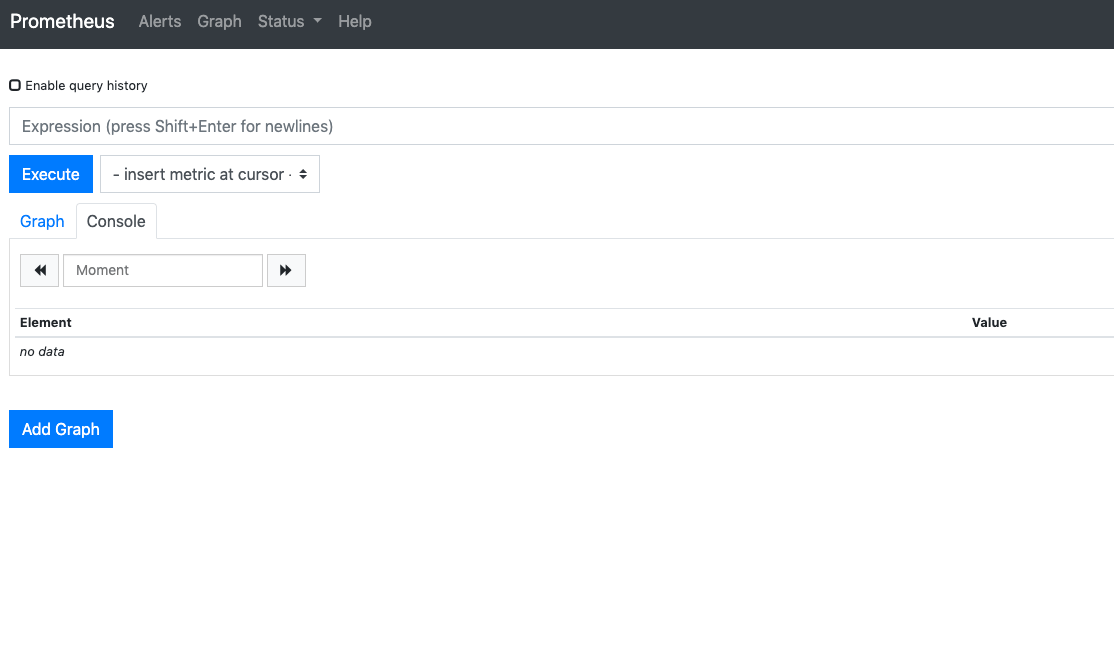
From here you can use PromQL, the Prometheus query language, to select and aggregate time series metrics stored in its database. To learn more about PromQL, consult Querying Prometheus from the official Prometheus docs.
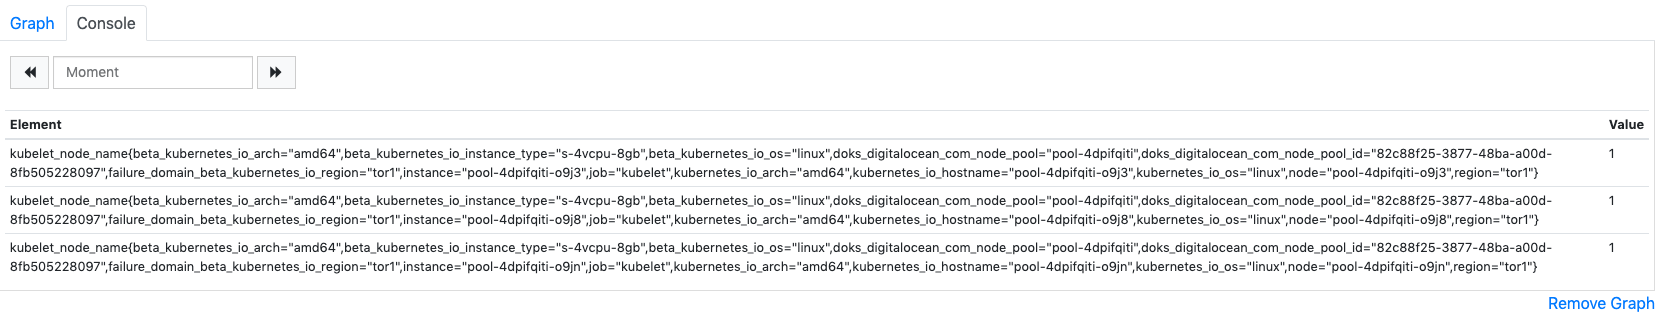
In the Expression field, type kubelet_node_name and hit Execute. You should see a list of time series with the metric kubelet_node_name that reports the Nodes in your Kubernetes cluster. You can see which node generated the metric and which job scraped the metric in the metric labels:
Finally, in the top navigation bar, click on Status and then Targets to see the list of targets Prometheus has been configured to scrape. You should see a list of targets corresponding to the list of monitoring endpoints described at the beginning of Step 2.
To learn more about Prometheus and how to query your cluster metrics, consult the official Prometheus docs.
To connect to Alertmanager, which manages Alerts generated by Prometheus, we’ll follow a similar process to what we used to connect to Prometheus. . In general, you can explore Alertmanager Alerts by clicking into Alerts in the Prometheus top navigation bar.
To connect to the Alertmanager Pods, we will once again use kubectl port-forward to forward a local port. If you’re done exploring Prometheus, you can close the port-forward tunnel by hitting CTRL-Cor open a new shell to create a new connection. .
We are going to forward local port 9093 to port 9093 of the sammy-cluster-monitoring-alertmanager-0 Pod:
- kubectl port-forward --namespace ${NAMESPACE} sammy-cluster-monitoring-alertmanager-0 9093
You should see the following output:
OutputForwarding from 127.0.0.1:9093 -> 9093
Forwarding from [::1]:9093 -> 9093
This indicates that local port 9093 is being forwarded successfully to an Alertmanager Pod.
Visit http://localhost:9093 in your web browser. You should see the following Alertmanager Alerts page:
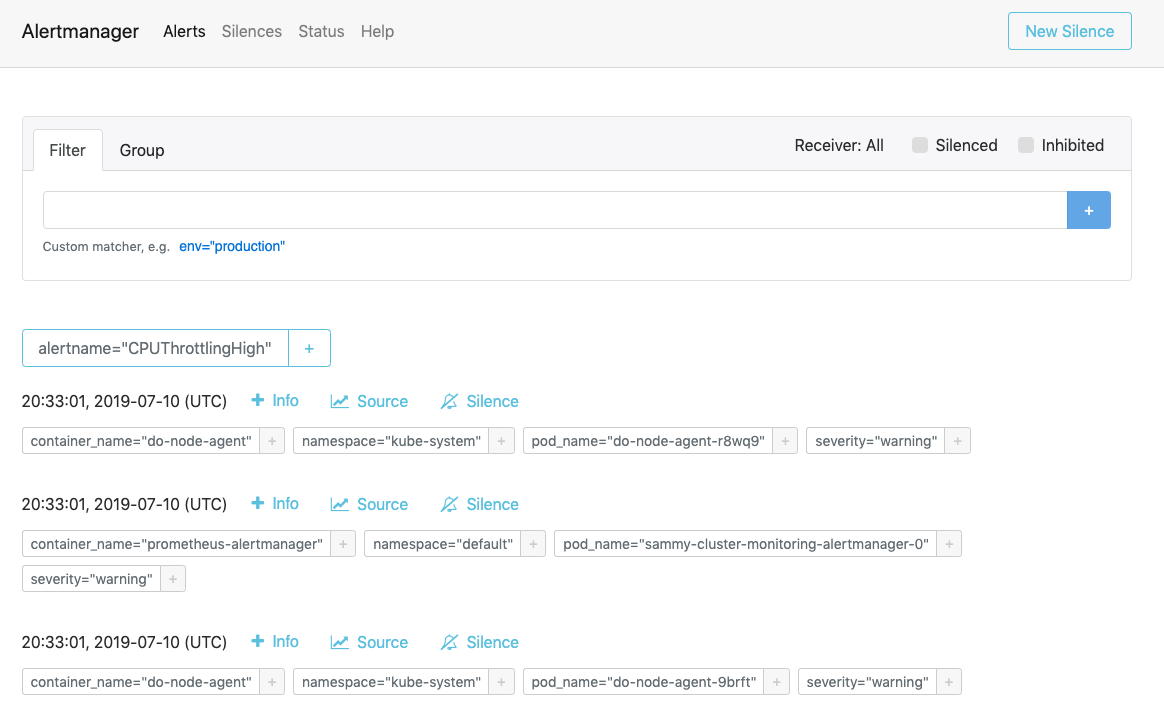
From here, you can explore firing alerts and optionally silencing them. To learn more about Alertmanager, consult the official Alertmanager documentation.
In the next step, you’ll learn how to optionally configure and scale some of the monitoring stack components.
Step 6 — Configuring the Monitoring Stack (optional)
The manifests included in the DigitalOcean Kubernetes Cluster Monitoring Quickstart repository can be modified to use different container images, different numbers of Pod replicas, different ports, and customized configuration files.
In this step, we’ll provide a high-level overview of each manifest’s purpose, and then demonstrate how to scale Prometheus up to 3 replicas by modifying the master manifest file.
To begin, navigate into the manifests subdirectory in the repo, and list the directory’s contents:
- cd manifest
- ls
Outputalertmanager-0serviceaccount.yaml
alertmanager-configmap.yaml
alertmanager-operated-service.yaml
alertmanager-service.yaml
. . .
node-exporter-ds.yaml
prometheus-0serviceaccount.yaml
prometheus-configmap.yaml
prometheus-service.yaml
prometheus-statefulset.yaml
Here you’ll find manifests for the different monitoring stack components. To learn more about specific parameters in the manifests, click into the links and consult the comments included throughout the YAML files:
Alertmanager
-
alertmanager-0serviceaccount.yaml: The Alertmanager Service Account, used to give the Alertmanager Pods a Kubernetes identity. To learn more about Service Accounts, consult Configure Service Accounts for Pods. -
alertmanager-configmap.yaml: A ConfigMap containing a minimal Alertmanager configuration file, calledalertmanager.yml. Configuring Alertmanager is beyond the scope of this tutorial, but you can learn more by consulting the Configuration section of the Alertmanager documentation. -
alertmanager-operated-service.yaml: The AlertmanagermeshService, which is used for routing requests between Alertmanager Pods in the current 2-replica high-availability configuration. -
alertmanager-service.yaml: The AlertmanagerwebService, which is used to access the Alertmanager web interface, which you may have done in the previous step. -
alertmanager-statefulset.yaml: The Alertmanager StatefulSet, configured with 2 replicas.
Grafana
-
dashboards-configmap.yaml: A ConfigMap containing the preconfigured JSON Grafana monitoring dashboards. Generating a new set of dashboards and alerts from scratch goes beyond the scope of this tutorial, but to learn more you can consult the kubernetes-mixin GitHub repo. -
grafana-0serviceaccount.yaml: The Grafana Service Account. -
grafana-configmap.yaml: A ConfigMap containing a default set of minimal Grafana configuration files. -
grafana-secret.yaml: A Kubernetes Secret containing the Grafana admin user and password. To learn more about Kubernetes Secrets, consult Secrets. -
grafana-service.yaml: The manifest defining the Grafana Service. -
grafana-statefulset.yaml: The Grafana StatefulSet, configured with 1 replica, which is not scalable. Scaling Grafana is beyond the scope of this tutorial. To learn how to create a highly available Grafana set up, you can consult How to setup Grafana for High Availability from the official Grafana docs.
kube-state-metrics
-
kube-state-metrics-0serviceaccount.yaml: The kube-state-metrics Service Account and ClusterRole. To learn more about ClusterRoles, consult Role and ClusterRole from the Kubernetes docs. -
kube-state-metrics-deployment.yaml: The main kube-state-metrics Deployment manifest, configured with 1 dynamically scalable replica usingaddon-resizer. -
kube-state-metrics-service.yaml: The Service exposing thekube-state-metricsDeployment.
node-exporter
-
node-exporter-0serviceaccount.yaml: The node-exporter Service Account. -
node-exporter-ds.yaml: The node-exporter DaemonSet manifest. Since node-exporter is a DaemonSet, a node-exporter Pod runs on each Node in the cluster.
###Prometheus
-
prometheus-0serviceaccount.yaml: The Prometheus Service Account, ClusterRole and ClusterRoleBinding. -
prometheus-configmap.yaml: A ConfigMap that contains three configuration files:alerts.yaml: Contains a preconfigured set of alerts generated bykubernetes-mixin(which was also used to generate the Grafana dashboards). To learn more about configuring alerting rules, consult Alerting Rules from the Prometheus docs.prometheus.yaml: Prometheus’s main configuration file. Prometheus has been preconfigured to scrape all the components listed at the beginning of Step 2. Configuring Prometheus goes beyond the scope of this article, but to learn more, you can consult Configuration from the official Prometheus docs.rules.yaml: A set of Prometheus recording rules that enable Prometheus to compute frequently needed or computationally expensive expressions, and save their results as a new set of time series. These are also generated bykubernetes-mixin, and configuring them goes beyond the scope of this article. To learn more, you can consult Recording Rules from the official Prometheus documentation.
-
prometheus-service.yaml: The Service that exposes the Prometheus StatefulSet. -
prometheus-statefulset.yaml: The Prometheus StatefulSet, configured with 2 replicas. This parameter can be scaled depending on your needs.
Example: Scaling Prometheus
To demonstrate how to modify the monitoring stack, we’ll scale the number of Prometheus replicas from 2 to 3.
Open the sammy-cluster-monitoring_manifest.yaml master manifest file using your editor of choice:
- nano sammy-cluster-monitoring_manifest.yaml
Scroll down to the Prometheus StatefulSet section of the manifest:
Output. . .
apiVersion: apps/v1beta2
kind: StatefulSet
metadata:
  name: sammy-cluster-monitoring-prometheus
  labels: &Labels
    k8s-app: prometheus
    app.kubernetes.io/name: sammy-cluster-monitoring
    app.kubernetes.io/component: prometheus
spec:
  serviceName: "sammy-cluster-monitoring-prometheus"
  replicas: 2
  podManagementPolicy: "Parallel"
  updateStrategy:
    type: "RollingUpdate"
  selector:
    matchLabels: *Labels
  template:
    metadata:
      labels: *Labels
    spec:
. . .
Change the number of replicas from 2 to 3:
Output. . .
apiVersion: apps/v1beta2
kind: StatefulSet
metadata:
  name: sammy-cluster-monitoring-prometheus
  labels: &Labels
    k8s-app: prometheus
    app.kubernetes.io/name: sammy-cluster-monitoring
    app.kubernetes.io/component: prometheus
spec:
  serviceName: "sammy-cluster-monitoring-prometheus"
  replicas: 3
  podManagementPolicy: "Parallel"
  updateStrategy:
    type: "RollingUpdate"
  selector:
    matchLabels: *Labels
  template:
    metadata:
      labels: *Labels
    spec:
. . .
When you’re done, save and close the file.
Apply the changes using kubectl apply -f:
- kubectl apply -f sammy-cluster-monitoring_manifest.yaml --namespace default
You can track progress using kubectl get pods. Using this same technique, you can update many of the Kubernetes parameters and much of the configuration for this observability stack.
Conclusion
In this tutorial, you installed a Prometheus, Grafana, and Alertmanager monitoring stack into your DigitalOcean Kubernetes cluster with a standard set of dashboards, Prometheus rules, and alerts.
You may also choose to deploy this monitoring stack using the Helm Kubernetes package manager. To learn more, consult How to Set Up DigitalOcean Kubernetes Cluster Monitoring with Helm and Prometheus. An alternative way to get a similar stack up and running is to use the DigitalOcean Marketplace Kubernetes Monitoring Stack solution, currently in beta.
The DigitalOcean Kubernetes Cluster Monitoring Quickstart repository is heavily based on and modified from Google Cloud Platform’s click-to-deploy Prometheus solution. A full manifest of modifications and changes from the original repository can be found in the Quickstart repo’s changes.md file.
Thanks for learning with the DigitalOcean Community. Check out our offerings for compute, storage, networking, and managed databases.
About the author
DevOps Engineer, Former Technical Writer and Editor at DigitalOcean. Expertise in topics including Ubuntu, Kubernetes, Docker, CentOS.
Still looking for an answer?
This textbox defaults to using Markdown to format your answer.
You can type !ref in this text area to quickly search our full set of tutorials, documentation & marketplace offerings and insert the link!
Hi,
I’m seeing an error in applying the file generated. Could you please check and suggest?
[root@cdc-centos-172 doks-monitoring]# kubectl apply -f “${APP_INSTANCE_NAME}_manifest.yaml” --namespace “${NAMESPACE}” serviceaccount/alertmanager unchanged configmap/sammy-cluster-monitoring-alertmanager-config created service/sammy-cluster-monitoring-alertmanager-operated created service/sammy-cluster-monitoring-alertmanager created configmap/sammy-cluster-monitoring-dashboards created serviceaccount/grafana unchanged configmap/sammy-cluster-monitoring-grafana-ini created configmap/sammy-cluster-monitoring-grafana-datasources created configmap/sammy-cluster-monitoring-grafana-dashboardproviders created secret/sammy-cluster-monitoring-grafana created service/sammy-cluster-monitoring-grafana created serviceaccount/kube-state-metrics unchanged clusterrole.rbac.authorization.k8s.io/kube-state-metrics unchanged clusterrolebinding.rbac.authorization.k8s.io/kube-state-metrics unchanged service/sammy-cluster-monitoring-kube-state-metrics created serviceaccount/node-exporter unchanged serviceaccount/prometheus unchanged clusterrole.rbac.authorization.k8s.io/prometheus unchanged clusterrolebinding.rbac.authorization.k8s.io/prometheus unchanged configmap/sammy-cluster-monitoring-prometheus-config created service/sammy-cluster-monitoring-prometheus created unable to recognize “sammy-cluster-monitoring_manifest.yaml”: no matches for kind “StatefulSet” in version “apps/v1beta2” unable to recognize “sammy-cluster-monitoring_manifest.yaml”: no matches for kind “StatefulSet” in version “apps/v1beta2” unable to recognize “sammy-cluster-monitoring_manifest.yaml”: no matches for kind “Deployment” in version “apps/v1beta2” unable to recognize “sammy-cluster-monitoring_manifest.yaml”: no matches for kind “DaemonSet” in version “extensions/v1beta1” unable to recognize “sammy-cluster-monitoring_manifest.yaml”: no matches for kind “StatefulSet” in version “apps/v1beta2”
Hey, it was my api version which I updated in the yaml after which it is working. Thanks for the great document.
Strange…I get the following, is there a quick fix to get around this? (I am on kubectl version 1.16.3)
$ kubectl apply -f "${APP_INSTANCE_NAME}_manifest.yaml" --namespace "${NAMESPACE}"
unable to recognize "sammy-cluster-monitoring_manifest.yaml": no matches for kind "ServiceAccount" in version "v1"
unable to recognize "sammy-cluster-monitoring_manifest.yaml": no matches for kind "ConfigMap" in version "v1"
unable to recognize "sammy-cluster-monitoring_manifest.yaml": no matches for kind "Service" in version "v1"
unable to recognize "sammy-cluster-monitoring_manifest.yaml": no matches for kind "Service" in version "v1"
unable to recognize "sammy-cluster-monitoring_manifest.yaml": no matches for kind "StatefulSet" in version "apps/v1beta2"
unable to recognize "sammy-cluster-monitoring_manifest.yaml": no matches for kind "ConfigMap" in version "v1"
unable to recognize "sammy-cluster-monitoring_manifest.yaml": no matches for kind "ServiceAccount" in version "v1"
unable to recognize "sammy-cluster-monitoring_manifest.yaml": no matches for kind "ConfigMap" in version "v1"
unable to recognize "sammy-cluster-monitoring_manifest.yaml": no matches for kind "ConfigMap" in version "v1"
unable to recognize "sammy-cluster-monitoring_manifest.yaml": no matches for kind "ConfigMap" in version "v1"
unable to recognize "sammy-cluster-monitoring_manifest.yaml": no matches for kind "Secret" in version "v1"
unable to recognize "sammy-cluster-monitoring_manifest.yaml": no matches for kind "Service" in version "v1"
unable to recognize "sammy-cluster-monitoring_manifest.yaml": no matches for kind "StatefulSet" in version "apps/v1beta2"
unable to recognize "sammy-cluster-monitoring_manifest.yaml": no matches for kind "ServiceAccount" in version "v1"
unable to recognize "sammy-cluster-monitoring_manifest.yaml": no matches for kind "ClusterRole" in version "rbac.authorization.k8s.io/v1"
unable to recognize "sammy-cluster-monitoring_manifest.yaml": no matches for kind "ClusterRoleBinding" in version "rbac.authorization.k8s.io/v1"
unable to recognize "sammy-cluster-monitoring_manifest.yaml": no matches for kind "Deployment" in version "apps/v1beta2"
unable to recognize "sammy-cluster-monitoring_manifest.yaml": no matches for kind "Service" in version "v1"
unable to recognize "sammy-cluster-monitoring_manifest.yaml": no matches for kind "ServiceAccount" in version "v1"
unable to recognize "sammy-cluster-monitoring_manifest.yaml": no matches for kind "DaemonSet" in version "extensions/v1beta1"
unable to recognize "sammy-cluster-monitoring_manifest.yaml": no matches for kind "ServiceAccount" in version "v1"
unable to recognize "sammy-cluster-monitoring_manifest.yaml": no matches for kind "ClusterRole" in version "rbac.authorization.k8s.io/v1beta1"
unable to recognize "sammy-cluster-monitoring_manifest.yaml": no matches for kind "ClusterRoleBinding" in version "rbac.authorization.k8s.io/v1beta1"
unable to recognize "sammy-cluster-monitoring_manifest.yaml": no matches for kind "ConfigMap" in version "v1"
unable to recognize "sammy-cluster-monitoring_manifest.yaml": no matches for kind "Service" in version "v1"
unable to recognize "sammy-cluster-monitoring_manifest.yaml": no matches for kind "StatefulSet" in version "apps/v1beta2"
I am getting ‘pod has unbound immediate PersistentVolumeClaims’ and ‘0/1 nodes are available: 1 Insufficient memory.’ (despite having a fresh droplet with 4GB), after applying the config on step 2. Any ideas on what am I missing?
nice tutorial. It was helpful to setup this solution onto our k8s version with some modifications to manifest files.
It is deployed on the cluster, I could see the metrics on the prometheus but when i go to grafana dashboard, i don’t see the values in the graphs.
Any pointers to troubleshoot it?
Hi,
Nice article. I set it up correctly following this but I do not see any container related metric in prometheus.
Due to that the dashboard are also showing No data points.
Is there something I am missing here. I am a beginner at this, any help will be appreciated.
I commend you for posting something that works (where other DO tutorials on this subject do not work) but what you get from this is something that is nearly impossible to maintain or configure. I have spent days trying to apply the simplest imaginable configuration change (literally two lines of configuration) to add a single pod target to the Prometheus configuration and am throwing in the towel as there is simply no way to troubleshoot dozens of lines of garbled YAML.
At the very least this tutorial should call out that this will get you an interesting setup, but that any meaningful modifications are likely to be difficult if not impossible.
Not sure if this is still current or bug-free - I got a lot of “No data points” as did other users… What I would really like is a simple setup for Prometheus only (not the full Grafana stack) that INTEGRATES with the kube-state-metrics advice that DO already gives here: https://www.digitalocean.com/docs/kubernetes/how-to/monitor-advanced/
I don’t want to run multiple kube-state-metrics if I can help it…
 This work is licensed under a Creative Commons Attribution-NonCommercial- ShareAlike 4.0 International License.
Become a contributor for community
Get paid to write technical tutorials and select a tech-focused charity to receive a matching donation.

DigitalOcean Documentation
Full documentation for every DigitalOcean product.

Resources for startups and AI-native businesses
The Wave has everything you need to know about building a business, from raising funding to marketing your product.
The developer cloud
Scale up as you grow — whether you're running one virtual machine or ten thousand.

Start building today
From GPU-powered inference and Kubernetes to managed databases and storage, get everything you need to build, scale, and deploy intelligent applications.
