By Alex Garnett
Senior DevOps Technical Writer

Status: Deprecated
This article is deprecated and no longer maintained.
Reason
The TOBS installer has been deprecated upstream.
See Instead
The official TOBS documentation.
Introduction
TOBS, short for The Observability Stack, is a pre-packaged distribution of monitoring tools and dashboard interfaces which can be installed into any existing Kubernetes cluster. It includes many of the most popular open-source observability tools with Prometheus and Grafana as a baseline, including Promlens, TimescaleDB, Alertmanager, and others. Together, these provide a straightforward, maintainable solution for analyzing server traffic and identifying any potential problems with a deployment up to a very large scale.
TOBS makes use of standard Kubernetes Helm charts in order to configure and update deployments. It can be installed into any Kubernetes cluster, but it can be demonstrated more effectively if you’re running kubectl to manage your cluster from a local machine rather than a remote node. DigitalOcean’s Managed Kubernetes will provide you with a configuration like this by default.
In this tutorial, you will install TOBS into an existing Kubernetes cluster, and learn how to update, configure, and browse its component dashboards.
Prerequisites
To follow this tutorial, you will need:
-
A Kubernetes cluster with role-based access control (RBAC) enabled. This setup will use a DigitalOcean Kubernetes cluster, but you are free to create a cluster using another method. Your Kubernetes version should match a supported TOBS version.
-
The
kubectlcommand-line tool installed on your local machine and configured to connect to your cluster. You can read more about installingkubectlin the official documentation. If you are using a DigitalOcean Kubernetes cluster, please refer to How to Connect to a DigitalOcean Kubernetes Cluster to learn how to connect to your cluster usingkubectl.
Step 1 — Verifying your Kubernetes Configuration
In order to install TOBS, you should first have a valid Kubernetes configuration set up with kubectl from which you can ping your worker nodes. You can test this by running kubectl get nodes:
- kubectl get nodes
If kubectl is able to connect to your Kubernetes cluster and it’s up and running as expected, this command will return a list of nodes with the Ready status:
OutputNAME                   STATUS   ROLES    AGE   VERSION
pool-uqv8a47h0-ul5a7   Ready    <none>   22m   v1.21.5
pool-uqv8a47h0-ul5am   Ready    <none>   21m   v1.21.5
pool-uqv8a47h0-ul5aq   Ready    <none>   21m   v1.21.5
If this is successful, you can move on to Step 2. If not, you should review your configuration details for any issues.
By default, kubectl will look for a file at ~/.kube/config in order to understand your environment. In order to verify that this file exists and contains valid YAML syntax, you can run head on it to view its first several lines, i:
- head ~/.kube/config
OutputapiVersion: v1
clusters:
- cluster:
    certificate-authority-data:
…
If the file does not exist, ensure that you are logged in as the same user that you configured Kubernetes with. ~/ paths reflect individual users’ home directories, and Kubernetes configurations are saved per-user by default.
If you are using DigitalOcean’s Managed Kubernetes, ensure that you have run the doctl kubernetes cluster kubeconfig save command after setting up a cluster so that your local machine can authenticate to it. This will create a ~/.kube/config file:
- doctl kubernetes cluster kubeconfig save your-cluster-name
If you are using this machine to access multiple clusters, you should review the Kubernetes documentation on using environment variables and multiple configuration files in order to avoid conflicts. After configuring your kubectl environment, you can move on to installing TOBS in the next step.
Step 2 — Installing TOBS and Testing Your Endpoints
TOBS includes the following components:
- Prometheus is a time series database and monitoring tool that works by polling metrics endpoints and scraping and processing the data exposed by these endpoints. It allows you to query this data using PromQL, a time series data query language.
- Alertmanager, usually deployed alongside Prometheus, forms the alerting layer of the stack, handling alerts generated by Prometheus and deduplicating, grouping, and routing them to integrations like email or PagerDuty. To learn more about Alertmanager, consult the Prometheus documentation on alerting.
- Grafana is a data visualization and analytics tool that allows you to build dashboards and graphs for your metrics data.
- kube-state-metrics is an add-on agent that listens to the Kubernetes API server and generates metrics about the state of Kubernetes objects like Deployments and Pods. These metrics are served as plaintext on HTTP endpoints and consumed by Prometheus.
- Lastly is node-exporter, a Prometheus exporter that runs on cluster nodes and provides OS and hardware metrics like CPU and memory usage to Prometheus. These metrics are also served as plaintext on HTTP endpoints and consumed by Prometheus.
In order to install TOBS, you first need to run the TOBS installer on your control-plane. This will set up the tobs command and configuration directories. As mentioned in the prerequisites, the tobs command is only designed to work on Linux/macOS/BSD systems (like the official Kubernetes binaries), so if you have been using Windows up to now, you should be working in the Windows Subsystem for Linux environment.
Retrieve and run the TOBS installer:
- curl --proto '=https' --tlsv1.2 -sSLf https://tsdb.co/install-tobs-sh |sh
Outputtobs 0.7.0 was successfully installed 🎉

Binary is available at /root/.local/bin/tobs.
You can now push TOBS to your Kubernetes cluster. This is done by a one-liner using your newly-provided tobs command:
- tobs install
This will generate several lines of output and may take a few moments. Depending on your exact version of Kubernetes, there may be several warnings in the output, but you can ignore these as long as you eventually receive the Welcome to tobs message:
OutputWARNING: Using a generated self-signed certificate for TLS access to TimescaleDB.
         This should only be used for development and demonstration purposes.
         To use a signed certificate, use the "--tls-timescaledb-cert" and "--tls-timescaledb-key"
         flags when issuing the tobs install command.

Creating TimescaleDB tobs-certificate secret
Creating TimescaleDB tobs-credentials secret
skipping to create TimescaleDB s3 backup secret as backup option is disabled.
2022/01/10 11:25:34 Transport: unhandled response frame type *http.http2UnknownFrame
2022/01/10 11:25:35 Transport: unhandled response frame type *http.http2UnknownFrame
2022/01/10 11:25:35 Transport: unhandled response frame type *http.http2UnknownFrame
Installing The Observability Stack
2022/01/10 11:25:37 Transport: unhandled response frame type *http.http2UnknownFrame
W0110 11:25:55.438728   75479 warnings.go:70] policy/v1beta1 PodSecurityPolicy is deprecated in v1.21+, unavailable in v1.25+
W0110 11:25:55.646392   75479 warnings.go:70] policy/v1beta1 PodSecurityPolicy is deprecated in v1.21+, unavailable in v1.25+
…
👋🏽 Welcome to tobs, The Observability Stack for Kubernetes
…
The output from this point onward will contain instructions for connecting to each of Prometheus, TimescaleDB, PromLens, and Grafana’s web endpoints in your browser. It is reproduced in full below for reference:
Output###############################################################################
🔥 PROMETHEUS NOTES:
###############################################################################

Prometheus can be accessed via port 9090 on the following DNS name from within your cluster:
tobs-kube-prometheus-prometheus.default.svc.cluster.local

Get the Prometheus server URL by running these commands in the same shell:
  tobs prometheus port-forward


The Prometheus alertmanager can be accessed via port 9093 on the following DNS name from within your cluster:
tobs-kube-prometheus-alertmanager.default.svc.cluster.local


Get the Alertmanager URL by running these commands in the same shell:
  export POD_NAME=$(kubectl get pods --namespace default -l "app=alertmanager,alertmanager=tobs-kube-prometheus-alertmanager" -o jsonpath="{.items[0].metadata.name}")
  kubectl --namespace default port-forward $POD_NAME 9093
WARNING! Persistence is disabled on AlertManager.
         You will lose your data when the AlertManager pod is terminated.

###############################################################################
🐯 TIMESCALEDB NOTES:
###############################################################################

TimescaleDB can be accessed via port 5432 on the following DNS name from within your cluster:
tobs.default.svc.cluster.local

To get your password for superuser run:
    tobs timescaledb get-password -U <user>

To connect to your database, chose one of these options:

1. Run a postgres pod and connect using the psql cli:
    tobs timescaledb connect -U <user>

2. Directly execute a psql session on the master node
   tobs timescaledb connect -m


###############################################################################
🧐 PROMLENS NOTES:
###############################################################################
   PromLens is a PromQL query builder, analyzer, and visualizer.

   You can access PromLens via a local browser by executing:
    tobs promlens port-forward

   Then you can point your browser to http://127.0.0.1:8081/.
###############################################################################
📈 GRAFANA NOTES:
###############################################################################

1. The Grafana server can be accessed via port 80 on
   the following DNS name from within your cluster:
   tobs-grafana.default.svc.cluster.local

   You can access grafana locally by executing:
    tobs grafana port-forward

   Then you can point your browser to http://127.0.0.1:8080/.

2. The 'admin' user password can be retrieved by:
    tobs grafana get-password

3. You can reset the admin user password with grafana-cli from inside the pod.
    tobs grafana change-password <password-you-want-to-set>
Each of this is provided with a DNS name internal to your cluster so that they can be accessed from any of your worker nodes, e.g. tobs-kube-prometheus-alertmanager.default.svc.cluster.local for Prometheus. In addition, there is a port forwarding command configured for each that allows you to access them from a local web browser.
In a new terminal, run tobs prometheus port-forward:
- tobs prometheus port-forward
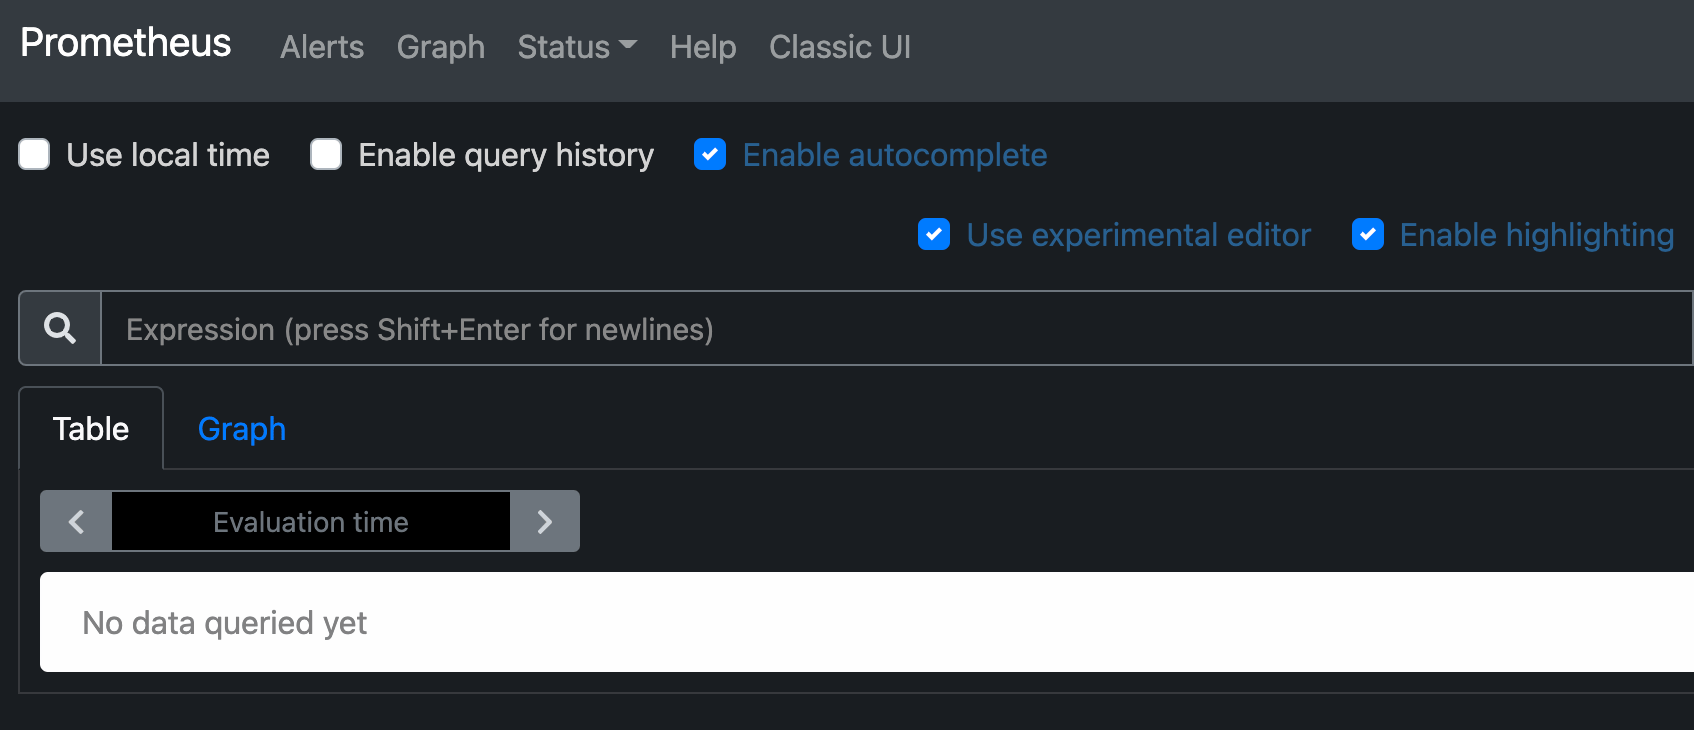
This will occupy the terminal as long as the port forwarding process is active. You can press Ctrl+C to gracefully quit a blocking process such as this one when you want to stop forwarding the port. Next, in a web browser, go to the URL http://127.0.0.1:9090/. You should see the full Prometheus interface running and producing metrics from your cluster:
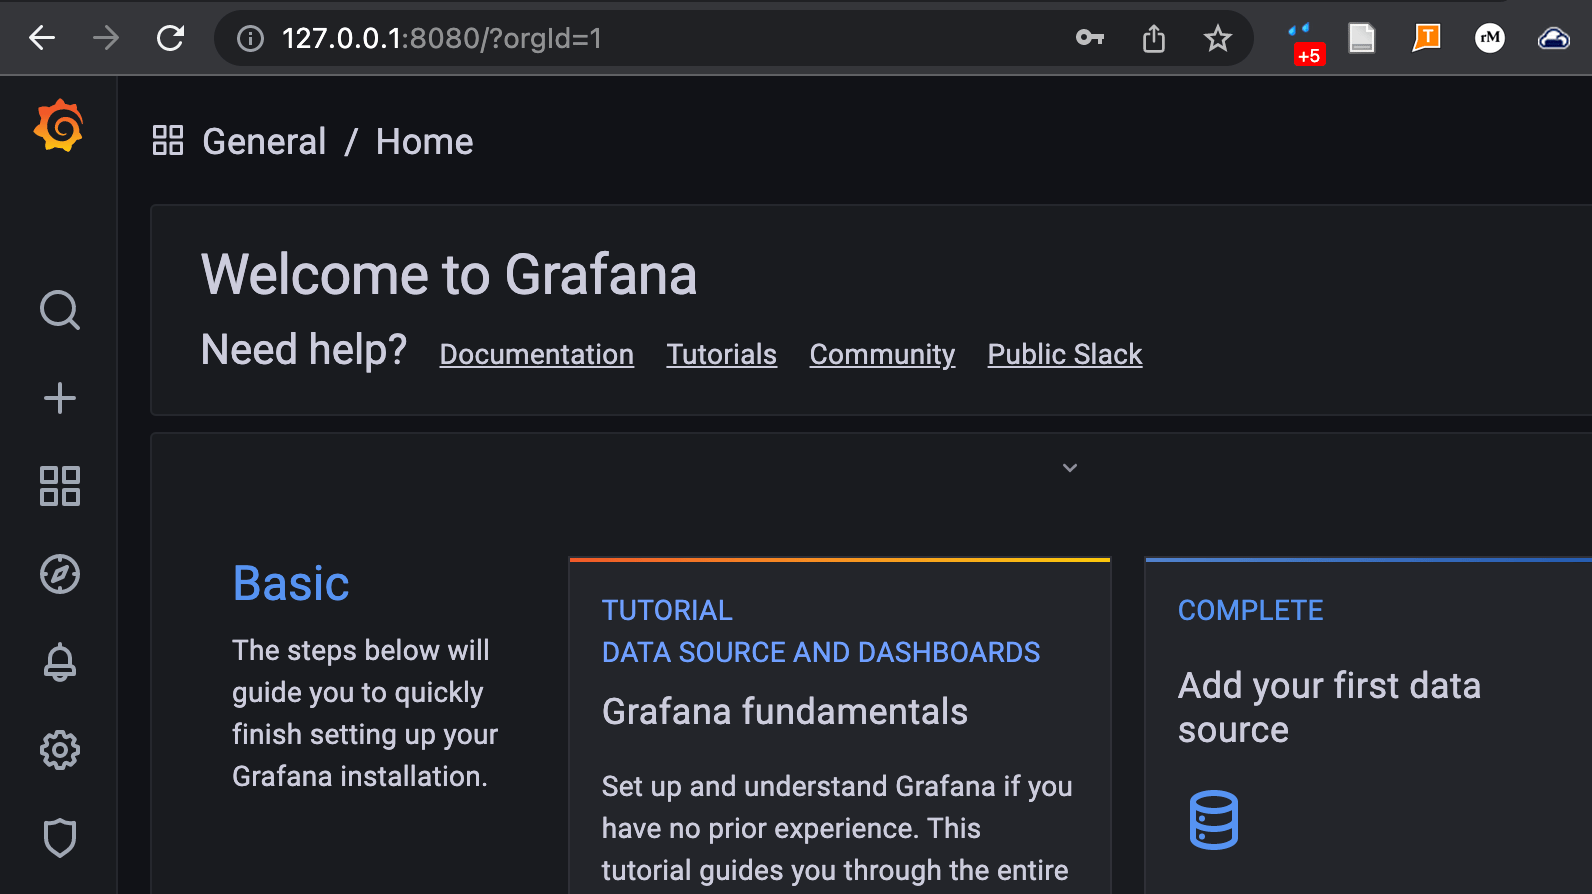
You can do the same for Grafana, which is accessible at http://127.0.0.1:8080/ as long as port forwarding is active in another process. First, you’ll need to use the get-password command provided by the installer output:
- tobs grafana get-password
Outputyour-grafana-password
You can then use this password to log into the Grafana interface by running its port forwarding command and opening http://127.0.0.1:8080/ in your browser.
- tobs grafana port-forward
You now have a working TOBS stack running in your Kubernetes cluster. You can refer to the individual components’ documentation in order to learn their respective features. In the last step of this tutorial, you’ll learn how to make updates to the TOBS configuration itself.
Step 3 — Editing TOBS Configurations and Upgrading
TOBS’ configuration contains some parameters for the individual applications in the stack, as well as some parameters for the TOBS deployment itself. It is generated and stored as a Kubernetes Helm chart. You can output your current configuration by running tobs helm show-values. However, this will output the entire long configuration to your terminal, which can be difficult to read. You can instead redirect the output to a file with the .yaml extension, because Helm charts are all valid YAML syntax:
- tobs helm show-values > values.yaml
The file contents will look like this:
2022/01/10 11:56:37 Transport: unhandled response frame type *http.http2UnknownFrame
# Values for configuring the deployment of TimescaleDB
# The charts README is at:
#    https://github.com/timescale/timescaledb-kubernetes/tree/master/charts/timescaledb-single
# Check out the various configuration options (administration guide) at:
#    https://github.com/timescale/timescaledb-kubernetes/blob/master/charts/timescaledb-single/admin-guide.md
cli: false

# Override the deployment namespace
namespaceOverride: ""
…
You can review the additional parameters available for TOBS’ configuration by reading the TOBS documentation
If you ever modify this file in order to update your deployment, you can re-install TOBS over itself using the updated configuration. Just pass the -f option to the tobs install command with the YAML file as an additional argument:
- tobs install -f values.yaml
Finally, you can upgrade TOBS with the following command:
- tobs upgrade
This performs the equivalent of a helm upgrade by fetching the newest upstream chart.
Conclusion
In this tutorial, you learned to deploy and configure TOBS, The Observability Stack, on an existing Kubernetes cluster. TOBS is particularly helpful because it eliminates the need to individually maintain configuration details for each of these apps, while providing standardized monitoring for the applications running on your cluster.
Next, you might want to learn how to use Cert-Manager to handle HTTPS ingress to your Kubernetes cluster.
Thanks for learning with the DigitalOcean Community. Check out our offerings for compute, storage, networking, and managed databases.
About the author
Former Senior DevOps Technical Writer at DigitalOcean. Expertise in topics including Ubuntu 22.04, Linux, Rocky Linux, Debian 11, and more.
Still looking for an answer?
This textbox defaults to using Markdown to format your answer.
You can type !ref in this text area to quickly search our full set of tutorials, documentation & marketplace offerings and insert the link!
This comment has been deleted
I am unsure if tobs is realy the best way to get Prometheus and Grafana up and running.
I have the impression, that tobs was created by the company Timescale to promote their product TimescaleDB.
 This work is licensed under a Creative Commons Attribution-NonCommercial- ShareAlike 4.0 International License.
Become a contributor for community
Get paid to write technical tutorials and select a tech-focused charity to receive a matching donation.

DigitalOcean Documentation
Full documentation for every DigitalOcean product.

Resources for startups and AI-native businesses
The Wave has everything you need to know about building a business, from raising funding to marketing your product.
The developer cloud
Scale up as you grow — whether you're running one virtual machine or ten thousand.

Start building today
From GPU-powered inference and Kubernetes to managed databases and storage, get everything you need to build, scale, and deploy intelligent applications.
