By Hathy A and Hazel Virdó

Introduction
Prometheus is an open source monitoring system developed by SoundCloud. Like other monitoring systems, such as InfluxDB and Graphite, Prometheus stores all its data in a time series database. However, it offers a multi-dimensional data-model and a powerful query language, allowing system administrators to not only easily fine tune the definitions of their metrics, but also generate more accurate reports.
Additionally, the Prometheus project also includes PromDash (a browser-based tool that can be used to develop custom dashboards) and an experimental AlertManager capable of sending alerts via e-mail, Flowdock, Slack, HipChat and more.
In this tutorial, you will learn how to install, configure, and use the Prometheus Server, Node Exporter, and PromDash.
Prerequisites
To follow this tutorial, you will need:
- One 64-bit CentOS 7 Droplet
- A non-root sudo user, preferably one named prometheus.
Step 1 — Installing Prometheus Server
First, create a new directory to store all the files you download in this tutorial and move to it.
- mkdir ~/Downloads
- cd ~/Downloads
Use curl to download the latest build of the Prometheus server and time-series database from GitHub.
- curl -LO "https://github.com/prometheus/prometheus/releases/download/0.16.0/prometheus-0.16.0.linux-amd64.tar.gz"
The Prometheus monitoring system consists of several components, each of which needs to be installed separately. Keeping all the components inside one parent directory is a good idea, so create one using mkdir.
- mkdir ~/Prometheus
Enter the directory you just created.
- cd ~/Prometheus
Use tar to extract prometheus-0.16.0.linux-amd64.tar.gz.
- tar -xvzf ~/Downloads/prometheus-0.16.0.linux-amd64.tar.gz
This completes the installation of Prometheus server. Verify the installation by typing in the following command:
- ~/Prometheus/prometheus-0.16.0.linux-amd64/prometheus -version
You should see the following message on your screen:
prometheus, version 0.16.0 (branch: HEAD, revision: dcb8ba4)
  build user:       julius@desktop
  build date:       20151009-23:51:17
  go version:       1.5.1
Step 2 — Installing Node Exporter
Prometheus was developed for the purpose of monitoring web services. In order to monitor the metrics of your CentOS server, you should install a tool called Node Exporter. Node Exporter, as its name suggests, exports lots of metrics (such as disk I/O statistics, CPU load, memory usage, network statistics, and more) in a format Prometheus understands.
Enter the Downloads directory and use curl to download the latest build of Node Exporter which is available on GitHub.
- cd ~/Downloads && curl -LO "https://github.com/prometheus/node_exporter/releases/download/0.11.0/node_exporter-0.11.0.linux-amd64.tar.gz"
Create a new directory called node_exporter inside the Prometheus directory, and get inside it:
- mkdir ~/Prometheus/node_exporter
- cd ~/Prometheus/node_exporter
You can now use the tar command to extract node_exporter-0.11.0.linux-amd64.tar.gz.
- tar -xvzf ~/Downloads/node_exporter-0.11.0.linux-amd64.tar.gz
Step 3 — Running Node Exporter as a Service
To make it easy to start and stop Node Exporter, let us now convert it into a service.
Use vi or any other text editor to create a unit configuration file called node_exporter.service.
- sudo vi /etc/systemd/system/node_exporter.service
This file should contain the path of the node_exporter executable, and also specify which user should run the executable. Accordingly, add the following code:
[Unit]
Description=Node Exporter

[Service]
User=prometheus
ExecStart=/home/prometheus/Prometheus/node_exporter/node_exporter

[Install]
WantedBy=default.target
Save the file and exit the text editor.
Reload systemd so that it reads the configuration file you just created.
- sudo systemctl daemon-reload
At this point, Node Exporter is available as a service which can be managed using the systemctl command. Enable it so that it starts automatically at boot time.
- sudo systemctl enable node_exporter.service
You can now either reboot your server, or use the following command to start the service manually:
- sudo systemctl start node_exporter.service
Once it starts, use a browser to view Node Exporter’s web interface, which is available at http://your_server_ip:9100/metrics. You should see a page with a lot of text:
# HELP go_gc_duration_seconds A summary of the GC invocation durations.
# TYPE go_gc_duration_seconds summary
go_gc_duration_seconds{quantile="0"} 0.00023853100000000002
go_gc_duration_seconds{quantile="0.25"} 0.00023998700000000002
go_gc_duration_seconds{quantile="0.5"} 0.00028122
. . .
Step 4 — Starting Prometheus Server
Enter the directory where you installed the Prometheus server:
cd ~/Prometheus/prometheus-0.16.0.linux-amd64
Before you start Prometheus, you must first create a configuration file for it called prometheus.yml.
- vi ~/Prometheus/prometheus-0.16.0.linux-amd64/prometheus.yml
Copy the following code into the file.
scrape_configs:
  - job_name: "node"
    scrape_interval: "15s"
    target_groups:
    - targets: ['localhost:9100']
This creates a scrape_configs section and defines a job called node. It includes the URL of your Node Exporter’s web interface in its array of targets. The scrape_interval is set to 15 seconds so that Prometheus scrapes the metrics once every fifteen seconds.
You could name your job anything you want, but calling it “node” allows you to use the default console templates of Node Exporter.
Save the file and exit.
Start the Prometheus server as a background process.
- nohup ./prometheus > prometheus.log 2>&1 &
Note that you redirected the output of the Prometheus server to a file called prometheus.log. You can view the last few lines of the file using the tail command:
- tail ~/Prometheus/prometheus-0.16.0.linux-amd64/prometheus.log
Once the server is ready, you will see the following messages in the file:
INFO[0000] Starting target manager...         file=targetmanager.go line=75
INFO[0000] Listening on :9090                 file=web.go line=118
Use a browser to visit Prometheus’s homepage available at http://your_server_ip:9090. You’ll see the following homepage.

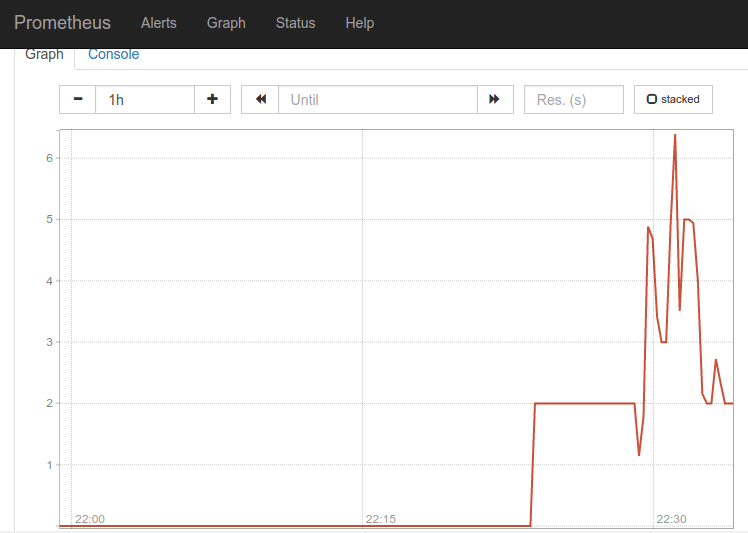
To make sure that Prometheus is scraping data from Node Exporter, click on the Graph tab at the top of the page. On the page that opens, type in the name of a metric (like node_procs_running, for example) in the text field that says Expression. Then, press the blue Execute button. Click Graph (next to Console) just below, and you should see a graph for that metric:
Prometheus has console templates that let you view graphs of a few commonly used metrics. These console template are accessible only if you set the value of job_name to node in Prometheus’s configuration.
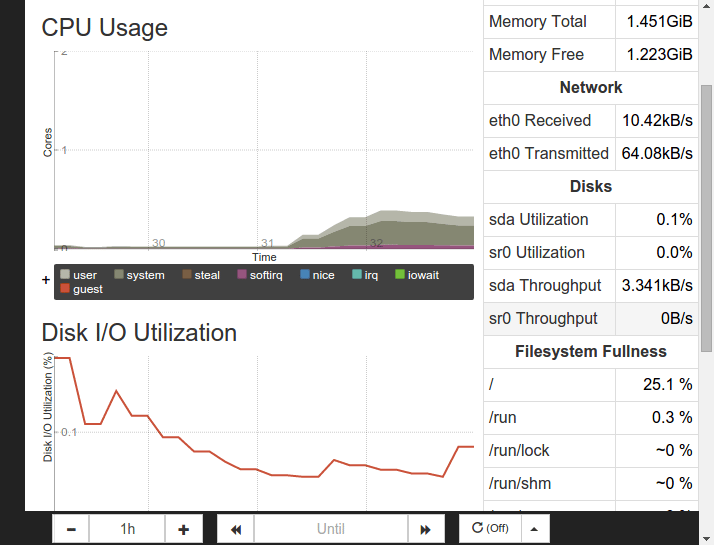
Visit http://your_server_ip:9090/consoles/node.html to access the Node Console and click on your server, localhost:9100, to view its metrics:
Step 5 — Installing PromDash
Though the Prometheus server allows you to view graphs and experiment with expressions, it is generally used only for debugging purposes or to run one-off queries. The preferred way to visualize the data in Prometheus’s time-series database is to use PromDash, a tool that allows you to create custom dashboards which are not only highly configurable but also better-looking.
Enter the Prometheus directory:
- cd ~/Prometheus
PromDash is a Ruby on Rails application whose source files are available on GitHub. In order to download and run it, you need to install Git, Ruby and a few build tools. Use yum to do so.
- sudo yum install git ruby ruby-devel sqlite-devel zlib-devel gcc gcc-c++ automake patch
You can now use the git command to download the source files.
- git clone https://github.com/prometheus/promdash.git
Enter the promdash directory.
- cd ~/Prometheus/promdash
PromDash depends on several Ruby gems. In order to automate the installation of those gems, you should install a gem called bundler.
- gem install bundler
You can now use the bundle command to install all the Ruby gems that PromDash requires. As we will be configuring PromDash to work with SQLite3 in this tutorial, make sure you exclude the gems for MySQL and PostgreSQL using the --without parameter:
- bundle install --without mysql postgresql
You might have to wait for a few minutes for this command to complete. Once done, you should see the following messages:
. . .
Your bundle is complete!
Gems in the groups mysql and postgresql were not installed.
Use `bundle show [gemname]` to see where a bundled gem is installed.
Step 6 — Setting Up the Rails Environment
Create a directory to store the SQLite3 databases associated with PromDash.
- mkdir ~/Prometheus/databases
PromDash uses an environment variable called DATABASE_URL to determine the name of the the database associated with it. Type in the following so that PromDash creates a SQLite3 database called mydb.sqlite3 inside the databases directory:
- echo "export DATABASE_URL=sqlite3:$HOME/Prometheus/databases/mydb.sqlite3" >> ~/.bashrc
In this tutorial, you will be running PromDash in production mode, so set the RAILS_ENV environment variable to production.
- echo "export RAILS_ENV=production" >> ~/.bashrc
Apply the changes we made to the .bashrc file.
- . ~/.bashrc
Next, create PromDash’s tables in the SQLite3 database using the rake tool.
- rake db:migrate
Because PromDash uses the Rails Asset Pipeline, all the assets(CSS files, images and Javascript files) of the PromDash project should be precompiled. Type in the following to do so:
- rake assets:precompile
Step 7 — Starting and Configuring PromDash
PromDash runs on Thin, a light-weight web server. Start the server as a daemon by typing in the following command:
- bundle exec thin start -d
Wait for a few seconds for the server to start and then visit http://your_server_ip:3000/ to view PromDash’s homepage.
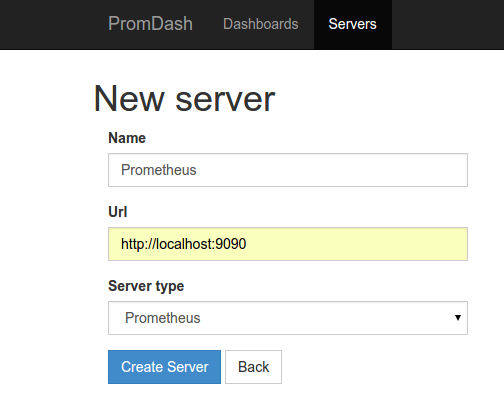
Before you start creating your custom dashboards, you should let PromDash know the URL of your Prometheus server. You can do so by clicking on the Servers tab at the top. Click New Server, then in the form, give any name to your Prometheus server. Set the Url field to http://your_server_ip:9090 and the Server type field to Prometheus.
Finally, click on Create Server to complete the configuration. Your page will say Server was successfully created. and you can click back to Dashboards in the top menu.
Step 8 — Creating a Dashboard
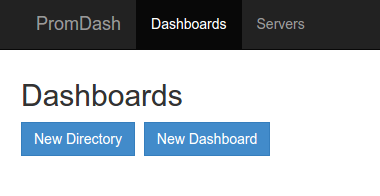
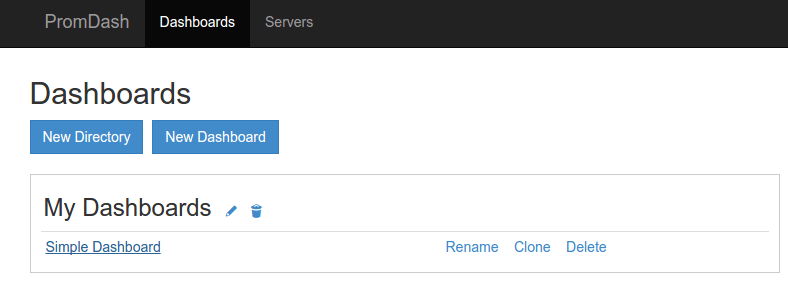
Because a Promdash dashboard should belong to a Promdash directory, first create a new directory by clicking on the New Directory. In the form that shows up, give a name to your directory, like My Dashboards, then click Create Directory.
Once you submit the form, you will be taken back to the homepage. Click on the New Dashboard button now to create a new dashboard. In the form shown, give a name to your dashboard, like Simple Dashboard and select the directory you just created from the drop-down menu.
After submitting the form, you will be able to see the new dashboard.
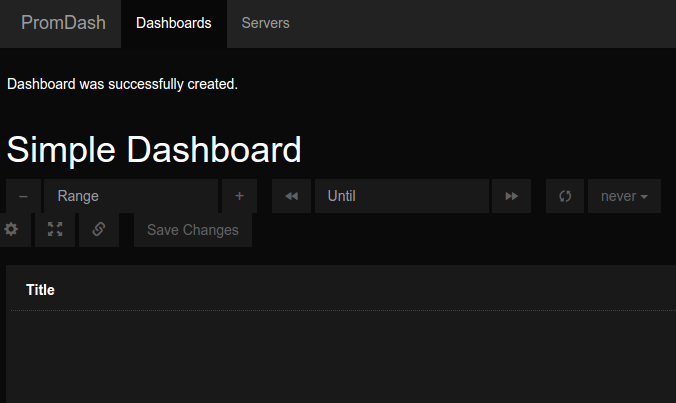
Your dashboard already has one graph, but it needs to be configured. Hovering over the graph’s header (which says Title) will reveal various icons that let you configure the graph. To change its title, you can click on the Graph and Axis Settings icon (fourth from the left) and type in a new title in the Graph Title field.
Click on the Datasources icon, which is the second to the left, to add one or more expressions to the graph. Click Add Expression, and in the field that says Enter Expression, enter node_procs_running.
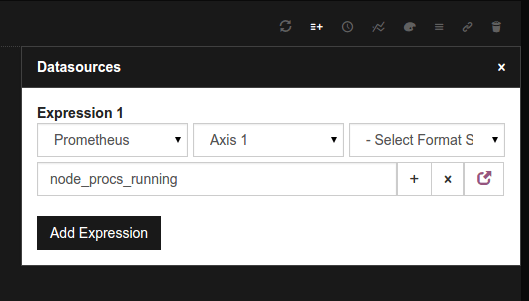
Now click on the Refresh icon (the leftmost one) in the graph’s header to update the graph. Your dashboard now contains one fully configured graph. You can add more graphs by clicking on the Add Graph button at the bottom.
After making all the changes, make sure you click on the Save Changes button on the right to make your changes permanent. The next time you visit PromDash’s homepage, you will be able to see a link to your dashboard:
Conclusion
You now have a fully functional Prometheus ecosystem running on your CentOS 7 server, and you can use PromDash to create monitoring dashboards that suit your requirements.
Even though you installed all the components on a single CentOS machine, you can easily monitor more machines by installing only Node Exporter on each of them, and adding the URLs of the new Node Exporters to the targets array of prometheus.yml.
You can learn more about Prometheus by referring to its documentation.
Thanks for learning with the DigitalOcean Community. Check out our offerings for compute, storage, networking, and managed databases.
About the author(s)
Hathy is an independent developer and blogger who loves tinkering with new frameworks, SDKs and devices.
former DO tech editor publishing articles here with the community, then founded the DO product docs team (https://do.co/docs). to all of my authors: you are incredible. working with you was a gift. love is what makes us great.
Still looking for an answer?
This textbox defaults to using Markdown to format your answer.
You can type !ref in this text area to quickly search our full set of tutorials, documentation & marketplace offerings and insert the link!
I got stuck when start the node_exporter.service. After starting and enabling the service, i checked the status of it: ● node_exporter.service - Node Exporter Loaded: loaded (/etc/systemd/system/node_exporter.service; enabled; vendor preset: disabled) Active: failed (Result: exit-code) since Tue 2016-02-09 06:33:28 UTC; 8s ago Process: 2752 ExecStart=/root/download/prometheus/node_exporter/node_exporter (code=exited, status=217/USER) Main PID: 2752 (code=exited, status=217/USER)
Feb 09 06:33:28 ip-10-0-7-118.ap-northeast-1.compute.internal systemd[1]: Started Node Exporter. Feb 09 06:33:28 ip-10-0-7-118.ap-northeast-1.compute.internal systemd[1]: Starting Node Exporter… Feb 09 06:33:28 ip-10-0-7-118.ap-northeast-1.compute.internal systemd[1]: node_exporter.service: main process exited, co…SER Feb 09 06:33:28 ip-10-0-7-118.ap-northeast-1.compute.internal systemd[1]: Unit node_exporter.service entered failed state. Feb 09 06:33:28 ip-10-0-7-118.ap-northeast-1.compute.internal systemd[1]: node_exporter.service failed. Hint: Some lines were ellipsized, use -l to show in full. What happend?
What would be the memory impact of this installation? How much memory/cpu this would consume on my vps? It is important to know this before installation :)
As far as I can see, neither documentation nor various tutorials such as this one, mention creating a systemd service for prometheus itself, the way it’s created for the node exporter? I guess I’m missing something, I’ve just started exploring Prometheus, would someone care to explain? Thanx.
The title is wrong on the node_exporter service config file. Looks like it copied from the Ubuntu version: /etc/init/node_exporter.conf -> /etc/systemd/system/node_exporter.service The contents are right just the title is wrong.
I got stuck when start bundle exec thin start -d.
bundle exec thin start -d
bundler: command not found: thin
Install missing gem executables with `bundle install`
 This work is licensed under a Creative Commons Attribution-NonCommercial- ShareAlike 4.0 International License.
Become a contributor for community
Get paid to write technical tutorials and select a tech-focused charity to receive a matching donation.

DigitalOcean Documentation
Full documentation for every DigitalOcean product.

Resources for startups and AI-native businesses
The Wave has everything you need to know about building a business, from raising funding to marketing your product.
The developer cloud
Scale up as you grow — whether you're running one virtual machine or ten thousand.

Start building today
From GPU-powered inference and Kubernetes to managed databases and storage, get everything you need to build, scale, and deploy intelligent applications.
