By Adrien Payong and Shaoni Mukherjee

Introduction
Building autonomous agents with LLMs can be a frustrating and unreliable experience. Prompts can produce different outputs from run to run, tools may break silently, and models can hallucinate or loop with no clear indicators. LangSmith is a platform for instrumenting, debugging, evaluating, and monitoring LLM apps to overcome these challenges and provide end-to-end visibility into your agent’s behavior. In this tutorial, we will go through a typical agent reliability loop: instrumenting an agent with tracing, debugging agent runs automatically and manually, evaluating its performance, iterating on prompts, and finally, monitoring the agent in production. By the end, you should have an understanding of what LangSmith is, how it can help, and how to use it to build more reliable AI agents.
Key Takeaways
- Observability is foundational for agent reliability: With LangSmith’s tracing, every LLM call, tool invocation, and intermediate reasoning step is observable, so you can understand why an agent took a certain action instead of having to infer it from the logs.
- Traces turn debugging into analysis: Structured traces allow you to inspect and methodically diagnose prompt failures, tool failures, retrieval issues, orchestration bugs, and fix the exact point of failure.
- Evaluation enables safe iteration: LangSmith’s dataset-driven evaluation workflow (available both offline and online) allows you to measure your application’s quality, compare prompt/model versions, and detect regressions before you release any changes to production.
- Prompt engineering becomes disciplined: The Prompt Playground and prompt versioning turn prompts into a first-class, trackable asset. This allows you to collaborate on prompts, ensure reproducibility, and control when and how changes are promoted to production.
- Human feedback completes the loop: Annotation queues (single-run and pairwise) allow you to effectively leverage human judgment at scale, improve evaluators, and ensure quality where automated metrics fall short.
What is LangSmith (and When It’s Worth Using)
LangSmith is an end-to-end toolkit for building, debugging, testing, evaluating, and deploying your LLM-powered apps. Using Langsmith, you can:
- Trace each request (capture every step of an agent’s reasoning).
- Evaluate your output (make sure your agent is quality-generating).
- Iterate on your prompts with version control.
- Manage your agent deployments.
Unlike some of the observability tools, which are often tightly coupled to a particular LLM application framework, LangSmith is framework-agnostic. You can use it with LangChain, LangGraph, or other custom code. That means you don’t need to build your agent on LangChain to take advantage of LangSmith’s tracing and evaluation features.
It’s useful in any case where the prompts call other tools or APIs, or you are dealing with multi-step reasoning, or any case where reproducibility and debugging are important. Basically, if you’ve outgrown the limit of simple log statements and want to be able to understand why your agent did what it did, then you should check out LangSmith.
The Agent Debugging Problem LangSmith Solves
Developing autonomous agents is challenging because agents often fail in subtle and unintuitive ways. A small change to a prompt or a non-deterministic response from a tool API call can drastically alter a chain of reasoning. Standard logs and metrics aren’t sufficient for understanding the actions of an agent; you may see an agent return an incorrect result or timeout, but the source of the failure isn’t immediately obvious. Did the agent use the wrong tool for the job? Did it have missing context in its prompt? Did an LLM call introduce a subtle error that manifested downstream? These are the kinds of questions that LangSmith’s traces can help answer.
Debugging agents without detailed traces can turn into a game of guessing. Agents can fail silently by hallucinating or getting stuck in a loop, and you’re left to blindly reproduce issues. LangSmith addresses this by recording every step of the agent’s journey (all LLM calls, tool invocations, intermediate prompts, etc.) into a structured timeline called a trace. Examining a trace allows you to see exactly what went wrong.
Example: Suppose you have an agent who calls a search tool to look up information. If the agent produces an incorrect answer, the problem might be that: (1) the search tool gave back an incorrect answer or no results at all (tool failure), (2) the LLM not using the search results and hallucinating a response (prompt/reasoning failure), or (3) the agent logic not calling the tool when it should (orchestration failure).
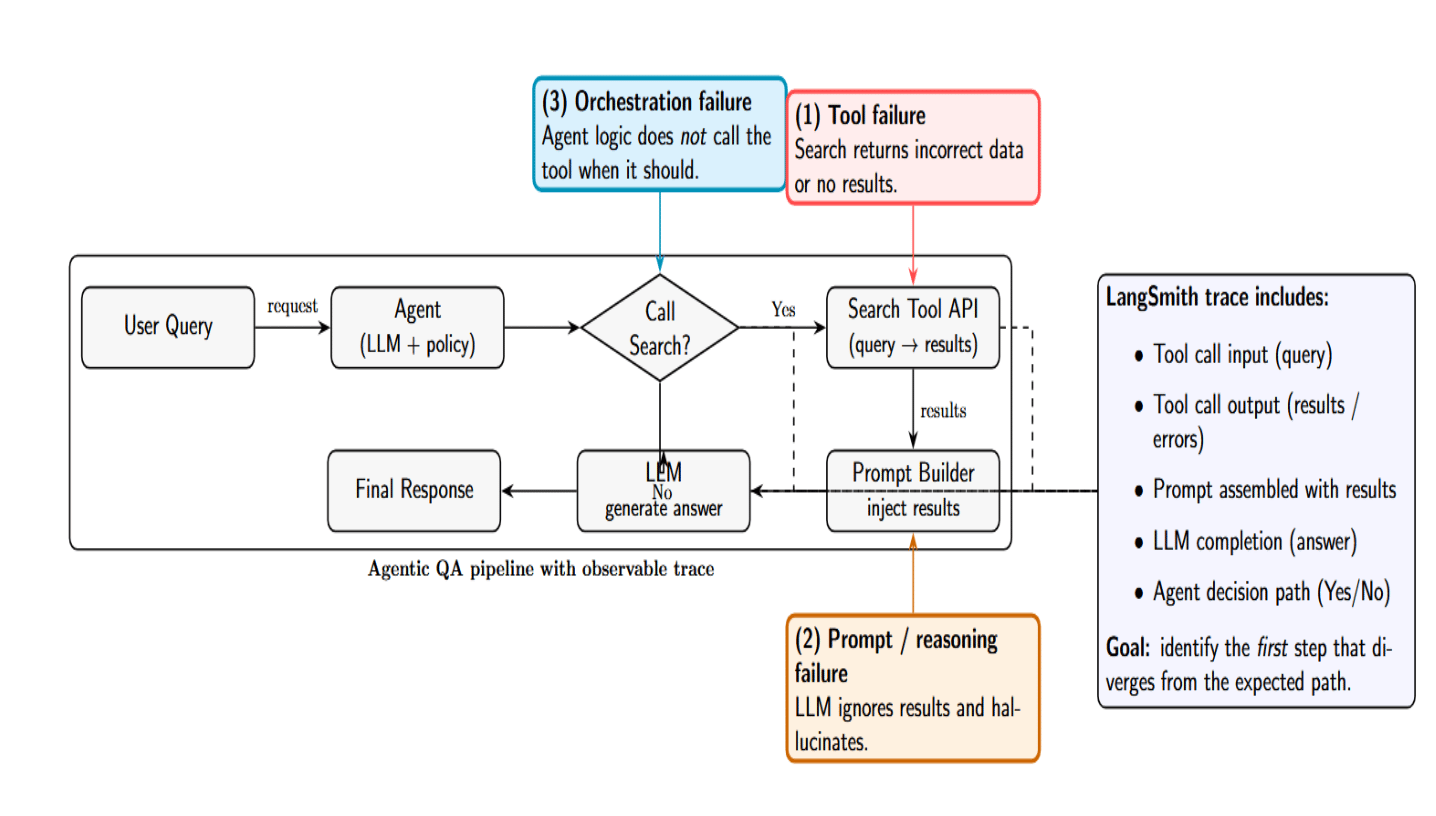
A LangSmith trace would include each step: the query and result of calling the search API, the agent prompt built with that result, the answer from the LLM, and so on. This way, you can immediately see where the chain failed to follow expected paths.
Quickstart: Trace an Agent Run (Python Example)
Welcome to a brief example on how to use LangSmith to trace an agent run. We’ll be using Python (LangSmith also has an SDK for JavaScript/TypeScript tracing in a similar way, but Python is shown here). In this example, we will instrument a trivial LLM call and build a trace in the LangSmith UI.
Prerequisites: Sign up for a free LangSmith account (if you haven’t already) and grab your API key. You will also need your LLM provider API key (i.e., OpenAI API key). Install the necessary packages:
pip install -U langsmith openai # for this example
1. Enable LangSmith Tracing. LangSmith works with LangChain out of the box – if you’re already using LangChain, you can enable tracing with a single environment variable. In your environment (or .env file), make sure these are set:
export LANGSMITH_TRACING=true
export LANGSMITH_API_KEY="<your-langsmith-api-key>"
export OPENAI_API_KEY="<your-openai-api-key>"
These ensure that LangSmith tracing is active and authenticated. ( If you have more than one LangSmith workspace, also set LANGSMITH_WORKSPACE_ID appropriately.) You can also set these variables from Python using os.environ before initializing any LLM
Important: The LANGSMITH_TRACING=true flag must be set before your code executes the LLM calls, so the SDK can intercept them.
2. Wrap or Use an LLM Client. If you are using LangChain’s LLM classes, you do not need any special code to log traces – simply ensure the env var is set. E.g., using LangChain’s OpenAI wrapper:
import os
os.environ["LANGSMITH_TRACING"] = "true"
os.environ["LANGSMITH_API_KEY"] = "<your-langsmith-api-key>"
from langchain.chat_models import ChatOpenAI
llm = ChatOpenAI(model_name="gpt-3.5-turbo")  # This is LangChain's LLM wrapper
response = llm.predict("Hello, world!")
print(response)
When this runs, LangChain will detect that tracing is enabled and log the call to LangSmith in the background. After running this code, you can visit the LangSmith web UI and view the trace (under the default project’s list of traces).
If you are not using LangChain, you can instrument your LLM calls with LangSmith’s SDK manually. For example, if you want to trace OpenAI API calls directly, LangSmith offers a wrap_openai helper:
from langsmith import wrappers
import openai
openai.api_key = os.environ["OPENAI_API_KEY"]
openai_client = wrappers.wrap_openai(openai.OpenAI())  # wrap the OpenAI client for tracing:contentReference[oaicite:14]{index=14}
# Now any call through openai_client will be traced:
result = openai_client.ChatCompletion.create(
   model="gpt-3.5-turbo",
   messages=[ {"role": "user", "content": "Hello, world?"} ]
)
print(result["choices"][0]["message"]["content"])
Here we used langsmith.wrappers.wrap_openai to get a traced client. LangSmith has similar wrappers for other providers (Anthropic, etc.) as well. After running this code, you’ll likewise see the full trace in LangSmith, showing the model request and response.
3. View the Trace. Switch to the LangSmith UI (web app). Go to Observability / Traces. You should see a new entry for your run there. Click on it, and you’ll see a structured view of the run. Since our example was so simple, there might just be one LLM call node (with the prompt and output). For a more complex chain/agent, it would be a tree of all the sub-steps (eg, an Agent’s thought process and each tool call). You can inspect timings, inputs/outputs, and even share traces, add annotations, etc. This immediate visibility helps you know for sure that everything worked. If it didn’t (eg, some error in the chain), you’d see exactly where and why it happened.
Tip: If running in production, you may not want to trace every run (cost saving). LangSmith supports sampling traces or enabling/disabling tracing in code. For example, you could enable tracing for a % of requests or for specific sessions (set the env var dynamically or with LangSmith’s configuration SDK). For development and debugging, turning it on globally (as above) is the easiest path.
Reading Traces
Once you have traces, the next step is to diagnose issues. A LangSmith trace is a little like an experiment log – it’s a way to categorize failures and identify patterns. Here are some common failure modes and the patterns they create in traces:
| Failure Type | What it looks like | What does the trace help you do / likely fix |
|---|---|---|
| Prompt Failures | The final LLM output is wrong or malformed, even though the tool outputs are correct and sufficient. | Inspect the exact prompt + raw model response to refine instructions, add examples, improve formatting/constraints, or adjust the model/settings. |
| Tool Failures | A tool call returns an error, times out, or returns empty/invalid output. | See the failing tool step (error/empty output) to add retries, timeouts, fallbacks, validation, and guardrails around that tool. |
| Retrieval / Knowledge Failures | The retrieval step (RAG) fetches irrelevant documents or misses key facts, leading to a wrong answer. | Review the retrieval query and retrieved documents to improve the vector store, chunking, indexing, reranking, or the retrieval prompt/query strategy. |
| Orchestration Failures | The agent/chain logic misbehaves (loops, wrong branch, poor step ordering, excessive steps, or very slow runs). | Use the run tree + metadata to spot loops and bottlenecks, then fix control flow (stop conditions, branching logic, tool selection rules) and optimize step structure. |
Think of a trace as a research log. Categorize every issue (prompt vs tool vs other), measure its impact (did it error out, or just reduce answer quality? ), and you’ll know exactly what needs fixing. Inputs, prompts, and tool order are explicit and auditable with LangSmith; memory/state mutations are explicit; latency, cost, and error paths are quantifiable.
Evaluation Workflow: Datasets, Evaluators, and Experiments
Tracing tells you what happened during a single run. Evaluation tells you how good those outcomes are, especially when you have to measure quality across many runs or compare different versions of your agent. LangSmith has a full-fledged evaluation workflow to support both offline testing and online monitoring of your LLM app’s quality.
Offline vs Online Evaluation: LangSmith supports both modes. Offline evaluation is what you do before you ship changes - you prepare a dataset of example inputs (and optionally expected outputs), then run your agent on all of them to see how it performs. This is great for catching regressions and comparing prompt/model versions in a controlled setting. Online evaluation, by contrast, runs in production - it continuously evaluates real user interactions as they happen, to monitor quality on live data. Both are useful: offline eval is like unit/integration tests for your agent, and online eval is like live monitoring or canary testing.
The typical evaluation workflow in LangSmith looks like this:
- Create a Dataset: A collection of test cases for your agent. These can be collected from previous failures (traces of your agent providing incorrect responses), synthetic examples you believe to be challenging, or user questions you want to be confident are covered. In LangSmith, a dataset is simply a set of input-output pairs (or inputs only, if you don’t have a “ground truth” output). You can create and manage datasets using the UI or SDK. For example, in Python:
from langsmith import Client
client = Client()
dataset = client.create_dataset("MathQA set", description="Simple math Q&A tests")
client.create_examples(dataset.id, examples=[
   {"inputs": {"question": "What is 2+2?"}, "outputs": {"answer": "4"}},
   {"inputs": {"question": "What is the capital of France?"}, "outputs": {"answer": "Paris"}}
])
This would programmatically create a dataset with two Q&A examples. (You could also upload datasets from a CSV/JSON or create them in the UI.) from a CSV/JSON or create them in the UI.)
2. Define Evaluators: Evaluators are functions or models that score your agent’s output for each example. LangSmith comes with some built-in evaluators and supports custom ones. Common evaluator types include:
- Correctness (Truthfulness): Does the output contain the same answer as a known correct reference answer? (For this, you need to have reference outputs in your dataset.)
- Rubric Scoring: custom Python function or heuristic to check for something (e.g., “did the output include a citation?”).
- LLM-as-Judge: Use another LLM to judge the quality of output. For example, an OpenAI function can compare the output to the reference and provide a score.
- Pairwise Comparison: Use this when you have two outputs (e.g., from model A vs. model B) and want to determine which is better.
You can attach one or many evaluators to an experiment. LangSmith uses the OpenEvals library (the open-source evaluators) for this. For example, to use an LLM-as-judge evaluator for correctness, you’d import a prompt like CORRECTNESS_PROMPT and do:
from openevals.llm import create_llm_as_judge
from openevals.prompts import CORRECTNESS_PROMPT
judge = create_llm_as_judge(prompt=CORRECTNESS_PROMPT)
As you can see, this judge can then be used to score each output (it effectively asks an LLM with “Is this answer correct given the reference?”, returning a score)*
3. Run an Experiment: Now the fun part – run your agent on the dataset and collect results. In LangSmith UI, you’d create a new Experiment, select the dataset and the target function (your agent/chain) to run, attach the evaluators, etc. If you’re using code, you’d use Client.run_on_dataset or something similar.
client = Client()
# Assuming `target_fn` is your function that takes an input dict and returns an output dict
experiment = client.run_on_dataset(
   dataset_name="MathQA set",
   func=target_fn,
   evaluators=[judge]  # the evaluator we defined
)
This will run your target_fn for each example in the dataset, log the outputs, and then have the evaluator(s) score each result. LangSmith will keep all this logged data in an Experiment object that you can inspect.
In the UI, running an experiment will display a live-updating table of results – you’ll see each example, the model’s output, and the scores from evaluators. This is useful for identifying patterns (e.g., “the agent fails on all math questions that involve division”).
4. Analyze Results: After the experiment is complete, you can compare and analyze your runs in LangSmith. Sort and filter runs by score, filter examples (for example, “show me examples where the correctness score was low”), compare two experiments if you ran multiple (e.g., compare Agent v1 vs Agent v2 on the same dataset), etc. This is helpful both for benchmarking different prompt versions/models and for creating “regression tests” (you can literally store a “golden set” of examples, then ensure future versions don’t degrade scores on those).
5. Iterate Improvements: If the evaluation wasn’t good enough, you’ll refine the agent in some way (improve the prompts, change examples, fix how the agent uses tools, etc.) and run new experiments.
One particularly useful workflow is the Prompt Playground (a “no-code” UI in LangSmith) to run quick evaluations on different prompt variants. The Playground enables you to load a dataset, try different prompt templates or model parameters, and immediately see evaluation scores.
One final note – Evaluation is not always done with automation. Sometimes, automated metrics / LLM-judges do not capture some important aspects. This is where human review/evaluation comes in – and LangSmith also supports this via annotation queues, which we will see in the next section.
Human-in-the-Loop: Annotation Queues for Quality at Scale
Automated evaluators are great, but at some point, you’ll want human evaluation to get the most accurate scores. LangSmith’s annotation queues are a simple and scalable way to get human review for your agent’s outputs. You can put model outputs into a queue to be reviewed, and human annotators (yourself, colleagues, or professional labelers) can score them based on a predefined rubric.
LangSmith supports two styles of annotation queues:
- Single-run Annotation Queues: This style shows one output (one run) at a time to the reviewer, along with a rubric or questions to answer about that output. This might be as simple as “Is this answer factually correct? (Yes/No)” or “Rate the answer’s clarity from 1-5.“The reviewer will see the full context (prompt, output, and may be, a reference answer if you have it) and submit feedback for that run.
- Pairwise Annotation Queues (PAQs): This presents two outputs side by side and asks the reviewer to choose which one is better (or if they are equal) on some criteria. This is useful for A/B testing – for instance, you have Agent Version A and Version B answering the same question, and you want a human to decide which did a better job. Pairwise comparisons are also great if you want to compare a new model or prompt against an old one, which is a common use case for fine-tuning or RLHF.
When to use which? Single-run queues are good for getting absolute ratings or categorical labels on outputs (great if you’re building a dataset of human scores to train an evaluator, or just monitoring quality).
Pairwise is useful when relative quality is more important, i.e., you want to ensure the new version is an improvement, and you want to know how much people prefer it. In practice, many teams use pairwise when doing preference modeling or reinforcement learning from human feedback (RLHF). This is because it’s easier for humans to say “which of these two is better” than to assign an absolute score.
LangSmith vs Alternatives: How It Stacks Up
The LLM observability/feedback space is evolving, and several tools have emerged that overlap with LangSmith’s feature set. Here’s a brief comparison of LangSmith and some popular alternatives, along with some tips on selecting the right tool for your use case:
| Tool / Option | What it is (approach + key features) | Best fit/trade-offs |
|---|---|---|
| Langfuse | Open-source platform for LLM tracing, analytics, evaluations, and annotation. Supports self-hosting (community edition) and broad integrations beyond LangChain (multiple SDKs/frameworks, including OpenAI SDK). | Choose if you want full data control, self-hosting, or a custom stack. Trade-off: may require more ops effort than a hosted service; LangSmith can feel more “plug-and-play” for LangChain/LangGraph and may be stronger on prompt/version workflows. |
| Helicone | Open-source observability tool that works as an LLM API proxy: route calls through Helicone (often by changing API base URL) to log requests/responses. Strong focus on cost tracking, latency metrics, dashboards, and caching; supports session tracing for multi-step flows. | Choose if you need the fastest setup for logging + spend monitoring with minimal code changes. Trade-off: typically less deep than hierarchical agent traces; generally not an evaluation-first platform like LangSmith/Langfuse. Often used alongside them (Helicone for cost, others for agent debugging/eval). |
| OpenTelemetry (OTel) + OpenLLMetry | Open standard for telemetry (traces/logs/metrics). GenAI semantic conventions aim to standardize how LLM operations/agent steps are represented. OpenLLMetry provides SDKs to instrument LLM apps and export data to any OTel backend (Datadog/Jaeger/etc). | Choose if you need vendor-neutral portability, already have an observability stack, or want LLM telemetry integrated with existing APM. Trade-off: more setup (instrumentation + backend configuration) and typically generic UIs unless you build custom views for prompts/tools/agents. |
| Others (Phoenix/Arize, HoneyHive, etc.) | Specialized tools that often focus on one slice (e.g., Phoenix for dataset-based eval/analytics; HoneyHive for human feedback workflows). | Choose if your priority is a specific capability (pure eval analytics or human feedback). Trade-off: you may need to combine tools to match LangSmith’s “one-stop” workflow (trace + eval + prompt ops + monitoring). |
FAQ
Q1: Do I need LangChain to use LangSmith?
No. LangSmith is framework-agnostic. You can use it with LangChain, LangGraph, or with no framework at all. If you are already using LangChain, great – LangSmith hooks in with minimal setup (simply set env variables, and it will automatically log chains/agents for you). If you aren’t using a framework, you can trace your LLM calls or agent logic manually with LangSmith’s SDK.
Q2: Can I evaluate prompts without writing code?
Yes. LangSmith provides a Prompt Playground and UI for evaluation that let you do a lot without coding. For example, you can create a dataset and run an experiment entirely from the web interface – just fill in examples, select an evaluator from a dropdown, and hit Start.
Q3: What’s the difference between single-run and pairwise annotations in LangSmith?
In single-run annotation, a human reviewer is presented with one output (one run) at a time and provides feedback based on a rubric (e.g., rating its correctness or other qualities). In pairwise annotation, the reviewer is shown two outputs side by side (usually from two different model versions for the same input) and asked which is better or if they’re equal. Single-run is for judging an output in isolation. Pairwise is for comparing outputs.
Q4: What do I need to set to ensure my LLM calls are traced by LangSmith?
The critical setting is to enable tracing via environment variables or config. This can be done with environment variables or through the config. The simplest way is to set the environment variable LANGSMITH_TRACING=true before running your application. You will also want to set your API key (LANGSMITH_API_KEY) so that data gets associated with your account, and of course, any model API keys (like OPENAI_API_KEY). With LANGSMITH_TRACING=true, any supported integration (LangChain, etc.) will begin logging. If env vars are not possible, LangSmith also supports programmatic enabling – for example, in Python:
from langsmith import Client
client = Client()
client.configure_tracing(True)
This is a hypothetical example; the actual API may differ, but conceptually, you can turn it on in code. Run your chain/agent — you should see traces in the LangSmith UI. If not, double-check that you have your environment variables defined in the same context that the code is actually running (and correct workspace if applicable).
Q5: Is LangSmith only for tracing, or does it handle deployments too?
LangSmith was built with observability and eval in mind, but it also has a Deployment module. You can deploy agents as managed endpoints through LangSmith (they refer to them as Agent Servers), and get scaling, uptime, and monitoring out of the box.
Conclusion
LangSmith helps you evolve agent development from a trial-and-error process to an engineering workflow. With tracing, evaluation, prompt versioning, and human review, you can diagnose failures, measure improvement, and prevent regressions from reaching users. The core agent development habit is the agent reliability loop: trace every run, turn real failures into datasets, run repeatable experiments using evaluators (augmented by humans as necessary), then only promote the best prompt/model changes through versioned releases. Tracking and monitoring operations enable you to receive early alerts regarding drift occurrences, tool failure events, latency fluctuations, and unexpected financial impacts. LangSmith offers a structured solution for developers of tool-using or multi-step agents who prioritize reproducibility and disciplined iteration during development from prototype to production.
References
- LangSmith docs
- What is LangSmith? Tracing and debugging for LLMs
- LangSmith Alternative? Langfuse vs. LangSmith
- LangSmith tracing: Debugging LLM chains
- Tracing quickstart
- LangSmith Evaluation
- Evaluation quickstart
- Use annotation queues
- Observability concepts
- The Complete Guide to LLM Observability Platforms in 2025
- OpenTelemetry for GenAI and the OpenLLMetry project
Thanks for learning with the DigitalOcean Community. Check out our offerings for compute, storage, networking, and managed databases.
About the author(s)
I am a skilled AI consultant and technical writer with over four years of experience. I have a master’s degree in AI and have written innovative articles that provide developers and researchers with actionable insights. As a thought leader, I specialize in simplifying complex AI concepts through practical content, positioning myself as a trusted voice in the tech community.
With a strong background in data science and over six years of experience, I am passionate about creating in-depth content on technologies. Currently focused on AI, machine learning, and GPU computing, working on topics ranging from deep learning frameworks to optimizing GPU-based workloads.
Still looking for an answer?
This textbox defaults to using Markdown to format your answer.
You can type !ref in this text area to quickly search our full set of tutorials, documentation & marketplace offerings and insert the link!
 This work is licensed under a Creative Commons Attribution-NonCommercial- ShareAlike 4.0 International License.
Become a contributor for community
Get paid to write technical tutorials and select a tech-focused charity to receive a matching donation.

DigitalOcean Documentation
Full documentation for every DigitalOcean product.

Resources for startups and AI-native businesses
The Wave has everything you need to know about building a business, from raising funding to marketing your product.
The developer cloud
Scale up as you grow — whether you're running one virtual machine or ten thousand.

Start building today
From GPU-powered inference and Kubernetes to managed databases and storage, get everything you need to build, scale, and deploy intelligent applications.
