By Jayant Verma

Welcome to this tutorial on the MNIST dataset. In this tutorial, we will learn what is the MNIST dataset, how to import it in Python, and how to plot it using matplotlib.
What is the MNIST dataset?
MNIST set is a large collection of handwritten digits. It is a very popular dataset in the field of image processing. It is often used for benchmarking machine learning algorithms.
MNIST is short for Modified National Institute of Standards and Technology database.
MNIST contains a collection of 70,000, 28 x 28 images of handwritten digits from 0 to 9.
The dataset is already divided into training and testing sets. We will see this later in the tutorial.
For more information on MNIST, refer to its Wikipedia page. We are going to import the dataset from Keras.
Let’s start with loading the dataset into our python notebook.
Loading MNIST from Keras
We will first have to import the MNIST dataset from the Keras module.
We can do that using the following line of code:
from keras.datasets import mnist
Now we will load the training and testing sets into separate variables.
(train_X, train_y), (test_X, test_y) = mnist.load_data()
Let’s find out how many images are there in the training and testing sets. In other words, let’s try and find out the split ratio of the this dataset.
To learn more about split ratio, refer to this tutorial on how to slit data into training and testing sets.
To find the split ratio we are going to print the shapes of all the vectors.
print('X_train: ' + str(train_X.shape))
print('Y_train: ' + str(train_y.shape))
print('X_test:  '  + str(test_X.shape))
print('Y_test:  '  + str(test_y.shape))
Output:
X_train: (60000, 28, 28)
Y_train: (60000,)
X_test:  (10000, 28, 28)
Y_test:  (10000,)
We can see that there are 60k images in the training set and 10k images in the testing set.
The dimension of our training vector is (60000, 28, 28), this is because there are 60,000 grayscale images with the dimension 28X28.
Complete Code for Loading the MNIST Dataset
Here’s the complete code from this section :
from keras.datasets import mnist

#loading the dataset
(train_X, train_y), (test_X, test_y) = mnist.load_data()

#printing the shapes of the vectors
print('X_train: ' + str(train_X.shape))
print('Y_train: ' + str(train_y.shape))
print('X_test:  '  + str(test_X.shape))
print('Y_test:  '  + str(test_y.shape))
Let’s learn how to plot this dataset.
Plotting the MNIST dataset using matplotlib
It is always a good idea to plot the dataset you are working on. It will give you a good idea about the kind of data you are dealing with.
As a responsible data scientist, it should be your duty to always plot the dataset as step zero.
To plot the dataset, use the following piece of code :
from matplotlib import pyplot
for i in range(9):
pyplot.subplot(330 + 1 + i)
pyplot.imshow(train_X[i], cmap=pyplot.get_cmap('gray'))
pyplot.show()
Output :
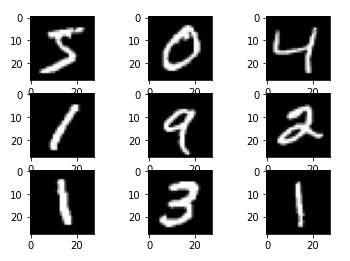
This is what our data looks like!
Imagine 70,000 images just like these ones. That’s what is inside the dataset. Being so voluminous is one of the reasons for the dataset’s popularity.
The problem of handwriting recognition no matter how trivial is outdated now. There was a need for a more challenging version of the MNSIT dataset that could act as its replacement.
Is there a more challenging version of the MNIST dataset out there?
Yes, there is. The Fashion MNIST dataset.
Fashion MNIST dataset
The fashion MNIST data set is a more challenging replacement for the old MNIST dataset.
This dataset contains 70,000 small square 28×28 pixel grayscale images of items of 10 types of clothing, such as shoes, t-shirts, dresses, and more.
To learn how to import and plot the fashion MNIST data set, read this tutorial.
Conclusion
This tutorial was about importing and plotting the MNIST dataset in Python. We also discussed a more challenging replacement of this dataset, the Fashion MNIST set. Hope you had fun learning with us!
Thanks for learning with the DigitalOcean Community. Check out our offerings for compute, storage, networking, and managed databases.
About the author
Still looking for an answer?
 This work is licensed under a Creative Commons Attribution-NonCommercial- ShareAlike 4.0 International License.
Become a contributor for community
Get paid to write technical tutorials and select a tech-focused charity to receive a matching donation.

DigitalOcean Documentation
Full documentation for every DigitalOcean product.

Resources for startups and AI-native businesses
The Wave has everything you need to know about building a business, from raising funding to marketing your product.
The developer cloud
Scale up as you grow — whether you're running one virtual machine or ten thousand.

Start building today
From GPU-powered inference and Kubernetes to managed databases and storage, get everything you need to build, scale, and deploy intelligent applications.
