By Jayant Verma and Andrea Anderson

Introduction
In this article, you’ll try out some different ways to normalize data in Python using scikit-learn, also known as sklearn. When you normalize data, you change the scale of the data. Data is commonly rescaled to fall between 0 and 1, because machine learning algorithms tend to perform better, or converge faster, when the different features are on a smaller scale. Before training machine learning models on data, it’s common practice to normalize the data first to potentially get better, faster results. Normalization also makes the training process less sensitive to the scale of the features, resulting in better coefficients after training.
This process of making features more suitable for training by rescaling is called feature scaling.
This tutorial was tested using Python version 3.9.13 and scikit-learn version 1.0.2.
Using the scikit-learn preprocessing.normalize() Function to Normalize Data
preprocessing.normalize() Function to Normalize DataYou can use the scikit-learn preprocessing.normalize() function to normalize an array-like dataset.
The normalize() function scales vectors individually to a unit norm so that the vector has a length of one. The default norm for normalize() is L2, also known as the Euclidean norm. The L2 norm formula is the square root of the sum of the squares of each value. Although using the normalize() function results in values between 0 and 1, it’s not the same as simply scaling the values to fall between 0 and 1.
Normalizing an Array Using the normalize() Function
You can normalize a one dimensional NumPy array using the normalize() function.
Import the sklearn.preprocessing module:
from sklearn import preprocessing
Import NumPy and create an array:
import numpy as np

x_array = np.array([2,3,5,6,7,4,8,7,6])
Use the normalize() function on the array to normalize data along a row, in this case a one dimensional array:
normalized_arr = preprocessing.normalize([x_array])
print(normalized_arr)
Run the the complete example code to demonstrate how to normalize a NumPy array using the normalize() function:
from sklearn import preprocessing
import numpy as np

x_array = np.array([2,3,5,6,7,4,8,7,6])

normalized_arr = preprocessing.normalize([x_array])
print(normalized_arr)
The output is:
Output[[0.11785113 0.1767767  0.29462783 0.35355339 0.41247896 0.23570226
  0.47140452 0.41247896 0.35355339]]
The output shows that all the values are in the range 0 to 1. If you square each value in the output and then add them together, the result is 1, or very close to 1.
Normalizing Columns from a DataFrame Using the normalize() Function
In a pandas DataFrame, features are columns and rows are samples. You can convert a DataFrame column into a NumPy array and then normalize the data in the array.
The examples in this, and the following, sections use the California Housing dataset.
The first part of the example code imports the modules, loads the dataset, creates the DataFrame, and prints the description of the dataset:
import numpy as np
from sklearn import preprocessing
from sklearn.datasets import fetch_california_housing

# create the DataFrame
california_housing = fetch_california_housing(as_frame=True)

# print the dataset description
print(california_housing.DESCR)
Note that the as_frame parameter is set to True to create the california_housing object as a pandas DataFrame.
The output includes the following excerpt from the dataset description, which you can use to choose a feature to normalize:
Output.. _california_housing_dataset:

California Housing dataset
--------------------------

**Data Set Characteristics:**

    :Number of Instances: 20640

    :Number of Attributes: 8 numeric, predictive attributes and the target

    :Attribute Information:
        - MedInc        median income in block group
        - HouseAge      median house age in block group
        - AveRooms      average number of rooms per household
        - AveBedrms     average number of bedrooms per household
        - Population    block group population
        - AveOccup      average number of household members
        - Latitude      block group latitude
        - Longitude     block group longitude
...
Next, convert a column (feature) to an array, and print it. This example uses the HouseAge column:
x_array = np.array(california_housing['HouseAge'])
print("HouseAge array: ",x_array)
Finally, use the normalize() function to normalize the data and print the resulting array:
normalized_arr = preprocessing.normalize([x_array])
print("Normalized HouseAge array: ",normalized_arr)
Run the the complete example to demonstrate how to normalize a feature using the normalize() function:
from sklearn import preprocessing
import numpy as np
from sklearn.datasets import fetch_california_housing

california_housing = fetch_california_housing(as_frame=True)
# print(california_housing.DESCR)

x_array = np.array(california_housing.data['HouseAge'])
print("HouseAge array: ",x_array)

normalized_arr = preprocessing.normalize([x_array])
print("Normalized HouseAge array: ",normalized_arr)
The output is:
OutputHouseAge array:  [41. 21. 52. ... 17. 18. 16.]
Normalized HouseAge array:  [[0.00912272 0.00467261 0.01157028 ... 0.00378259 0.0040051  0.00356009]]
The output shows that the normalize() function changed the array of median house age values so that the square root of the sum of the squares of the values equals one. In other words, the values were scaled to a unit length using the L2 norm.
Normalizing Datasets by Row or by Column Using the normalize() Function
When you normalize a dataset without converting features, or columns, into arrays for processing, the data is normalized by row. The default axis for the normalize() function is 1, which means that each sample, or row, is normalized.
The following example demonstrates normalizing the California Housing dataset using the default axis:
from sklearn import preprocessing
import pandas as pd

from sklearn.datasets import fetch_california_housing
california_housing = fetch_california_housing(as_frame=True)

d = preprocessing.normalize(california_housing.data)
scaled_df = pd.DataFrame(d, columns=california_housing.data.columns)
print(scaled_df)
The output is:
Output         MedInc  HouseAge  AveRooms  ...  AveOccup  Latitude  Longitude
0      0.023848  0.117447  0.020007  ...  0.007321  0.108510  -0.350136
1      0.003452  0.008734  0.002594  ...  0.000877  0.015745  -0.050829
2      0.014092  0.100971  0.016093  ...  0.005441  0.073495  -0.237359
3      0.009816  0.090449  0.010119  ...  0.004432  0.065837  -0.212643
4      0.006612  0.089394  0.010799  ...  0.003750  0.065069  -0.210162
...         ...       ...       ...  ...       ...       ...        ...
20635  0.001825  0.029242  0.005902  ...  0.002995  0.046179  -0.141637
20636  0.006753  0.047539  0.016147  ...  0.008247  0.104295  -0.320121
20637  0.001675  0.016746  0.005128  ...  0.002291  0.038840  -0.119405
20638  0.002483  0.023932  0.007086  ...  0.002823  0.052424  -0.161300
20639  0.001715  0.011486  0.003772  ...  0.001879  0.028264  -0.087038

[20640 rows x 8 columns]
The output shows that the values are normalized along the rows so that that each sample is normalized instead of each feature.
However, you can normalize by feature by specifying the axis.
The following example demonstrates normalizing the California Housing dataset using axis=0 to normalize by feature:
from sklearn import preprocessing
import pandas as pd

from sklearn.datasets import fetch_california_housing
california_housing = fetch_california_housing(as_frame=True)

d = preprocessing.normalize(california_housing.data, axis=0)
scaled_df = pd.DataFrame(d, columns=california_housing.data.columns)
print(scaled_df)
The output is:
Output         MedInc  HouseAge  AveRooms  ...  AveOccup  Latitude  Longitude
0      0.013440  0.009123  0.008148  ...  0.001642  0.007386  -0.007114
1      0.013401  0.004673  0.007278  ...  0.001356  0.007383  -0.007114
2      0.011716  0.011570  0.009670  ...  0.001801  0.007381  -0.007115
3      0.009110  0.011570  0.006787  ...  0.001638  0.007381  -0.007116
4      0.006209  0.011570  0.007329  ...  0.001402  0.007381  -0.007116
...         ...       ...       ...  ...       ...       ...        ...
20635  0.002519  0.005563  0.005886  ...  0.001646  0.007698  -0.007048
20636  0.004128  0.004005  0.007133  ...  0.002007  0.007700  -0.007055
20637  0.002744  0.003783  0.006073  ...  0.001495  0.007689  -0.007056
20638  0.003014  0.004005  0.006218  ...  0.001365  0.007689  -0.007061
20639  0.003856  0.003560  0.006131  ...  0.001682  0.007677  -0.007057

[20640 rows x 8 columns]
When you examine the output, you’ll notice that the results for the HouseAge column match the output you got when you converted the HouseAge column to an array and normalized it in a preceding example.
Using the scikit-learn preprocessing.MinMaxScaler() Function to Normalize Data
preprocessing.MinMaxScaler() Function to Normalize DataYou can use the scikit-learn preprocessing.MinMaxScaler() function to normalize each feature by scaling the data to a range.
The MinMaxScaler() function scales each feature individually so that the values have a given minimum and maximum value, with a default of 0 and 1.
The formula to scale feature values to between 0 and 1 is:
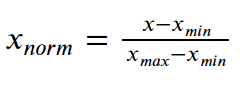
Subtract the minimum value from each entry and then divide the result by the range, where range is the difference between the maximum value and the minimum value.
The following example demonstrates how to use the MinMaxScaler() function to normalize the California Housing dataset:
from sklearn import preprocessing
import pandas as pd

from sklearn.datasets import fetch_california_housing
california_housing = fetch_california_housing(as_frame=True)

scaler = preprocessing.MinMaxScaler()
d = scaler.fit_transform(california_housing.data)
scaled_df = pd.DataFrame(d, columns=california_housing.data.columns)
print(scaled_df)
The output is:
Output         MedInc  HouseAge  AveRooms  ...  AveOccup  Latitude  Longitude
0      0.539668  0.784314  0.043512  ...  0.001499  0.567481   0.211155
1      0.538027  0.392157  0.038224  ...  0.001141  0.565356   0.212151
2      0.466028  1.000000  0.052756  ...  0.001698  0.564293   0.210159
3      0.354699  1.000000  0.035241  ...  0.001493  0.564293   0.209163
4      0.230776  1.000000  0.038534  ...  0.001198  0.564293   0.209163
...         ...       ...       ...  ...       ...       ...        ...
20635  0.073130  0.470588  0.029769  ...  0.001503  0.737513   0.324701
20636  0.141853  0.333333  0.037344  ...  0.001956  0.738576   0.312749
20637  0.082764  0.313725  0.030904  ...  0.001314  0.732200   0.311753
20638  0.094295  0.333333  0.031783  ...  0.001152  0.732200   0.301793
20639  0.130253  0.294118  0.031252  ...  0.001549  0.725824   0.309761

[20640 rows x 8 columns]
The output shows that the values are scaled to have the default minimum value of 0 and maximum value of 1.
You can also specify different minimum and maximum values for scaling. In the following example, the minimum value is 0 and the maximum value is 2:
from sklearn import preprocessing
import pandas as pd

from sklearn.datasets import fetch_california_housing
california_housing = fetch_california_housing(as_frame=True)

scaler = preprocessing.MinMaxScaler(feature_range=(0, 2))
d = scaler.fit_transform(california_housing.data)
scaled_df = pd.DataFrame(d, columns=california_housing.data.columns)
print(scaled_df)
The output is:
         MedInc  HouseAge  AveRooms  ...  AveOccup  Latitude  Longitude
0      1.079337  1.568627  0.087025  ...  0.002999  1.134963   0.422311
1      1.076054  0.784314  0.076448  ...  0.002281  1.130712   0.424303
2      0.932056  2.000000  0.105513  ...  0.003396  1.128587   0.420319
3      0.709397  2.000000  0.070482  ...  0.002987  1.128587   0.418327
4      0.461552  2.000000  0.077068  ...  0.002397  1.128587   0.418327
...         ...       ...       ...  ...       ...       ...        ...
20635  0.146260  0.941176  0.059538  ...  0.003007  1.475027   0.649402
20636  0.283706  0.666667  0.074688  ...  0.003912  1.477152   0.625498
20637  0.165529  0.627451  0.061808  ...  0.002629  1.464400   0.623506
20638  0.188591  0.666667  0.063565  ...  0.002303  1.464400   0.603586
20639  0.260507  0.588235  0.062505  ...  0.003098  1.451647   0.619522

[20640 rows x 8 columns]
The output shows that the values are scaled to have the minimum value of 0 and maximum value of 2.
Conclusion
In this article you used two scikit-learn functions to normalize data in different ways by sample (row) and by feature (column). Continue your learning about other machine learning topics.
Thanks for learning with the DigitalOcean Community. Check out our offerings for compute, storage, networking, and managed databases.
About the author(s)
Still looking for an answer?
Nice clear article - thanks for posting. The earlier code samples need the line: names = housing.columns
- Phil J
In your example: [2,3,5,6,7,4,8,7,6] x_min = 2, x_max = 8, right? Then, according to your formula, the number 8 should turn into 1, and the number 2 into 0. But something is wrong) Here, normalization does not take place according to this formula, but simply each element is divided by the root of the sum of the squares of all elements.
- Alexander
If we have a table xy and we have to “add a check if fields are normalized integral (|E|^2)=1…. “…What we have to do?
- Fani
 This work is licensed under a Creative Commons Attribution-NonCommercial- ShareAlike 4.0 International License.
Become a contributor for community
Get paid to write technical tutorials and select a tech-focused charity to receive a matching donation.

DigitalOcean Documentation
Full documentation for every DigitalOcean product.

Resources for startups and AI-native businesses
The Wave has everything you need to know about building a business, from raising funding to marketing your product.
The developer cloud
Scale up as you grow — whether you're running one virtual machine or ten thousand.

Start building today
From GPU-powered inference and Kubernetes to managed databases and storage, get everything you need to build, scale, and deploy intelligent applications.
