By Prajwal CN
 function in R - Binding Rows Made Easy")
The binding or combining of the rows is very easy with the rbind() function in R.
rbind() stands for row binding. In simpler terms joining of multiple rows to form a single batch. It may include joining two data frames, vectors, and more.
This article will talk about the uses and applications of rbind() function in R programming.
Without wasting much time, let’s roll in to the topic!!!
Syntax of the rbind() function
rbind(): The rbind or the row bind function is used to bind or combine the multiple group of rows together.
rbind(x,x1)
Where:
- X = the input data.
- X1 = The data need to be binded.
The idea of binding rows using rbind()
The idea of binding or combing the rows of multiple data frames is highly beneficial in data manipulation.
The below diagram will definitely get you the idea of working the rbind() function.
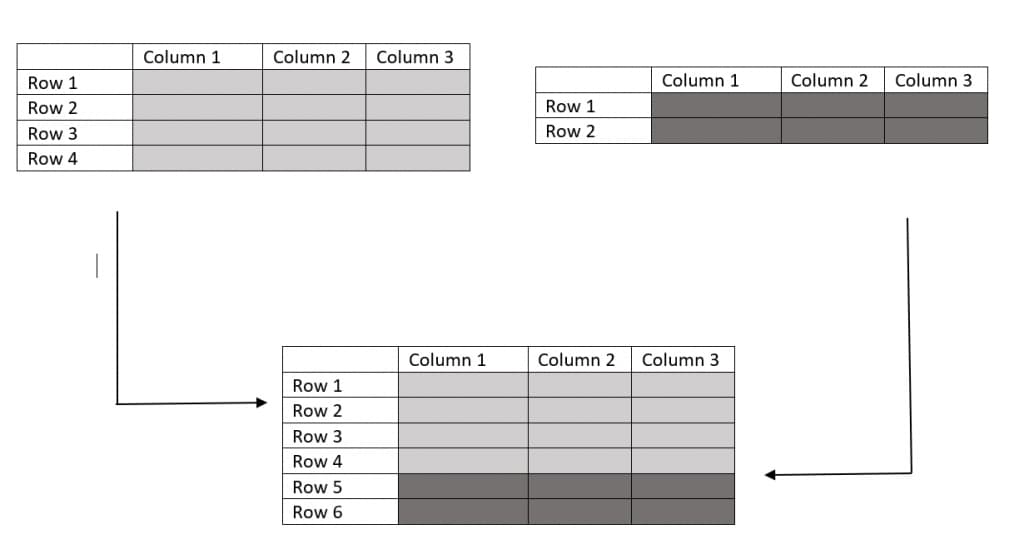
You can see that how rows of different data frames will bound/combined by the rbind() function.
Implementing the rbind() function in R
As you know that rbind() function in R used to bind the rows of different groups of data.
In this section, let’s try to construct a simple data frames and bind them using rbind() function.
#creating a data frame

Student_details<-c("Mark","John","Fredrick","Floyd","George")
Student_class<-c("High school","College","High school","High school","College")
df1<-data.frame(Student_class,Student_details)

df1
The above code will construct a simple data frame presenting student details and names.
   Student_class    Student_details
1   High school            Mark
2       College            John
3   High school        Fredrick
4   High school           Floyd
5       College          George
Well, now we have a dataframe of 5 rows. Let’s create another data frame.
#creating a dataframe

Student_details<-c("Bracy","Evin")
Student_class<-c("High school","College")
Student_rank<-c("A","A+")
df2<-data.frame(Student_class,Student_details,Student_rank)

df2
    Student_class      Student_details
1   High school           Bracy
2       College            Evin
Well, now we have 2 data frames of different row counts (df1 and df2). Let’s use the rbind() function to bind the above 2 data frames into a single data frame.
Let’s see how it works.
You won’t believe that the whole binding process will require just a line of code.
#binds rows of 2 input data frames

rbind(df1,df2)
    Student_class     Student_details
1   High school            Mark
2       College            John
3   High school        Fredrick
4   High school           Floyd
5       College          George
6   High school           Bracy
7       College            Evin
The resultant data frame will be a bonded version of both data frames as shown in the above output.
Binding two data frames of unequal length using bind() function
Well, in the previous section, we have combined the two row groups together.
In this section, we are going to combine two data sets together using the rbind function in R.
#creates the data frame

Student_details<-c("Mark","John","Fredrick","Floyd","George")
Student_class<-c("High school","College","High school","High school","College")
df1<-data.frame(Student_class,Student_details)

df1
   Student_class    Student_details
1   High school            Mark
2       College            John
3   High school        Fredrick
4   High school           Floyd
5       College          George
#creats the data frame

Student_details<-c("Bracy","Evin")
Student_class<-c("High school","College")
Student_rank<-c("A","A+")
df2<-data.frame(Student_class,Student_details,Student_rank)
df2
   Student_class   Student_details   Student_rank
1   High school           Bracy            A
2       College            Evin           A+
rbind(df1,df2)
Error in rbind(deparse.level, ...) :
  numbers of columns of arguments do not match
Oh wait, what happened? Why the function is throwing an error?
If you read the lines in the error, it is stating that the number of columns is not matching.
We have 2 columns in ‘df1’ and 3 columns in ‘df2’.
Worry not! we have got the bind_rows() function which will assist us in these scenarios.
The bind_rows() function to bind uneven data sets
bind_rows() is a function which is a part of dplyr package. We need to import the dplyr package first to execute this function.
We are using the same data frames present in the above section i.e df1 and df2. Let’s see how it works.
#install required packages
install.packages('dplyr')
#import libraries
library(dplyr)
#bind the rows
bind_rows(df1,df2)
   Student_class    Student_details   Student_rank
1   High school            Mark         <NA>
2       College            John         <NA>
3   High school        Fredrick         <NA>
4   High school           Floyd         <NA>
5       College          George         <NA>
6   High school           Bracy          A
7       College            Evin          A+
you can now see that the bind_rows function has combined these two unequal datasets in terms of columns. The empty spaces will be marked as <NA>.
Binding two data sets using the rbind() function
In this section, we will be looking into the binding of two entire data sets in R.
Let’s see how it works.
We are going to use the BOD data set as it has only 6 rows and also you can easily observe the bound rows.
#binds two data sets
rbind(BOD,BOD)
  Time demand
1     1    8.3
2     2   10.3
3     3   19.0
4     4   16.0
5     5   15.6
6     7   19.8
---------------
7     1    8.3
8     2   10.3
9     3   19.0
10    4   16.0
11    5   15.6
12    7   19.8
BOD dataset has 6 rows. As we are passing the data twice, the rbind() function will bind the same rows as shown above.
And also don’t forget that you have bind_rows() function as well.
#binds two different datasets

bind_rows(BOD,women)
    Time  demand  height  weight
1     1    8.3     NA     NA
2     2   10.3     NA     NA
3     3   19.0     NA     NA
4     4   16.0     NA     NA
5     5   15.6     NA     NA
6     7   19.8     NA     NA
7    NA     NA     58    115
8    NA     NA     59    117
9    NA     NA     60    120
10   NA     NA     61    123
11   NA     NA     62    126
12   NA     NA     63    129
13   NA     NA     64    132
14   NA     NA     65    135
15   NA     NA     66    139
16   NA     NA     67    142
17   NA     NA     68    146
18   NA     NA     69    150
19   NA     NA     70    154
20   NA     NA     71    159
21   NA     NA     72    164
These are the examples which clearly shows the working and applications of the bind() and bind_rows functions.
I hope these illustrations helped you in understanding these functions.
Binding multiple rows groups in R
In this section, we will be focusing on binding multiple (more than 2) row groups using the function rbind(). Let’s see how it works.
#binds rows of 3 data sets
bind_rows(BOD,women,ToothGrowth)
     Time demand height weight len supp  dose
1     1    8.3     NA     NA   NA  <NA>   NA
2     2   10.3     NA     NA   NA  <NA>   NA
3     3   19.0     NA     NA   NA  <NA>   NA
4     4   16.0     NA     NA   NA  <NA>   NA
5     5   15.6     NA     NA   NA  <NA>   NA
6     7   19.8     NA     NA   NA  <NA>   NA
7    NA     NA     58    115   NA  <NA>   NA
8    NA     NA     59    117   NA  <NA>   NA
9    NA     NA     60    120   NA  <NA>   NA
10   NA     NA     61    123   NA  <NA>   NA
11   NA     NA     62    126   NA  <NA>   NA
12   NA     NA     63    129   NA  <NA>   NA
13   NA     NA     64    132   NA  <NA>   NA
14   NA     NA     65    135   NA  <NA>   NA
15   NA     NA     66    139   NA  <NA>   NA
16   NA     NA     67    142   NA  <NA>   NA
17   NA     NA     68    146   NA  <NA>   NA
18   NA     NA     69    150   NA  <NA>   NA
19   NA     NA     70    154   NA  <NA>   NA
20   NA     NA     71    159   NA  <NA>   NA
Observe, how all three datasets were bonded or combined by the bind_rows() function in R. This is the beauty of bind_rows() function.
These 2 functions have endless applications in data manipulation in R programming.
Wrapping Up
The rbind() function in R and the bind_rows() function are the most useful functions when it comes to data manipulation.
You can easily bind two data frames of the same column count using rbind() function.
In the same way, if the data frames have unequal column counts, you can use the bind_rows() function along with dplyr package.
Well, That’s all for now, Happy binding!!!
More read: R documentation
Thanks for learning with the DigitalOcean Community. Check out our offerings for compute, storage, networking, and managed databases.
About the author
Still looking for an answer?
 This work is licensed under a Creative Commons Attribution-NonCommercial- ShareAlike 4.0 International License.
Become a contributor for community
Get paid to write technical tutorials and select a tech-focused charity to receive a matching donation.

DigitalOcean Documentation
Full documentation for every DigitalOcean product.

Resources for startups and AI-native businesses
The Wave has everything you need to know about building a business, from raising funding to marketing your product.
The developer cloud
Scale up as you grow — whether you're running one virtual machine or ten thousand.

Start building today
From GPU-powered inference and Kubernetes to managed databases and storage, get everything you need to build, scale, and deploy intelligent applications.
