By Cristian Marius Tiutiu and Bikram Gupta

Introduction
A Kubernetes event is an object that shows what’s happening inside a cluster, node, pod, or container. These objects are usually generated in response to changes that occur inside your K8s system. For example, phases across a pod’s lifecycle—like a transition from pending to running, or statuses like successful or failed may trigger a K8s event. The Kubernetes API Server enables all core components to create these events. Generally, each event is accompanied by a log message as well. Event objects are not regular log events, therefore the Kubernetes logs do not include them. Kubernetes has no built-in support to store or forward these events in the long term, and they are cleaned up after a short retention time defaulting to just 1 hour.
To overcome this, a dedicated application inside the Kubernetes cluster can watch these events on the API Server and write them to the standard output, where you can collect them using Loki.
In this tutorial, you will learn how to configure the Kubernetes Events Exporter and collect and persist those events using Loki. The event exporter allows exporting the often missed Kubernetes events to various outputs so that they can be used for observability or alerting purposes.
Prerequisites
To complete this tutorial, you will need:
- A Git client, for cloning the Starter Kit repository.
- Helm, for installing the Loki stack chart.
- Kubectl, for Kubernetes interaction.
- A text editor with YAML lint support, for example: Visual Studio Code.
- Emojivoto Sample App deployed in the cluster. Please follow the steps in its README file.
- Prometheus Stack and Loki installed and configured.
Step 1 - Installing Event Exporter
In this step, you will learn how to deploy Event Exporter to your DOKS cluster, using kubectl.
First, clone the Starter Kit repository, and then change the directory to your local copy:
git clone https://github.com/digitalocean/Kubernetes-Starter-Kit-Developers.git

cd Kubernetes-Starter-Kit-Developers
Next, open and inspect the 04-setup-observability/assets/manifests/event-exporter/event-exporter-roles.yaml file from the Starter Kit repository and adjust it according to your needs.
3. Next, create the ServiceAccount, ClusterRole, and ClusterRoleBinding by applying the 04-setup-observability/assets/manifests/event-exporter/event-exporter-roles.yaml values file:
kubectl apply -f 04-setup-observability/assets/manifests/event-exporter/event-exporter-roles.yaml
The output looks similar to the following:
namespace/event-exporter created
serviceaccount/event-exporter created
clusterrolebinding.rbac.authorization.k8s.io/event-exporter created
Next create the event exporter config by applying the 04-setup-observability/assets/manifests/event-exporter/event-exporter-config.yaml values file. Configuration is done via a ConfigMap. The tool watches all events and the user has the option to filter out some events, according to their properties. The events will be dumped to stdout where they will be picked up by Loki with no other additional configuration required. Please see the Event Exporter Repository for any additional configuration.
kubectl apply -f 04-setup-observability/assets/manifests/event-exporter/event-exporter-config.yaml
You can inspect the config map by exporting it to a local yaml file via:
kubectl get cm event-exporter-cfg -n event-exporter -o yaml > event-exporter-config.yaml
Then, open the event-exporter-config.yaml file using a text editor of your choice (preferably with YAML support).
code event-exporter-config.yaml
Finally, create the event exporter deployment by applying the 04-setup-observability/assets/manifests/event-exporter/event-exporter-deployment.yaml.
kubectl apply -f 04-setup-observability/assets/manifests/event-exporter/event-exporter-deployment.yaml
Inspect all the Kubernetes resources created for Event Exporter:
kubectl get all -n event-exporter
The output looks similar to:
NAME                                  READY   STATUS    RESTARTS   AGE
pod/event-exporter-6988454f57-9xlrb   1/1     Running   0          7s

NAME                             READY   UP-TO-DATE   AVAILABLE   AGE
deployment.apps/event-exporter   1/1     1            1           9s

NAME                                        DESIRED   CURRENT   READY   AGE
replicaset.apps/event-exporter-6988454f57   1         1         1       9s
Step 2 - Viewing Events in Grafana
If the installation went well and no errors were reported you should start seeing the event start to flow in Grafana.
Connect to Grafana (using default credentials: admin/prom-operator) by port forwarding to the local machine:
kubectl --namespace monitoring port-forward svc/kube-prom-stack-grafana 3000:80
Open localhost:3000 on a web browser. Go to the Explore menu and select Loki as a data source.
In the Log browser input enter the following:
{app="event-exporter"}
You should see events in the Logs section.

To simulate a realistic event, you can downscale the number of replicas for the emojivoto deployment and check out the events in Grafana:
From your terminal run the following command to bring the number of replicas for the /emoji deployment to 0:
kubectl scale --replicas=0 deployment/emoji -n emojivoto
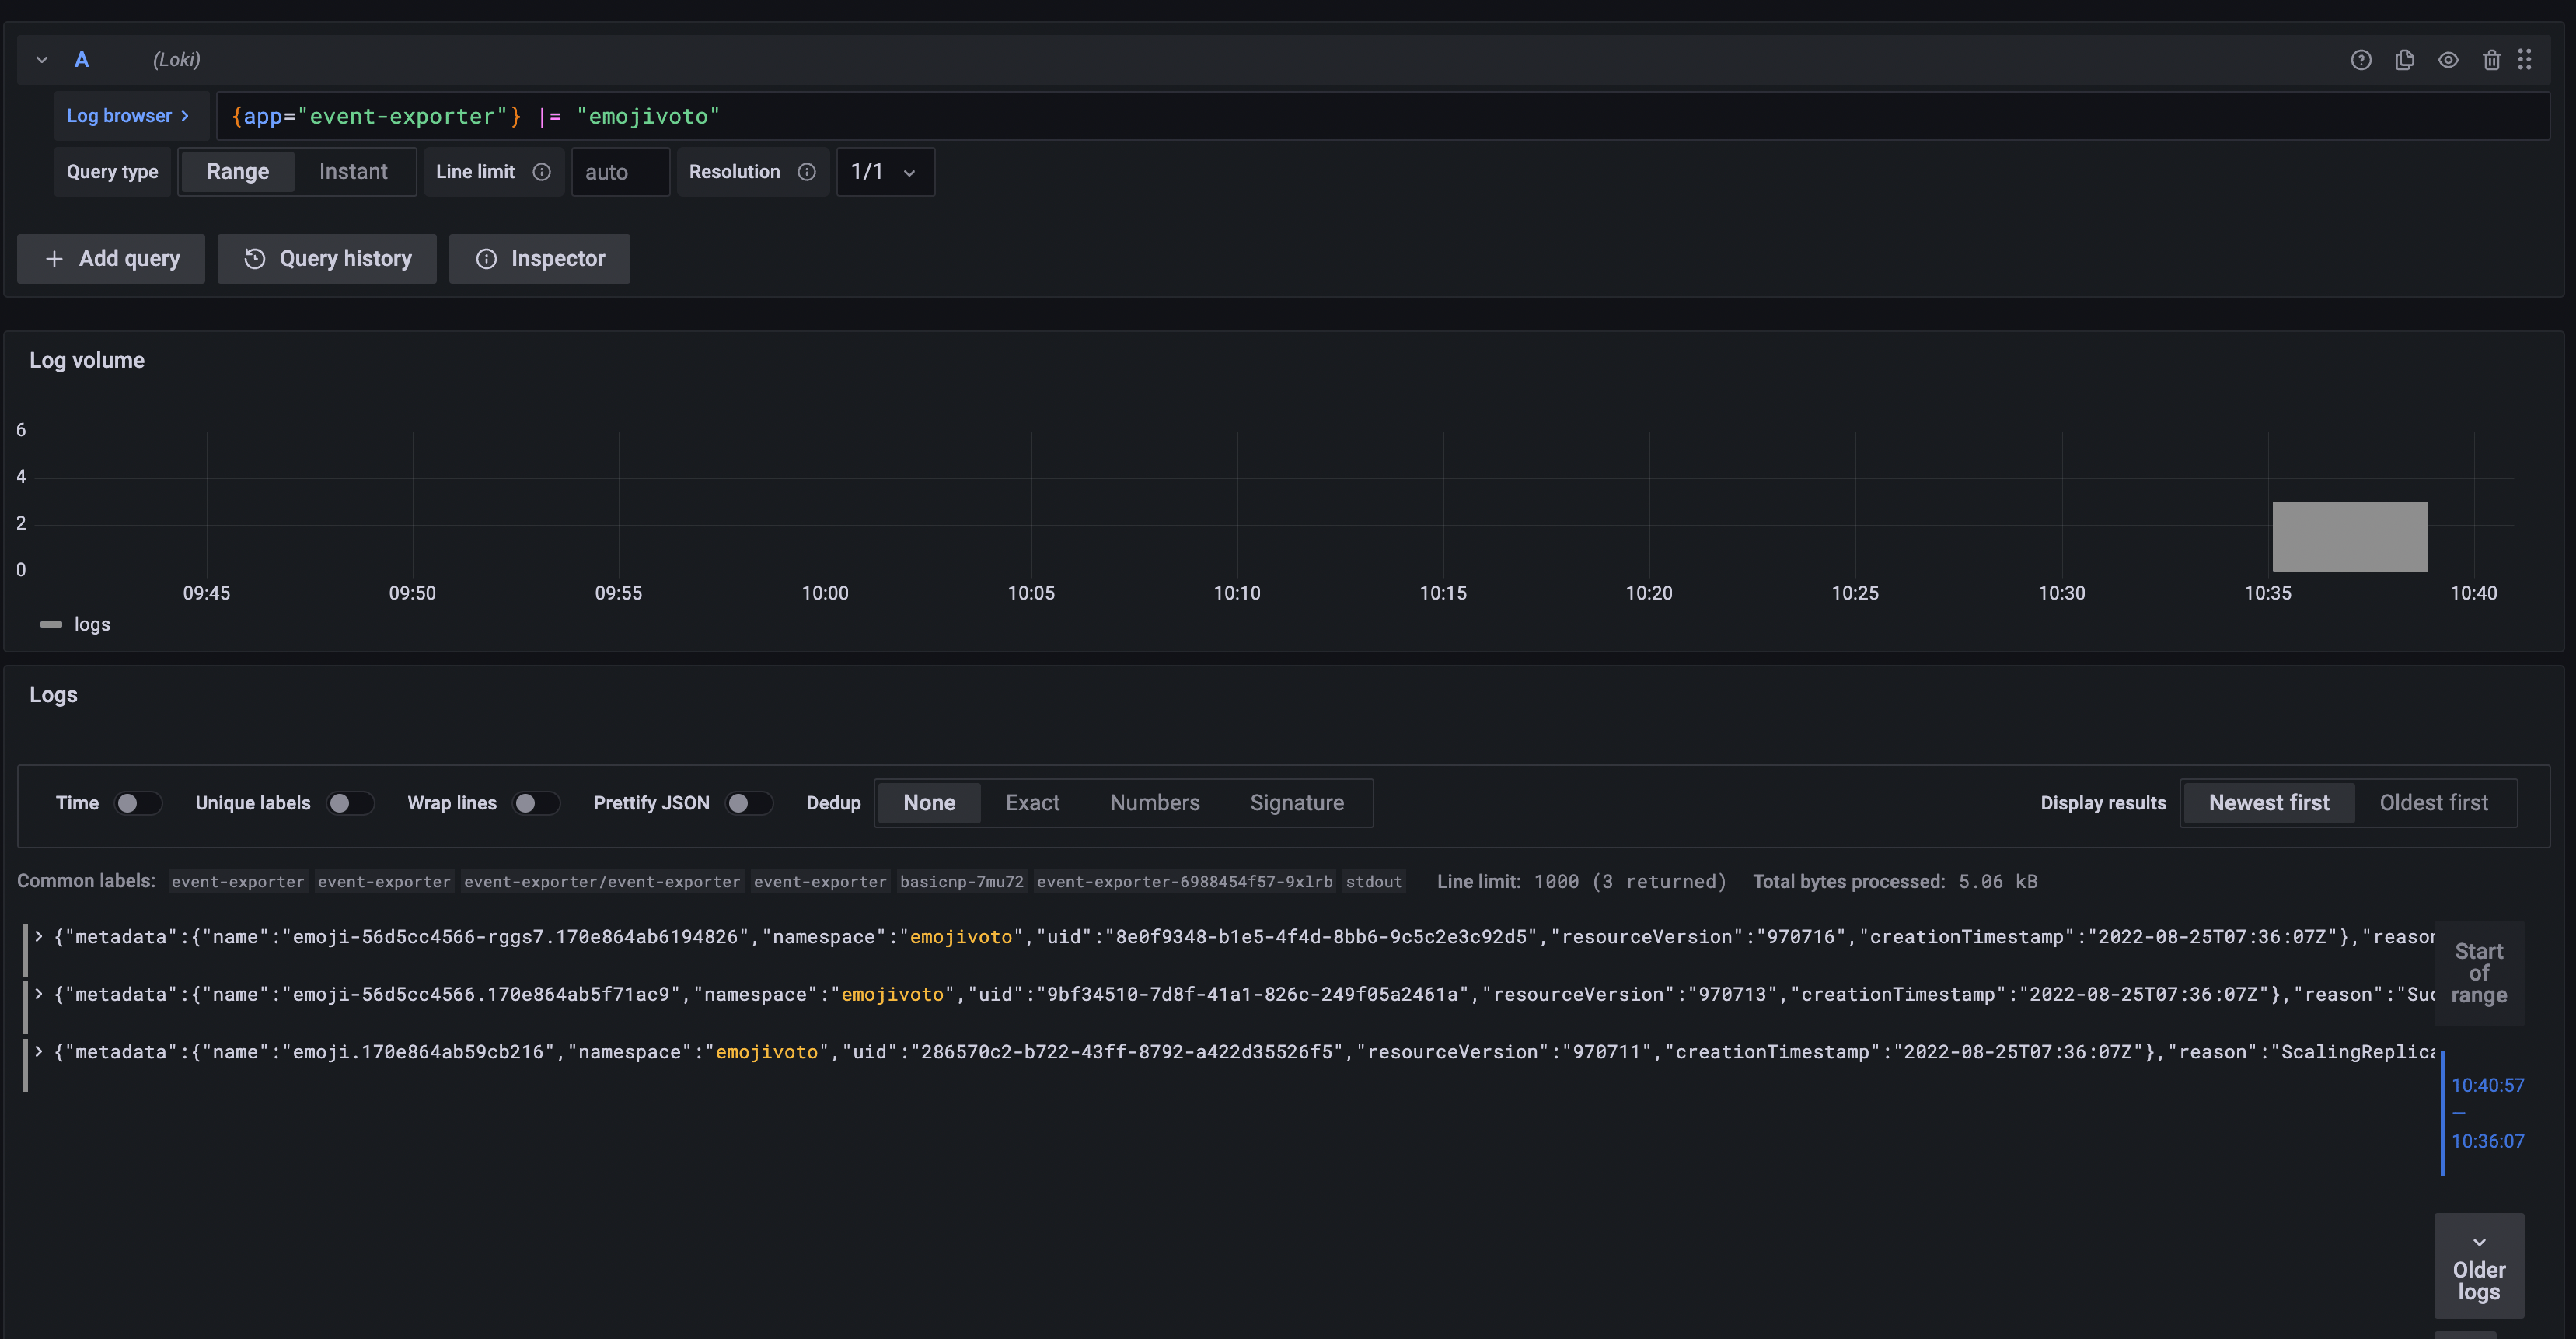
From the Log browser input in Grafana, proceed to enter the following query:
{app="event-exporter"} |= "emojivoto"
Using this filter the results will only include the emojivoto namespace. You should see the filtered events in the Logs section.
Expand on a log to see its details. The log contains a lot of useful information such as the node the pod was deployed on, the message and the namespace, etc. These fields can be further used to perform queries.
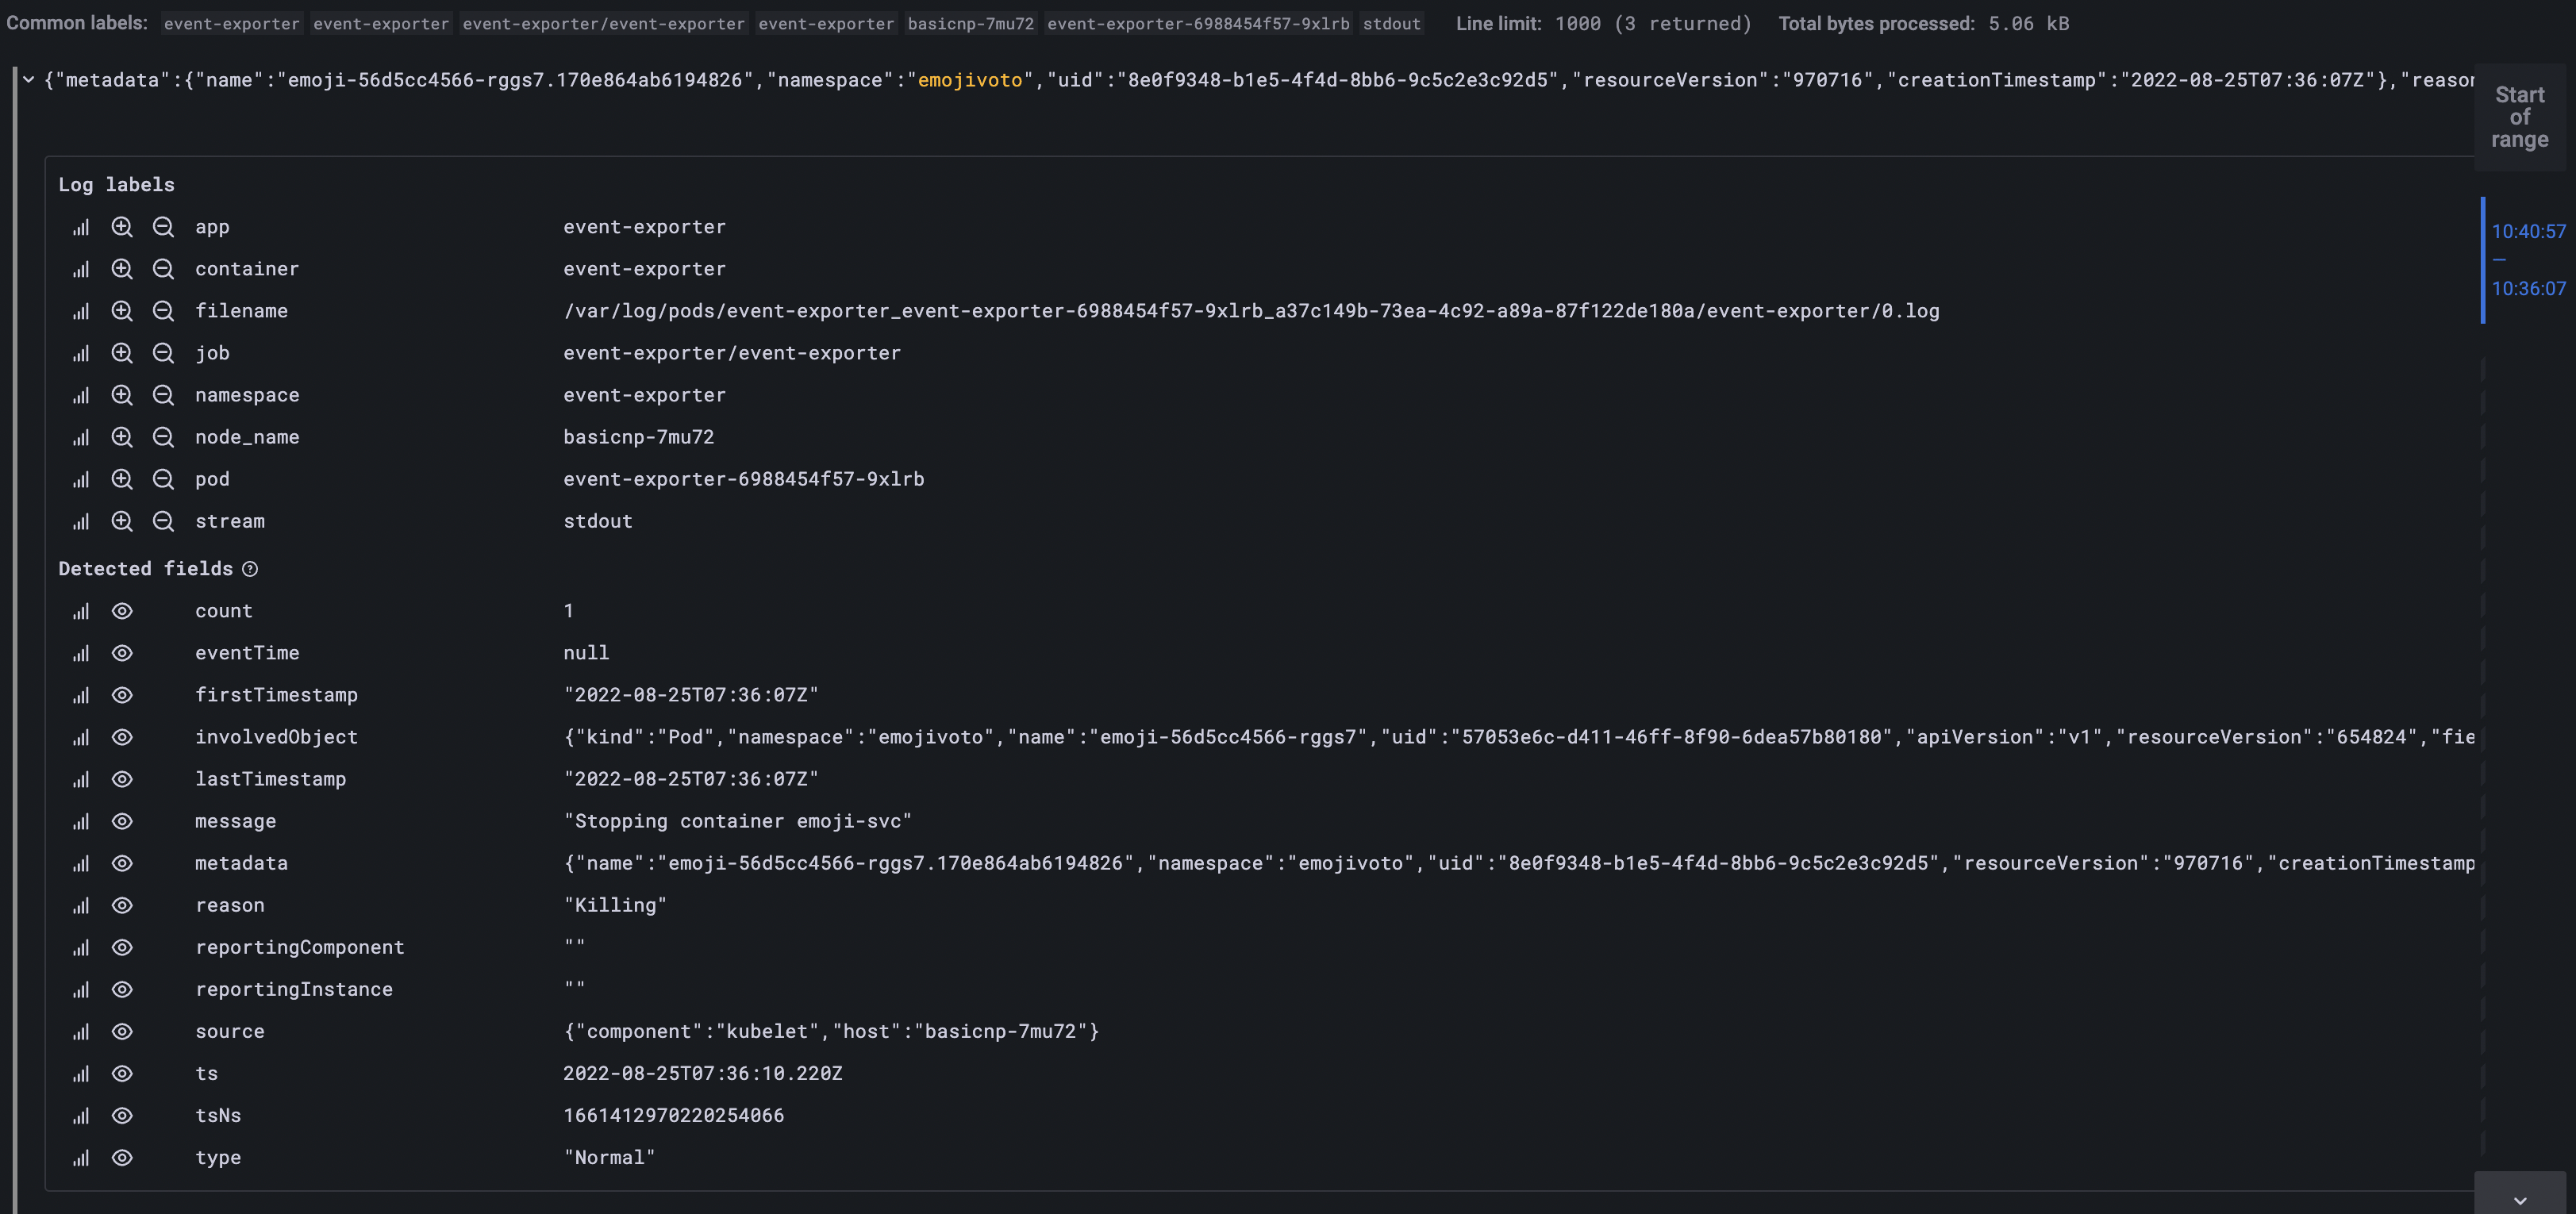
Any of the fields in the Detected fields section of a log detail view can be used to query. For example, you can perform a query using the pod name and view specific logs for a certain pod.
{app="event-exporter"} |= "emoji-56d5cc4566-rggs7"
Since storage and retention have been configured for Loki, the events will persist and will not be wiped after 1 hour.
Conclusion
In this tutorial, you learned how to install Event Exporter for event forwarding in your DOKS cluster. Then, you used Grafana together with the Loki data source to view those events.
Learn More
The next step is to set Alerts and Notification in your DOKS cluster.
Thanks for learning with the DigitalOcean Community. Check out our offerings for compute, storage, networking, and managed databases.
About the author(s)
Still looking for an answer?
This textbox defaults to using Markdown to format your answer.
You can type !ref in this text area to quickly search our full set of tutorials, documentation & marketplace offerings and insert the link!
 This work is licensed under a Creative Commons Attribution-NonCommercial- ShareAlike 4.0 International License.
Become a contributor for community
Get paid to write technical tutorials and select a tech-focused charity to receive a matching donation.

DigitalOcean Documentation
Full documentation for every DigitalOcean product.

Resources for startups and AI-native businesses
The Wave has everything you need to know about building a business, from raising funding to marketing your product.
The developer cloud
Scale up as you grow — whether you're running one virtual machine or ten thousand.

Start building today
From GPU-powered inference and Kubernetes to managed databases and storage, get everything you need to build, scale, and deploy intelligent applications.
