By Adrien Payong and Shaoni Mukherjee

Introduction
Modern GPUs provide incredible compute throughput; however, truly achieving performance on CUDA often involves much more than “just launching more threads.” Developers who take CUDA seriously soon realize there’s a gap between syntax knowledge and performance reasoning. Tutorials either leave you after the introductory examples or leap right into disjointed optimization hacks with little to no explanation on why they work (or when to use them).
This CUDA guide aims to fill that gap.
This guide approached CUDA from a systems-minded, architecture-aware perspective. The intent is to allow you to reason about how your CUDA code actually maps to real GPU hardware, how performance bottlenecks emerge, and how to leverage modern profiling tools to make intelligent decisions when optimizing. Once you learn how to reason about execution, memory motion, and scheduling, optimization stops being guesswork and becomes a disciplined engineering process.
Key Takeaways
- CUDA performance is about reasoning, not syntax. Understanding how threads, warps, blocks, and SMs map onto hardware is more important than knowing API calls.
- Memory behavior dominates real performance. Most kernels are memory-bound; coalescing, caching, and data reuse usually matter more than raw FLOPS.
- Warps are the execution unit that matters. SIMT execution and warp divergence directly determine efficiency—design control flow and block sizes around warp behavior.
- Occupancy is a means, not a goal. Enough warps are needed to hide latency, but chasing 100% occupancy often hurts performance due to register pressure and spills.
- Profiling drives optimization. Nsight Systems identifies where time is spent; Nsight Compute explains why. Measure first, optimize second, re-measure always.
What is CUDA?
CUDA stands for Compute Unified Device Architecture. CUDA is a parallel computing platform and programming model developed by NVIDIA for general computing on graphical processing units (GPUs). It allows developers to write programs that execute parallel workloads offloaded from the CPU (host) to one or more GPUs (devices). In CUDA programming terms, the GPU is considered an accelerator.
CUDA is neither an operating system nor an independent language. CUDA apps are programmed using standard C/C++ with some additional CUDA keywords (ex., __global__ for CUDA kernels) and libraries that allow your code to execute on the GPU. (CUDA contains both a low-level Driver API and higher-level Runtime API – functions such as cudaMalloc, cudaMemcpy – to help abstract GPU tasks.) CUDA allows heterogeneous computing, which means that the GPU contains its own device memory, separate from the CPU’s host memory. When using CUDA, you manage the memory between host and device explicitly (ex., cudaMemcpy). Threads are launched in programs to perform data parallel operations.
CUDA Execution Model: Threads, Warps, Blocks, and Grids
This section develops the mental model necessary for reasoning about CUDA performance. CUDA exposes a hierarchical execution model — threads → warps → blocks → grids — that maps your kernel onto GPU hardware.
Cooperation Rules: What Threads Can and Can’t Do
CUDA programs implement the task to be performed on the GPU as kernels, which are functions compiled to run on the CUDA device. When a kernel is launched from the host, it specifies a grid of thread blocks, where each thread block consists of many threads executing in parallel. A grid can be conceptually viewed as an array of blocks (1D, 2D, or 3D). Each thread executes instances of the kernel independently of each other, with its own registers and local memory. CUDA ensures that threads within a block can cooperate by synchronizing and sharing data (using barrier synchronizations and shared memory); threads in different blocks, however, have no direct means of synchronizing or sharing memory. Explicitly, the CUDA programming model assumes that there are no dependencies between different thread blocks; the blocks could execute in any order, and the program must still produce the correct result.
Warp Execution: SIMT, Divergence, and Block Size Choices
Threads within a block are organized into warps. A warp consists of 32 threads and represents a hardware scheduling unit: warps execute in SIMT (single-instruction, multiple threads) fashion; all threads of a warp execute the same instruction (on different data) at the same time. If every thread of a warp reaches some instruction that loads/stores from/to memory, then all of the loads/stores for that warp are performed in parallel. On the other hand, if threads diverge (due to a branch), then the underlying hardware must serialize execution of that branch: the threads that do not take the branch are masked off, and the others can continue.
Warp divergence results in a high-performance penalty since it underutilizes the GPU’s parallel lanes. In practice, the best performance will be achieved when all threads of a warp take the same execution path. Thread block sizes should generally be multiples of the warp size (32, 64, 128, 256, 512). This generally eliminates shortcomings of underutilization in the final warp, and matches warp scheduling granularity with block shape.
CUDA Execution Hierarchy and Warp-Level SIMT Behavior
Let’s consider the following diagram:
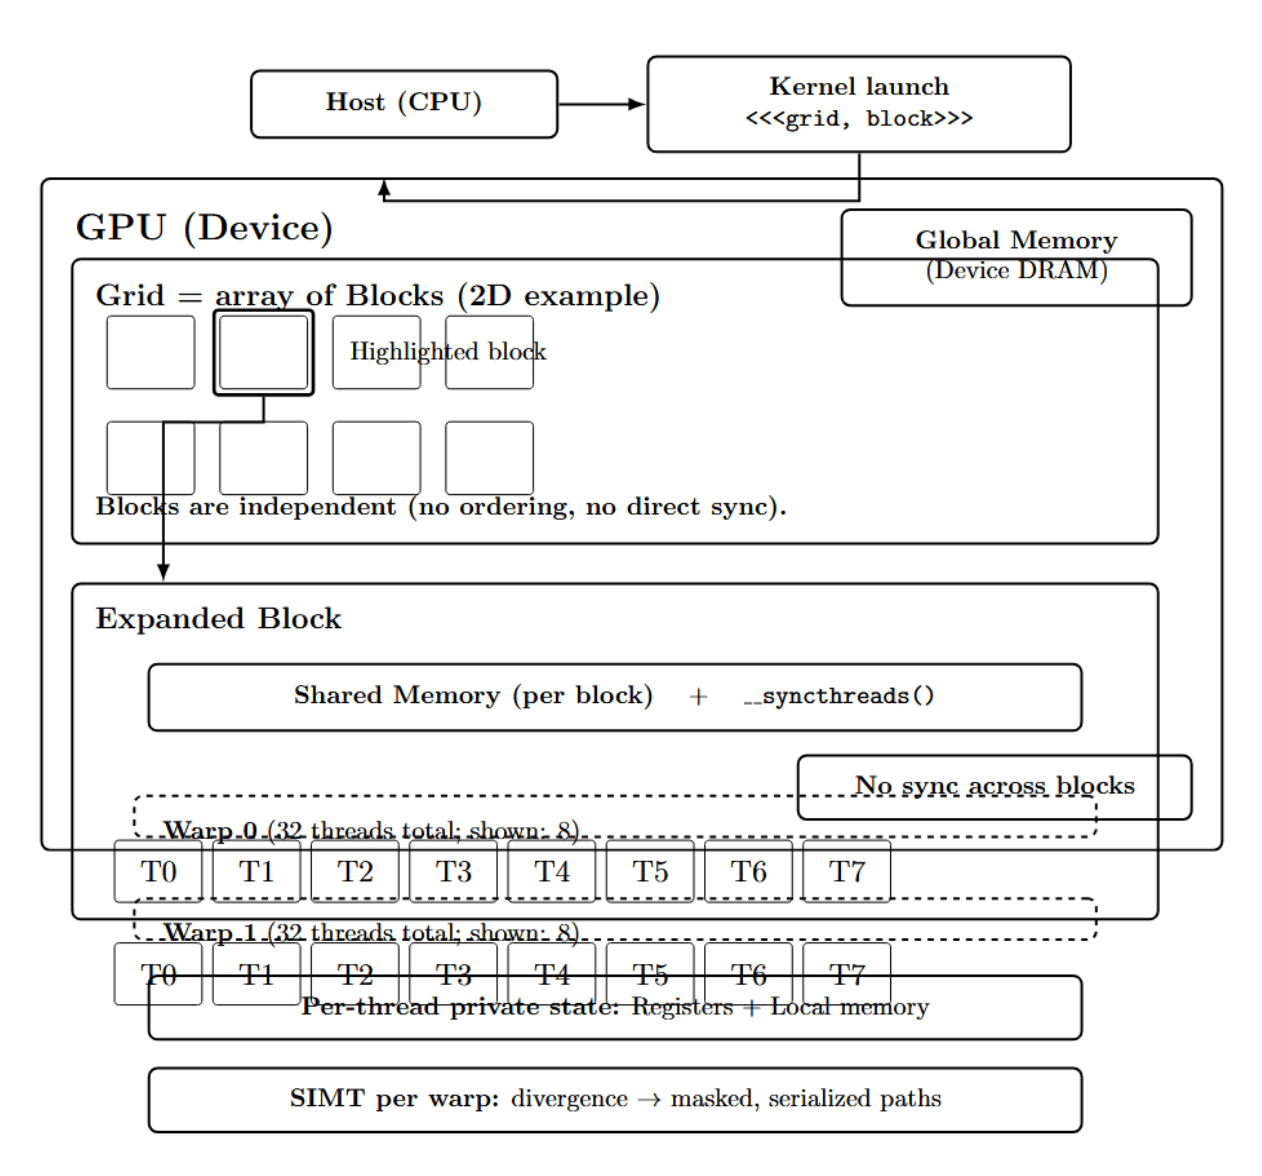
In the diagram above, the kernel launch specifies a grid of blocks. Each block comprises many threads, which are scheduled as warps containing 32 threads. Threads within a block may cooperate through shared memory and barrier synchronization (e.g., syncthreads()). Blocks cannot directly synchronize or share memory; they are independent. Blocks do not have guaranteed ordering. SIMT programming model is applied within a warp; warp branch divergence leads to masked execution of parallel paths and serialization of divergent branches.
CUDA’s hierarchy can be summarized as:
- Grid -- the collective set of all threads launched by a kernel
- Block -- Grid is subdivided into blocks
- Warp -- Block is subdivided into Warps of 32 threads
- Thread -- Each thread has its own index (blockIdx, threadIdx), which it uses to determine what data it should compute on.
This three-tier hierarchy enables kernels to operate on arbitrarily large data sets because blocks can be scheduled in any order by the available hardware. The abstraction of the programming model also hides how warps are scheduled onto the GPU hardware.
GPU Architecture Basics (Affecting Performance)
To optimize the kernel, you must first develop a hardware-first mental model of where performance comes from: how work is scheduled onto SMs, what on-chip resources are limited (registers, shared memory/L1, warp issue slots), and how memory hierarchy impacts latency and bandwidth. Below, we map those hardware constraints directly to practical outcomes such as occupancy, spilling, and latency hiding.
Streaming Multiprocessor Essentials: The Warp Execution Engine
Modern NVIDIA GPUs have Streaming Multiprocessors (SM). A Streaming Multiprocessor is simply a block of GPU compute hardware responsible for scheduling/executing warps. It contains many resources, such as functional units (FP/int ALUs, special function units, etc.), a large register file, on-chip shared memory, and a configurable L1 data cache. All SMs have access to a shared L2 cache, as well as access to off-chip global DRAM memory. Using NVIDIA’s own words from the Programming Guide: “Each SM contains a local register file, a unified data cache, and functional units.” The unified cache includes both the L1 cache and the space for shared memory (allocation to each can typically be tuned by the programmer).
Key hardware resources are limited on a per SM basis. For example, an NVIDIA Ampere or Hopper GPU SM may have around 64–128 KB of registers and 64–96 KB of configurable L1/shared memory. Further, there may only be a small number of warp schedulers (typically 2 or 4) that can issue instructions from each SM per cycle.
Resource Limits and Occupancy: Registers, Shared Memory, and Spills
However, the practical manifestation of these limits is related to occupancy: too many threads (or threads requesting too many registers) can saturate an SM’s registers or shared memory. For example, on CC 7.0 (Volta), we had an SM with 65,536 32-bit registers and 2048 threads of concurrency (64 warps). If each thread used 32 registers, then the SM could schedule up to 100% occupancy (2048 threads * 32 registers = 65,536). However, if each thread uses 64 registers, only 1024 total threads will fit (65,536/64 = 1024 threads), which reduces our occupancy. In practice, we often limit registers or tune block size to get “good enough” occupancy while avoiding spilling into local memory.
Warp Scheduling on an SM: Round-Robin Issue, Latency Hiding, and the Occupancy Ceiling
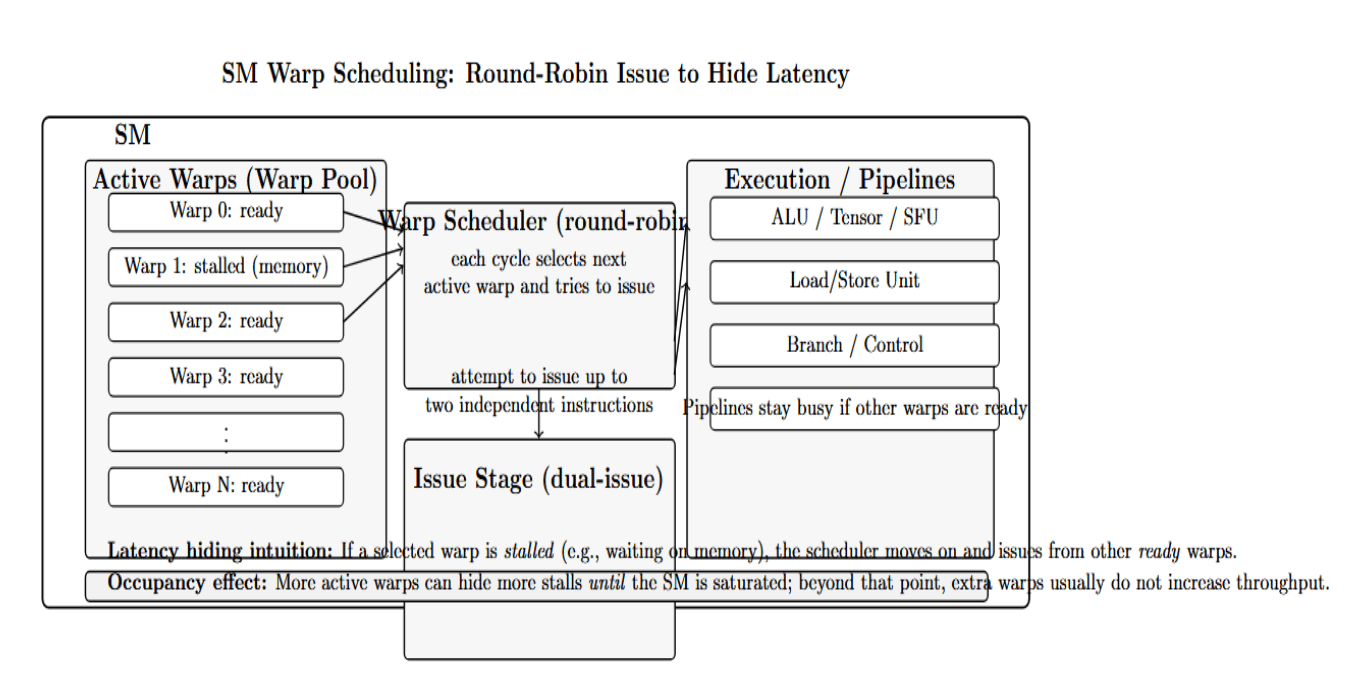
One hardware characteristic is warp scheduling. The SM will cycle through each of its active warps in a round-robin (dual-issue) fashion and attempt to issue instructions.
In summary, the main hardware units to keep in mind are:
- SMs – There can be many blocks/warps executing on an SM concurrently. The maximum number of blocks per SM is determined by registers, shared memory, and the maximum number of threads.
- Registers – fastest memory, private to threads. If you use too many registers per thread, then you can lower the number of warps that can execute concurrently.
- Shared memory / L1 cache – on-chip scratchpad for each SM, has very low latency if access is bank-conflict free. Banks are normally 32 banks per SM (One bank for every 32-bit word). Shared memory access patterns must be designed around avoiding bank conflicts.
- L2 cache – On-chip (larger, slower) cache that is shared by all SMs.
- Global (device) memory – off-chip DRAM with high bandwidth but significantly higher latency. Must optimize global memory access patterns (coalescing).
CUDA Memory Hierarchy
CUDA has multiple memory spaces, each with different latency, bandwidth, and scope. From fastest to slowest:
- Registers: Each thread has its own private register file. Registers have essentially zero latency and the highest bandwidth. Where appropriate, compilers will place frequently accessed local variables in registers. (Registers are not explicitly present in code; they are handled by the compiler.
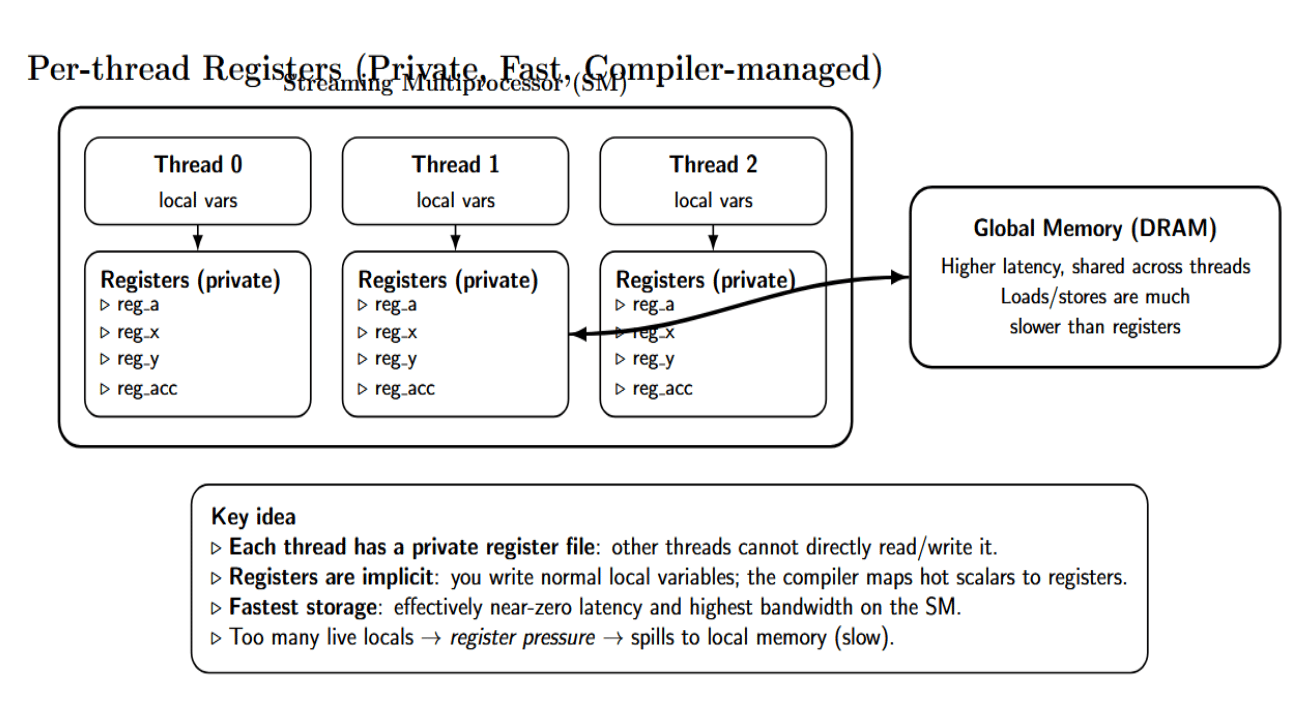
- Local memory: If local variables require more memory than is available in registers (for instance, spilled variables), the compiler allocates this memory in local memory. Physically, this memory resides in global memory (device DRAM). Accessing this memory is as low as accessing global memory directly, so avoiding spills is important.
- Shared memory (SMEM): An explicitly managed on-chip memory space that is shared by threads in a thread block (this scope has a limited lifetime). Threads within a block can quickly read/write (~ tens of cycles) to a region of shared memory. Shared memory is partitioned into banks to support simultaneous access. If each of the 32 threads in a warp accesses a distinct bank, all loads/stores happen in one cycle.
- L1 cache: Loads from global memory often pass through an L1 cache (sometimes referred to as shared memory, depending on how the programmer configured it) on many GPUs. (In newer architectures, Ampere/Hopper, there are separate “L1” caches for data and texture/constant.) The total L1 cache size per SM is usually around 128–192 KB. L1 caches help hide the latency of reused data within a warp or block.
- L2 cache: There is also a unified L2 cache (typically a few MBs) that is shared by all SMs. All global memory requests pass through the L2 cache. L2 caches memory across blocks and can help reduce off-chip traffic if your program reuses data across warps / SMs.
- Global (device) memory: This is the largest memory on the device, usually found in off-chip DRAM. Global memory has the highest bandwidth (~hundreds of GB/s) but also high latency (~hundreds of cycles). Poor access patterns to global memory can easily waste memory bandwidth.
Memory Coalescing
Global memory accesses in 32-, 64-, or 128-byte chunks (depending on architecture and access size). The CUDA memory subsystem tries to combine memory accesses issued by a warp into as few transactions as possible.
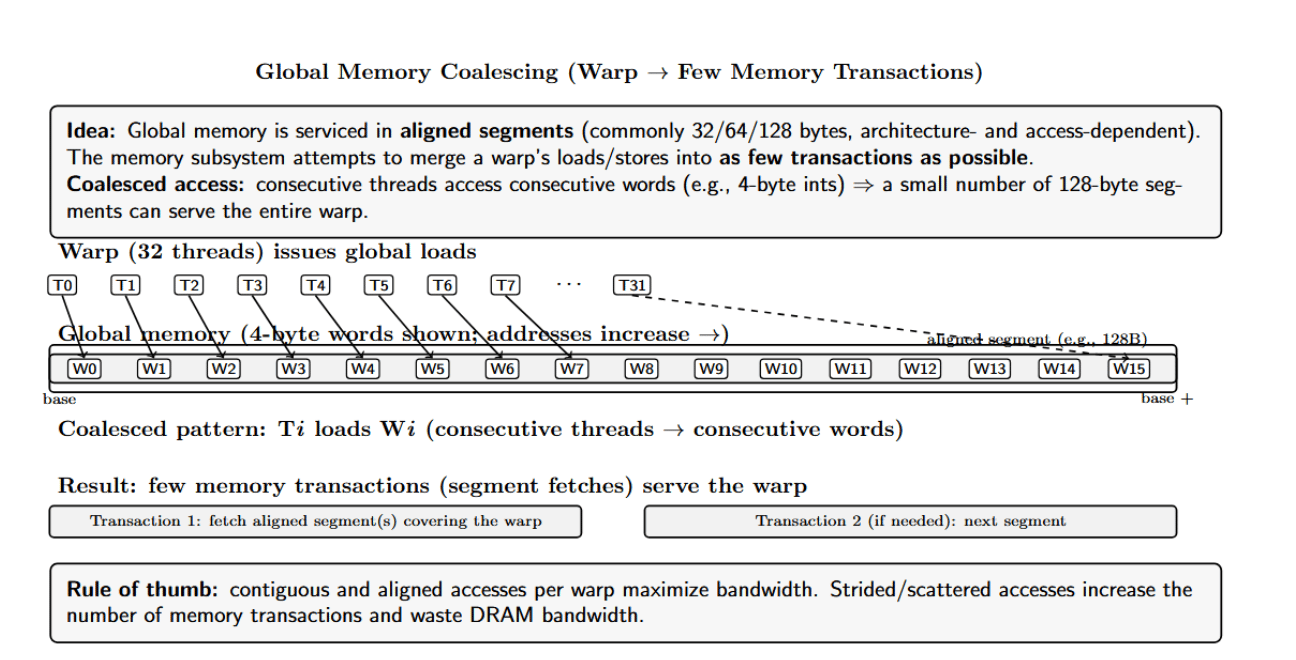
If, for example, consecutive threads in a warp access consecutive 4-byte words in global memory, all accesses can be satisfied by fetching a few 128-byte segments. We call this coalesced access. When memory accesses are uncoalesced (e.g., threads access memory with a large stride), many bytes are wasted.
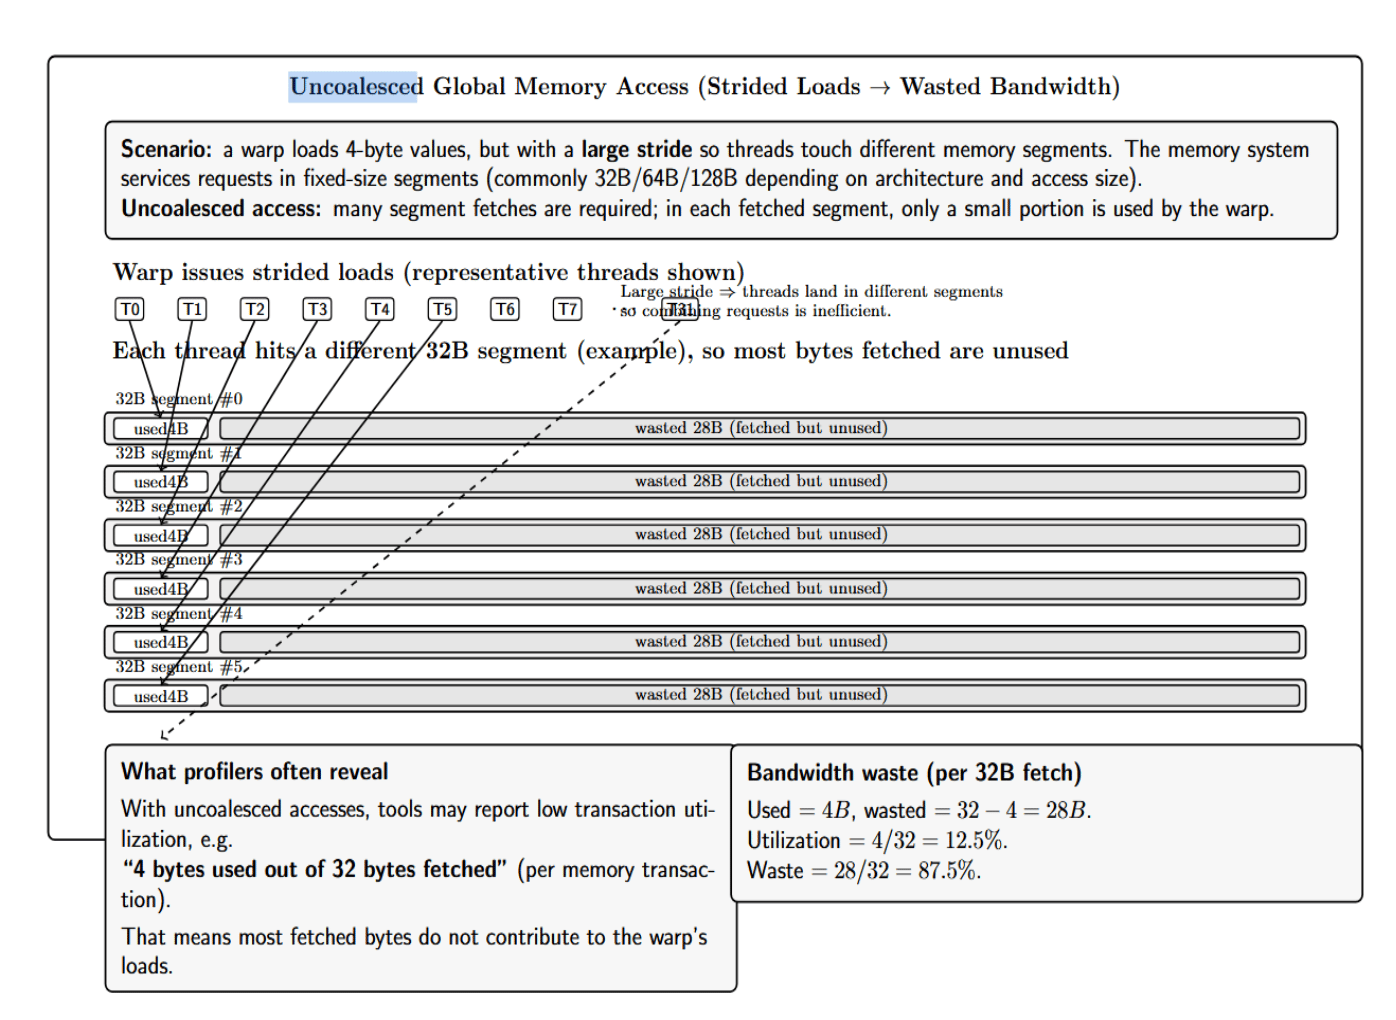
For every 32 bytes fetched from global memory, only a fraction of the data is used by the threads. NVIDIA tools will show that, in such a case, each load is using only 4 bytes out of 32. That’s 87.5% wasted bandwidth!
For high global memory throughput, align and access memory in consecutive threads. Strided/scattered memory accesses result in transactions with mostly empty data; this reduces effective bandwidth. In practice, this means shaping data structures and loop indices such that thread tid accesses array[tid], or a small piece-wise contiguous block per thread, instead of a strided access pattern.
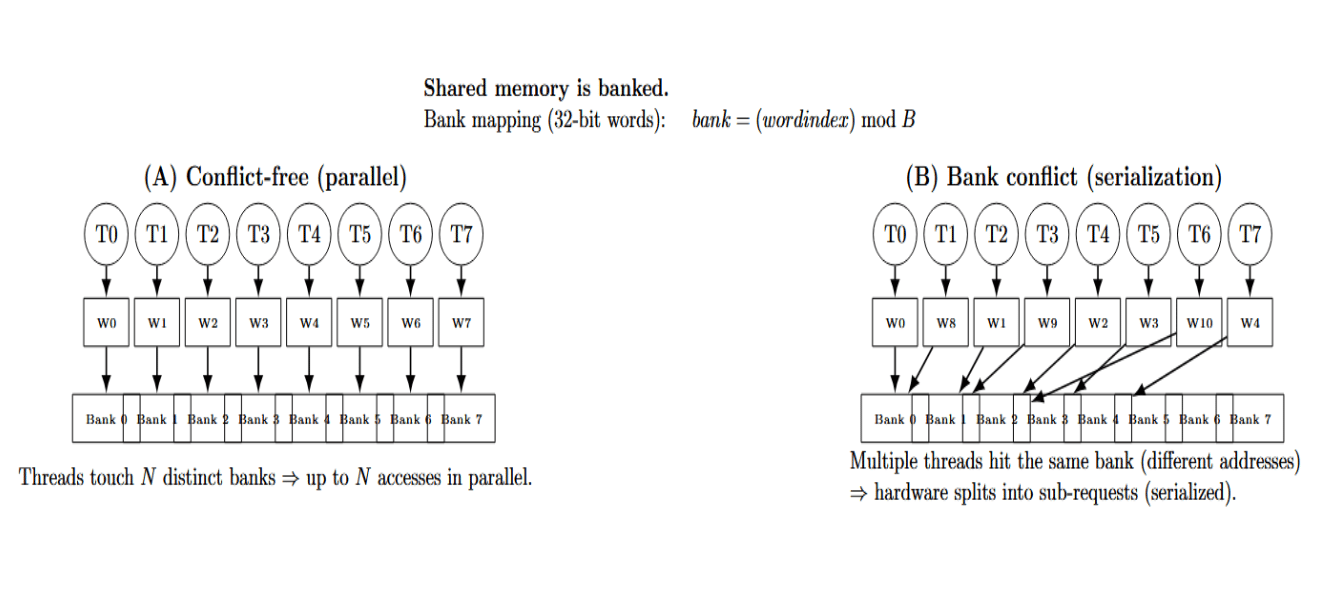
Shared Memory Bank Conflicts
Shared memory is divided logically into banks (there are 32 on modern GPUs, one for each 32-bit word). Each memory address maps to a bank according to its address index. If threads in a warp access memory addresses that are in N banks, then those N memory accesses can be performed in parallel. This will achieve N× the bandwidth of a single bank access. However, if multiple threads access the same bank (and different addresses), a bank conflict occurs: the hardware must issue multiple sub-requests, serializing them. The following diagram illustrates this:
Other Memory Spaces
- Constant memory: Cached read-only memory accessible by all threads. Useful for small amounts of data that can be broadcast to each thread.
- Texture memory: Cached read-only memory optimized for 2D spatial locality. Useful for graphics or data interpolation.
- Unified Virtual Memory (UVM): CUDA runtime capability of allowing CPU and GPU to share a common address space. Pages are migrated on demand by the system as needed. Allows simpler programming models but can suffer from hidden page faults if used improperly.
Since most real-world kernels are memory-bound, the biggest wins come from coalescing, caching, and maximizing reuse of data (in registers or shared memory).
Performance Models That Engineers Use
These models provide you with a fast way to determine whether your kernel is compute-bound, memory-bound, or latency/occupancy bound. This way, you can focus your optimizations where they will have the most effect.
Compute-Bound vs. Memory-Bound (Arithmetic Intensity and Roofline Thinking)
CUDA engineers frame performance questions as compute-bound versus memory-bound. Compute-bound means that your kernel has enough arithmetic ops per byte accessed to saturate the GPU’s ALUs (floating-point units). Large dense matrix multiplication kernels are the classic example of compute-bound. These approach the GPU’s peak FLOPS rate easily (90–95% of theoretical peak).
Memory-bound kernels exhibit low arithmetic intensity (low FLOPs/byte), and they achieve peak performance when they saturate memory bandwidth. For example, a reduction (sum) kernel performs one addition for every two reads, so it will almost never execute above a low percentage of peak FLOPS; instead, it will saturate memory bandwidth.
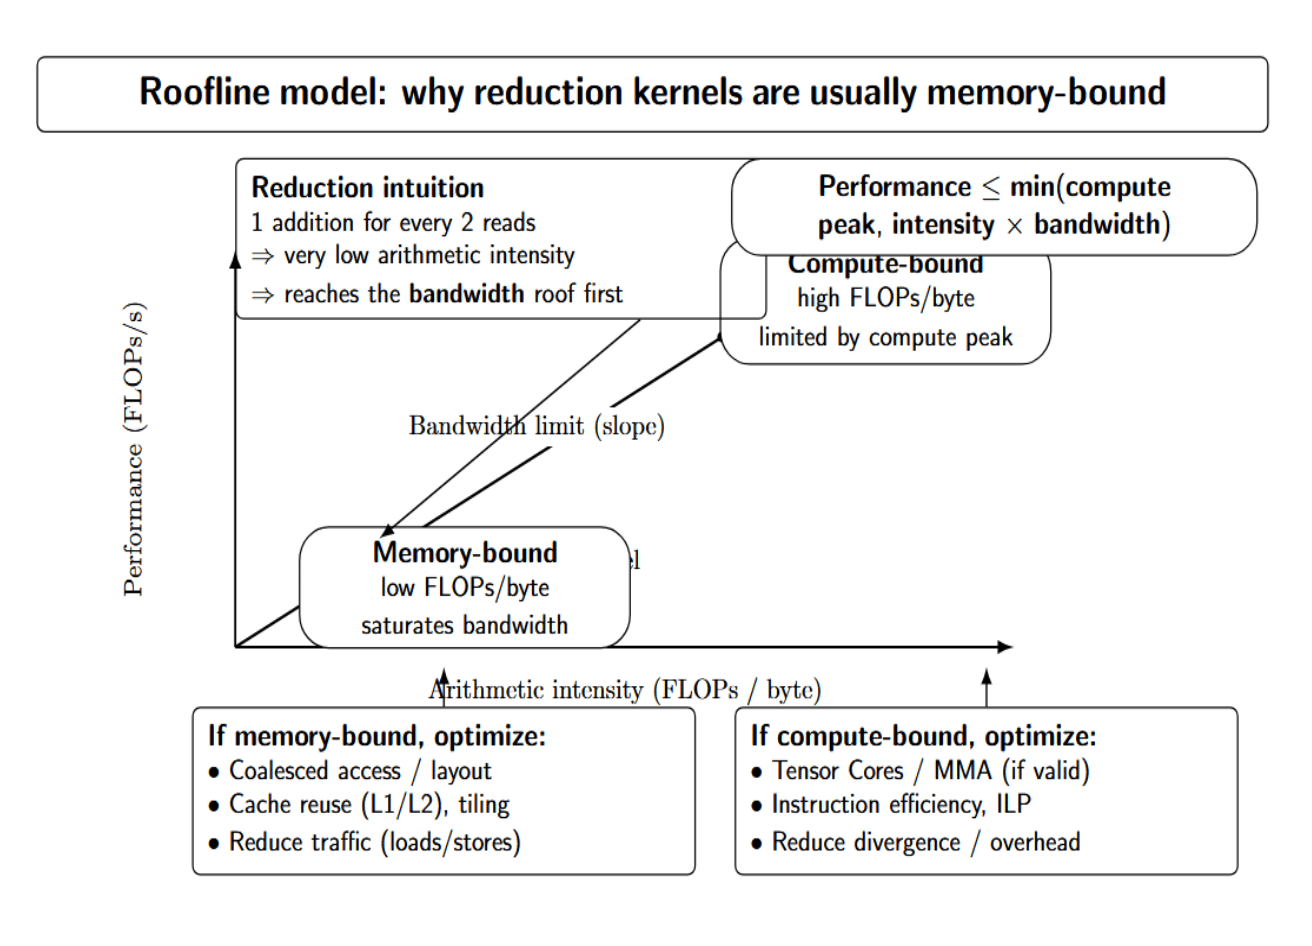
Understanding whether a kernel is memory- vs compute-bound can help you understand where to focus optimization efforts: memory-bound kernels have more to gain from careful data layout/caching, while compute-bound kernels may benefit from using Tensor Cores or tweaking instruction-level efficiency. You can think of it simply as the roofline model:
performance ≤ min(compute_peak, arithmetic_intensity × bandwidth) No formulas needed here, but conceptually, if the measured performance is much less than both of these limits, you likely have some bottleneck(s) (like bad memory access patterns).
Occupancy vs. Latency Hiding (Why “100% Occupancy” Isn’t the Goal)
Another key terminology issue is occupancy vs. latency hiding. Occupancy is the ratio of active warps to maximum possible warps per SM. High occupancy ensures there are enough warps resident on each SM to hide memory latency: when one warp is waiting on memory, another can issue and execute. However, high occupancy does not automatically equal high performance.
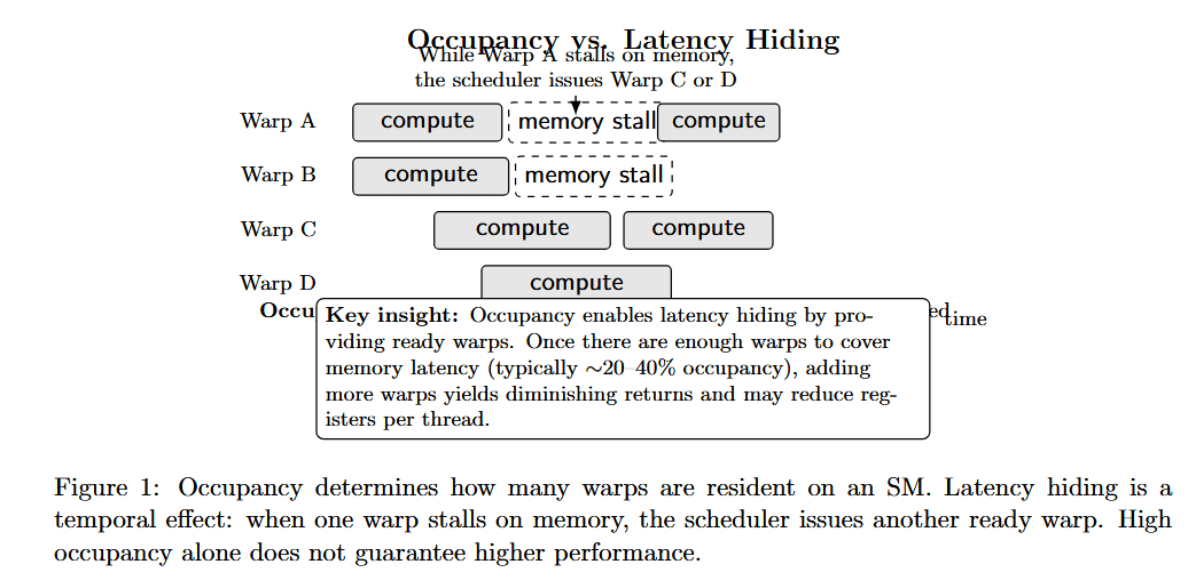
You will find that, if occupancy is over some modest amount (say 20–40%), then there are diminishing returns from adding more threads to your block. You may even see your performance decrease when using higher occupancy if you have fewer threads (lower occupancy) but more registers per thread. So instead of optimizing for 100% occupancy, target the real bottleneck: if you’re memory-bound, utilize occupancy to hide latency. If you are compute-bound, make sure you are feeding your ALUs.
Profiling Workflow
Before optimizing, measure where the time and stalls are coming from. NVIDIA provides two main tools:
- Nsight Systems is a system-wide timeline profiler. Using Nsight Systems, you can visualize CPU threads, GPU kernels, memory copies, and host activity on a single timeline. Nsight Systems allows you to view applications to see where kernels and CPU tasks overlap, where the application is idle, and whether the GPU and CPU are well utilized.
- Nsight Compute is a kernel profiler with an emphasis on device metrics. It collects per-kernel performance counters (SM occupancy, issued instructions, memory transactions, and more) and aggregates them into tables for analysis. Using Nsight Compute, you launch your kernel (usually multiple times) and receive metrics such as achieved occupancy, memory throughput, reasons for warp stalls, utilization of load/store instructions, etc. Typically, you can launch Nsight Systems first to identify slow kernels/phases, then launch Nsight Compute to examine metrics for one hot kernel.
Reproducible profiling playbook
Profiling incurs overhead and perturbs timings, so ensuring reproducibility of measurements is very important. Nsight Compute will report deterministic metrics if the application serializes its kernel launches, flushes caches between passes, and “fixes” GPU clocks. However, measurement noise will still be present due to thermal throttling, driver variability, and concurrency with other processes.
To minimize variability:
- Warm up the kernel prior to measuring. Ensure the GPU is at steady clocks and caches are warmed up.
- Fix clock frequencies where possible. On Linux, run nvidia-smi -lgc <min, max> and enable persistence mode.
- Pin kernels to streams and avoid concurrent profiling; Nsight Compute will serialize kernels. This is not true for other profiling tools.
- Flush caches between measurement passes, or use the --cache-control option to control whether caches are flushed between passes.
- Use fixed input sizes and random seeds. Changing problem sizes by even a small amount can change arithmetic intensity and memory access patterns.
- Repeat measurements and report both mean and variance. If you are not using Nsight tools for timing, use cudaEvent timers or nvprof --metrics for low‑overhead timing.
Optimization Playbook: Symptom → Cause → Fix
Based on profiling and experience, we can outline common symptoms and corresponding actions:
| Symptom | Likely Cause(s) | Recommended Fix (Decision Rules) |
|---|---|---|
| Low achieved memory bandwidth (and low FLOPS) | Uncoalesced or inefficient global memory accesses. Excessive global memory traffic (too many loads/stores). Poor data reuse (not leveraging on-chip memory/caches). | Coalesce global access: ensure warp threads access adjacent addresses (e.g., thread i reads element i or i+1, not i*stride). Reduce transactions: consider smaller data types or vectorized loads (when safe and natural). Increase reuse: stage reused data into registers/shared memory (or rely on L1) to reduce global traffic (e.g., matrix multiply sub-tiles in shared memory). Minimize global I/O per FLOP: reduce redundant reads/writes; keep intermediate values on-chip. |
| High stall rates in Nsight Compute (Mem Dependency / Execution Dependency) | Mem Dependency: long-latency loads; cache misses; redundant loads; poor coalescing. Execution Dependency: long instruction dependency chains. Warp divergence: branching causes serial execution within warps. Shared memory bank conflicts: serialized shared loads/stores. | For Mem Dependency: fix coalescing; reduce redundant loads; consider __ldg() for read-only data if it improves caching. For Execution Dependency: unroll loops; break work into independent instructions to increase instruction-level parallelism (ILP). For divergence: refactor branches (e.g., group flagged elements first); use warp-synchronous patterns to keep warps on the same path. For bank conflicts: pad shared arrays so threads map to different banks (e.g., add a padding column to 2D shared tiles). |
| Many small kernels launched (or low compute per launch) | Kernel launch overhead dominates. Insufficient parallel work per launch. Work is fragmented across many tiny kernels. | Fuse kernels: combine multiple steps into one kernel to reduce launch count. Batch work: avoid launching per row/element in loops; launch one kernel that processes the full workload. Use concurrency tools: use CUDA streams or CUDA Graphs to batch independent tasks and hide launch latency. |
| Low computed throughput (FLOPS) on an arithmetic-heavy kernel | Memory stalls starve ALUs. Poor instruction throughput (inefficient instruction mix). Insufficient instruction-level parallelism (ILP). | Check memory first: confirm the kernel is truly compute-bound (not stalled on memory). Use compute features: prefer intrinsics (e.g., MAD / __fmul_rn) and consider Tensor Cores (mixed precision) when applicable. Vectorize loads: ensure the compiler can use vector loads (e.g., float4) when alignment/layout allows. Increase ILP: unroll loops; restructure to keep multiple ops in-flight. Validate warp availability: use occupancy analysis to ensure enough warps to keep pipelines busy (100% occupancy not required). |
| Limited occupancy (due to registers/shared memory) | Too many registers per thread. Too much shared memory per block. Block size/resource usage prevents more blocks from fitting per SM. | If occupancy is very low (<10–20%), reduce register pressure (restructure code or use -maxrregcount carefully). Reduce the shared memory footprint per block if it blocks residency. Tune block size to increase blocks/SM (while watching for spills and bank conflicts). Use the CUDA Occupancy Calculator or Nsight Compute’s calculator to explore trade-offs (higher registers can still win if they avoid spills). |
Concurrency: Streams and Overlap
The following table tries to capture the different flavors of concurrency offered by CUDA streams.
| Concept | What it means | Why it matters (practical impact) | Notes / Constraints |
|---|---|---|---|
| Default behavior (single stream) | Operations (kernel launches, memory copies) issued in the same stream execute sequentially. | Simple ordering and correctness, but can leave the GPU or copy engine idle (no overlap). | Good baseline; often suboptimal for throughput when transfers and compute can overlap. |
| Multiple streams (concurrency) | Using multiple streams allows the GPU to overlap independent tasks (compute and/or copies) when possible. | Improves utilization by running work in parallel (e.g., copy next batch while computing current batch). | Overlap only happens if operations are truly independent and hardware resources are available. |
| Compute/transfer overlap (pipeline) | While a kernel runs in stream 0, you launch cudaMemcpyAsync in stream 1 to transfer the next inputs. | Hides PCIe/NVLink transfer latency by doing copies on the copy engine while SMs compute. | Modern GPUs may have up to two copy engines (H→D and D→H), enabling fuller overlap when well partitioned. |
| Concurrent kernels (multi-stream) | Launch multiple kernels in different streams so they can run at the same time if SM resources remain. | It can increase throughput when a single kernel does not fully occupy the GPU (unused SM capacity). | True kernel concurrency is often limited; hardware may time-slice kernels instead of fully parallel execution. |
| Main real-world value of streams | Streams are most impactful for overlapping compute with data movement. | Often, the biggest end-to-end speedup comes from hiding transfers rather than running many kernels concurrently. | Always validate overlap in a timeline profiler (e.g., Nsight Systems) to ensure it’s happening. |
Conclusion
Throughout this guide, we took a step back from CUDA syntax and looked at things from a systems perspective. We explored how kernels execute on physical GPU hardware and how an understanding of the execution model, memory hierarchy, and scheduling behavior—along with proper use of the profiling tools—allows you to accurately identify true bottlenecks and apply meaningful optimizations with confidence. Effective CUDA performance comes from reasoning, measuring, and iterating. If you let architectural features and your data guide the optimizations, rather than blindly following your intuition, you’ll find that CUDA programming is an engineering discipline, not a collection of ad-hoc tweaks.
FAQs
Why isn’t launching more threads enough to get good CUDA performance? Because performance is limited by memory access patterns, warp execution, and hardware resource constraints—not just parallelism.
What is the most common CUDA performance bottleneck in practice? Global memory access inefficiency (poor coalescing, low reuse, cache misses) is the dominant bottleneck in most real kernels.
Is high occupancy always good? No. Occupancy above ~20–40% is often sufficient. Beyond that, extra warps rarely help and may reduce performance due to register spills.
When does warp divergence actually hurt? Divergence hurts when different execution paths have comparable work and serialize for many instructions; short or uniform branches are often fine.
Which profiler should I use first: Nsight Systems or Nsight Compute? Start with Nsight Systems to find slow phases and overlap issues, then use Nsight Compute to analyze a one-hot kernel in depth.
Thanks for learning with the DigitalOcean Community. Check out our offerings for compute, storage, networking, and managed databases.
About the author(s)
I am a skilled AI consultant and technical writer with over four years of experience. I have a master’s degree in AI and have written innovative articles that provide developers and researchers with actionable insights. As a thought leader, I specialize in simplifying complex AI concepts through practical content, positioning myself as a trusted voice in the tech community.
With a strong background in data science and over six years of experience, I am passionate about creating in-depth content on technologies. Currently focused on AI, machine learning, and GPU computing, working on topics ranging from deep learning frameworks to optimizing GPU-based workloads.
Still looking for an answer?
This textbox defaults to using Markdown to format your answer.
You can type !ref in this text area to quickly search our full set of tutorials, documentation & marketplace offerings and insert the link!
 This work is licensed under a Creative Commons Attribution-NonCommercial- ShareAlike 4.0 International License.
Become a contributor for community
Get paid to write technical tutorials and select a tech-focused charity to receive a matching donation.

DigitalOcean Documentation
Full documentation for every DigitalOcean product.

Resources for startups and AI-native businesses
The Wave has everything you need to know about building a business, from raising funding to marketing your product.
The developer cloud
Scale up as you grow — whether you're running one virtual machine or ten thousand.

Start building today
From GPU-powered inference and Kubernetes to managed databases and storage, get everything you need to build, scale, and deploy intelligent applications.
