
Introduction
The charts_flutter library is a “Material Design data visualization library written natively in Dart”. You can use this library in your Flutter application to display data as bar charts, line charts, scatter plot charts, pie charts, and more.
In this article, you will use data for World of Warcraft subscriber numbers between the years of 2008 to 2015 and display it as a bar chart using charts_flutter.
Prerequisites
To complete this tutorial, you will need:
- To download and install Flutter.
- To download and install Android Studio or Visual Studio Code.
- It is recommended to install plugins for your code editor:
This tutorial was verified with Flutter v1.22.2, Android SDK v31.0.2, and Android Studio v4.1.
Step 1 — Setting Up the Project
Once you have your environment set up for Flutter, you can run the following to create a new application:
- flutter create charts_flutter_example
Navigate to the new project directory:
- cd charts_flutter_example
Using flutter create will produce a demo application that will display the number of times a button is clicked.
Step 2 — Adding the charts_flutter Plugin
charts_flutter PluginNext up, we’ll need to add the charts_flutter plugin within our pubspec.yaml:
dependencies:
  flutter:
    sdk: flutter

  charts_flutter: ^0.10.0
We can now go ahead and run this on the iOS or Android simulator or device of your choice.
Step 3 — Scaffolding the Application
Now, open main.dart in your code editor.
Replace everything in this file with with a MaterialApp that points at a HomePage which can be found at home.dart:
import 'package:flutter/material.dart';
import 'package:charts_flutter_example/home.dart';
void main() {
runApp(MyApp());
}
class MyApp extends StatelessWidget {
Widget build(BuildContext context) {
return MaterialApp(
debugShowCheckedModeBanner: false,
home: HomePage(),
);
}
}
Next, create a new home.dart file and add the following lines of code:
import 'package:flutter/material.dart';
class HomePage extends StatelessWidget {
Widget build(BuildContext context) {
return Scaffold(
appBar: AppBar(
backgroundColor: Colors.red,
title: Text("World of Warcraft Subscribers"),
),
body: Center(
child: Text("charts_flutter_example"),
),
);
}
}
Now that we’ve established a base application, we can go ahead and create the model for our bar chart data.
Step 4 — Building the Subscriber Model
Our bar chart will be focused on showing the amount of World of Warcraft subscribers for a particular year.
Next, create a new subscriber_series.dart file and add the following lines of code:
import 'package:flutter/foundation.dart';
import 'package:charts_flutter/flutter.dart' as charts;
class SubscriberSeries {
final String year;
final int subscribers;
final charts.Color barColor;
SubscriberSeries(
{
this.year,
this.subscribers,
this.barColor
}
);
}
This allows us to represent our data of year and subscribers.
Step 5 — Creating the Data
For the sake of this tutorial, the data will be created inside of the HomePage as a List<SubscriberSeries>:
Revisit home.dart and add the following lines of code:
import 'package:flutter/material.dart';
import 'package:charts_flutter/flutter.dart' as charts;
import 'package:charts_flutter_example/subscriber_series.dart';
class HomePage extends StatelessWidget {
final List<SubscriberSeries> data = [
SubscriberSeries(
  year: "2008",
  subscribers: 10000000,
  barColor: charts.ColorUtil.fromDartColor(Colors.blue),
),
SubscriberSeries(
year: "2009",
subscribers: 11000000,
barColor: charts.ColorUtil.fromDartColor(Colors.blue),
),
SubscriberSeries(
year: "2010",
subscribers: 12000000,
barColor: charts.ColorUtil.fromDartColor(Colors.blue),
),
SubscriberSeries(
year: "2011",
subscribers: 10000000,
barColor: charts.ColorUtil.fromDartColor(Colors.blue),
),
SubscriberSeries(
year: "2012",
subscribers: 8500000,
barColor: charts.ColorUtil.fromDartColor(Colors.blue),
),
SubscriberSeries(
year: "2013",
subscribers: 7700000,
barColor: charts.ColorUtil.fromDartColor(Colors.blue),
),
SubscriberSeries(
year: "2014",
subscribers: 7600000,
barColor: charts.ColorUtil.fromDartColor(Colors.blue),
),
SubscriberSeries(
year: "2015",
subscribers: 5500000,
barColor: charts.ColorUtil.fromDartColor(Colors.red),
),
];
Widget build(BuildContext context) {
return Scaffold(
appBar: AppBar(
backgroundColor: Colors.red,
title: Text("World of Warcraft Subscribers"),
),
body: Center(
child: Text("charts_flutter_example"),
),
);
}
}
Now that we’ve got our data, all we need to is create the bar chart!
Step 6 — Creating the Bar Chart
Now, create a new subscriber_chart.dart file and add the following lines of code:
import 'package:flutter/material.dart';
import 'package:charts_flutter/flutter.dart' as charts;
import 'package:charts_flutter_example/subscriber_series.dart';
class SubscriberChart extends StatelessWidget {
final List<SubscriberSeries> data;
SubscriberChart({ this.data});
}
This code creates a new StatelessWidget named SubscriberChart that takes in the SubscriberSeries as a prop.
We can then use this data to build our charts.Series like so:
import 'package:flutter/material.dart';
import 'package:charts_flutter/flutter.dart' as charts;
import 'package:charts_flutter_example/subscriber_series.dart';
class SubscriberChart extends StatelessWidget {
final List<SubscriberSeries> data;
SubscriberChart({ this.data});
Widget build(BuildContext context) {
List<charts.Series<SubscriberSeries, String>> series = [
charts.Series(
id: "Subscribers",
data: data,
domainFn: (SubscriberSeries series, _) => series.year,
measureFn: (SubscriberSeries series, _) => series.subscribers,
colorFn: (SubscriberSeries series, _) => series.barColor
)
];
}
}
The domainFn and measureFn are used to compare the subscribers data for that year.
We’re also using the colorFn to potentially pass a barColor.
Recall how home.dart used barColor:
SubscriberSeries(
year: "2008",
subscribers: 10000000,
barColor: charts.ColorUtil.fromDartColor(Colors.blue),
),
We may want to make the barColor optional with a default of Colors.blue (or a color of your choice) in a production application. In this tutorial, one bar will be colored red and the others will be colored blue.
Let’s update the build function to return our chart:
import 'package:flutter/material.dart';
import 'package:charts_flutter/flutter.dart' as charts;
import 'package:charts_flutter_example/subscriber_series.dart';
class SubscriberChart extends StatelessWidget {
final List<SubscriberSeries> data;
SubscriberChart({ this.data});
Widget build(BuildContext context) {
List<charts.Series<SubscriberSeries, String>> series = [
charts.Series(
id: "Subscribers",
data: data,
domainFn: (SubscriberSeries series, _) => series.year,
measureFn: (SubscriberSeries series, _) => series.subscribers,
colorFn: (SubscriberSeries series, _) => series.barColor
)
];
return Container(
height: 400,
padding: EdgeInsets.all(20),
child: Card(
child: Padding(
padding: const EdgeInsets.all(8.0),
child: Column(
children: <Widget>[
Text(
"World of Warcraft Subscribers by Year",
style: Theme.of(context).textTheme.body2,
),
Expanded(
child: charts.BarChart(series, animate: true),
)
],
),
),
),
);
}
}
This code adds markup to the charts.BarChart by surrounding it with a Card.
The key thing to note is that we’re passing the series as a required parameter to charts.BarChart:
charts.BarChart(series, animate: true)
At this point, your data and chart are ready for use.
Step 7 — Displaying the Chart
Finally, revisit home.dart in your code editor and change the build to use the SubscriberChart:
import 'package:flutter/material.dart';
import 'package:charts_flutter/flutter.dart' as charts;
import 'package:charts_flutter_example/subscriber_series.dart';
import 'package:charts_flutter_example/subscriber_chart.dart';
class HomePage extends StatelessWidget {
// ...
Widget build(BuildContext context) {
return Scaffold(
appBar: AppBar(
backgroundColor: Colors.red,
title: Text("World of Warcraft Subscribers"),
),
body: Center(
child: SubscriberChart(
data: data,
)
),
);
}
}
Save your changes and run the application in a simulator:
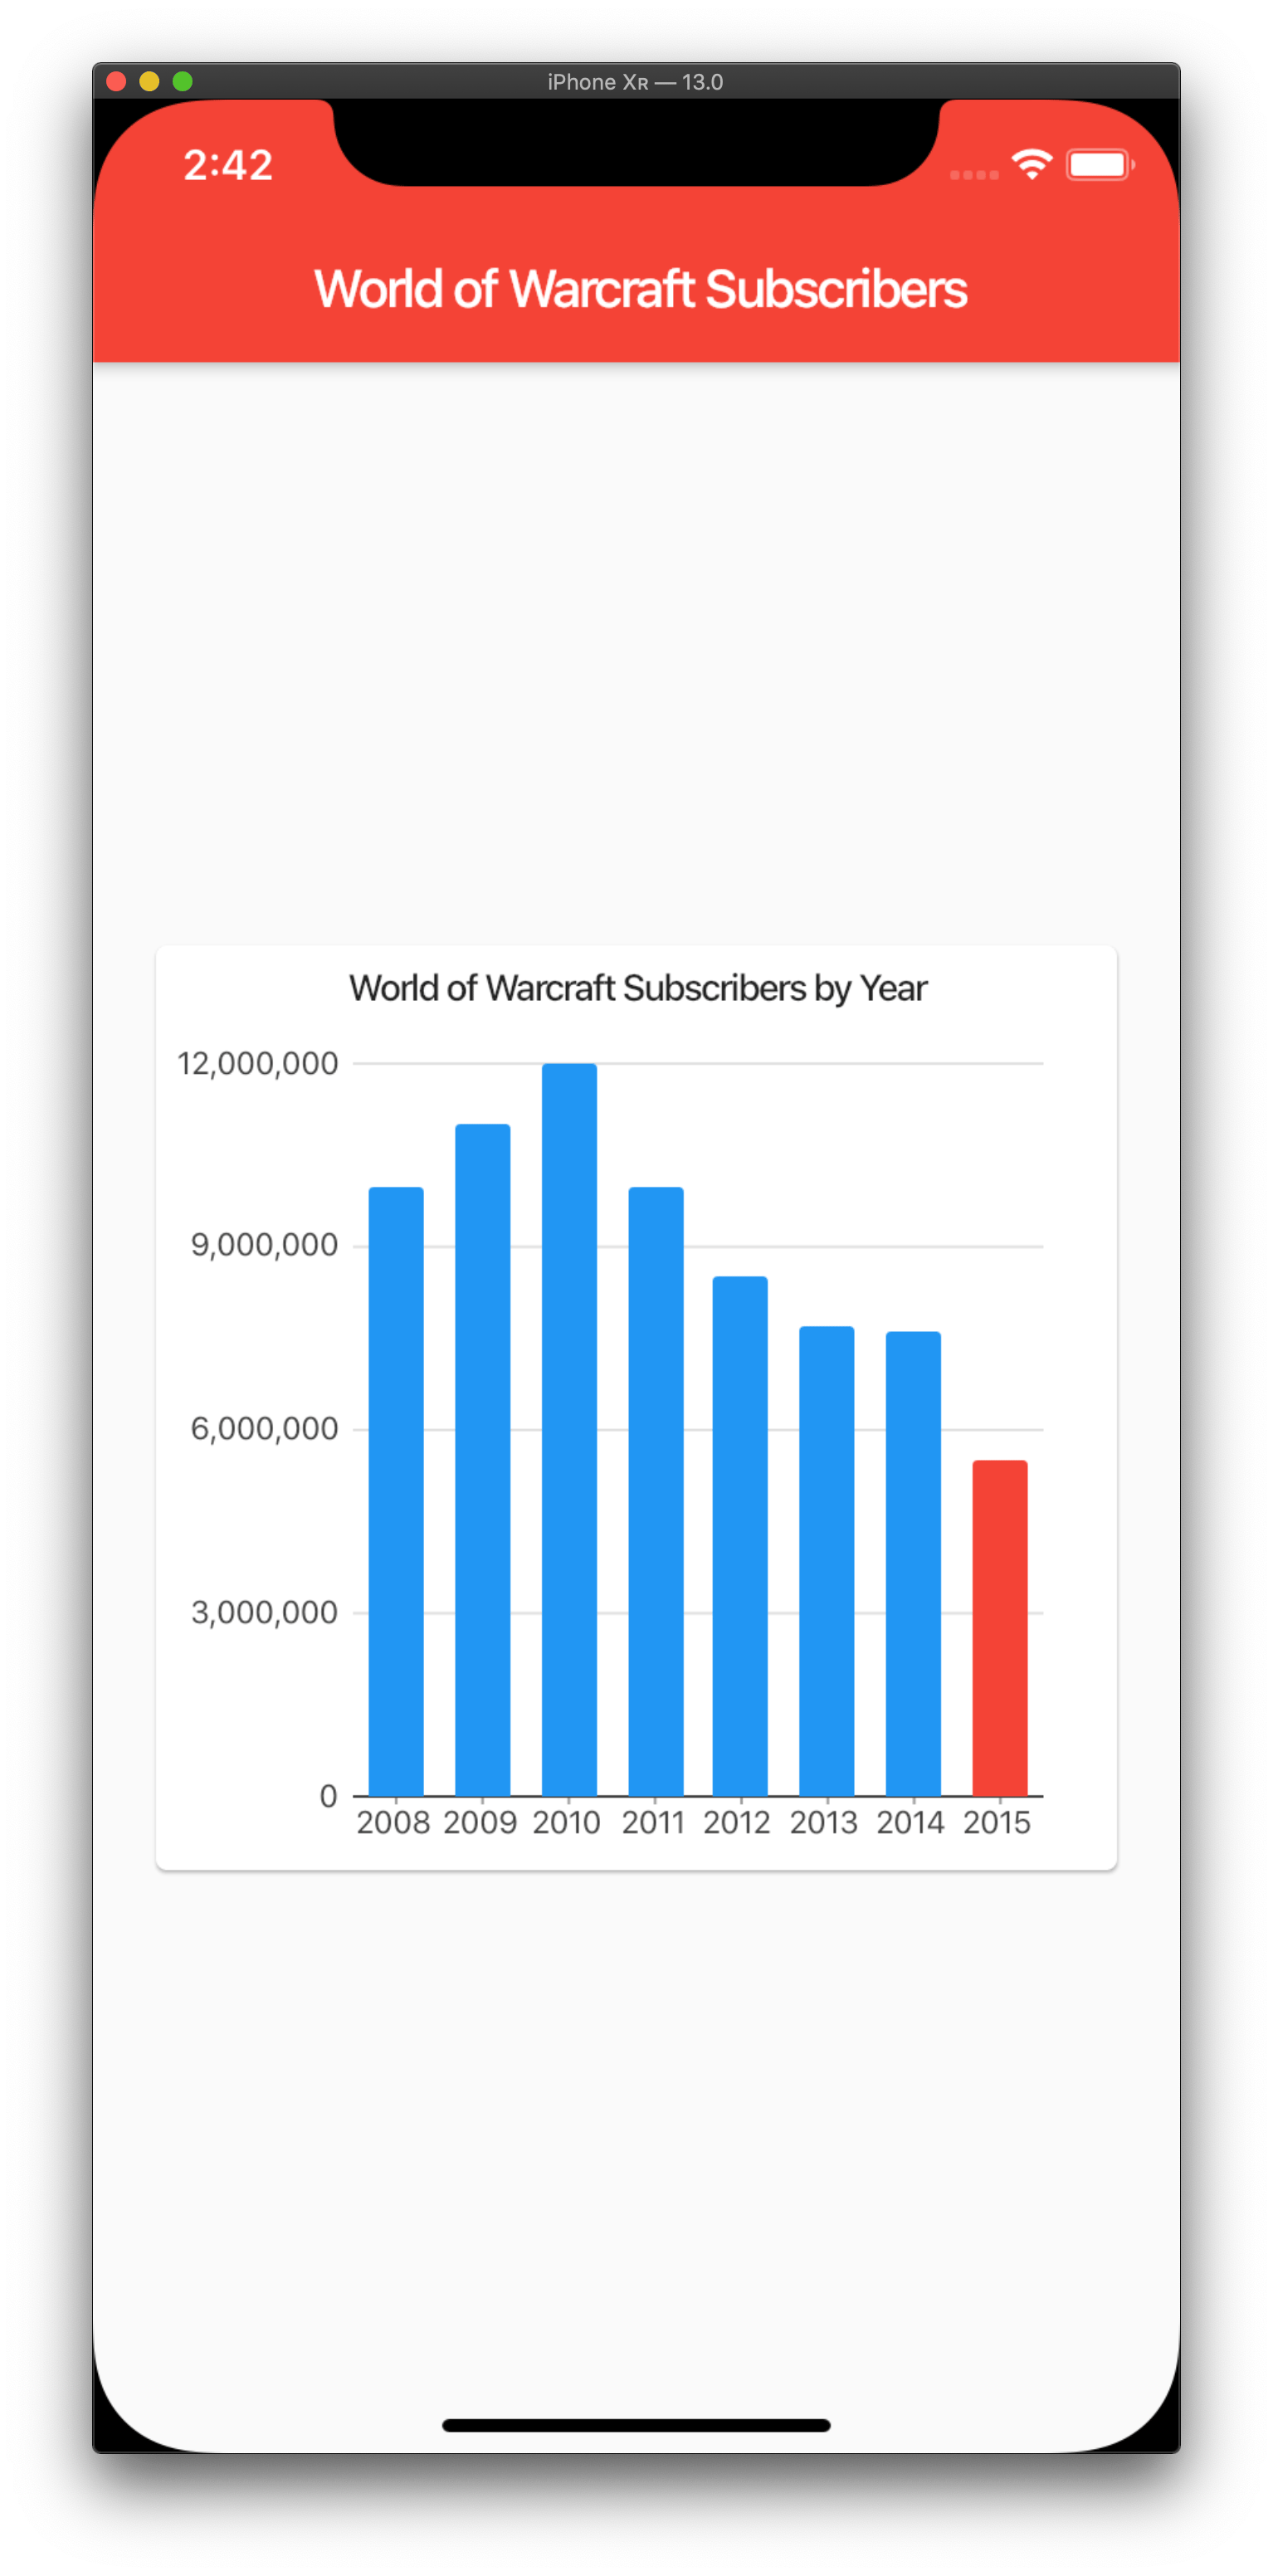
Your application now uses charts_flutter to display data as a bar chart.
Conclusion
In this article, you used data for World of Warcraft subscriber numbers between the years of 2008 to 2015 and displayed it as a bar chart using charts_flutter.
If you’d like to learn more about Flutter, check out our Flutter topic page for exercises and programming projects.
Thanks for learning with the DigitalOcean Community. Check out our offerings for compute, storage, networking, and managed databases.
About the author
I create educational content over at YouTube and https://developer.school.
Still looking for an answer?
This textbox defaults to using Markdown to format your answer.
You can type !ref in this text area to quickly search our full set of tutorials, documentation & marketplace offerings and insert the link!
Hi, how do you fetch data from the database to be the basis of the graph’s contents? Please, I really need help.
 This work is licensed under a Creative Commons Attribution-NonCommercial- ShareAlike 4.0 International License.
Become a contributor for community
Get paid to write technical tutorials and select a tech-focused charity to receive a matching donation.

DigitalOcean Documentation
Full documentation for every DigitalOcean product.

Resources for startups and AI-native businesses
The Wave has everything you need to know about building a business, from raising funding to marketing your product.
The developer cloud
Scale up as you grow — whether you're running one virtual machine or ten thousand.

Start building today
From GPU-powered inference and Kubernetes to managed databases and storage, get everything you need to build, scale, and deploy intelligent applications.
