By Matt Toback and Tammy Fox

An Article from Matt Toback of raintank, the company behind Grafana
Introduction
Grafana is the leading graph and dashboard builder for visualizing time series infrastructure and application metrics, but many use it in other domains including industrial sensors, home automation, weather, and process control. It provides a powerful and elegant way to create, explore, and share dashboards and data with your team and the world.
In this tutorial, you will learn how to add Prometheus as a data source to your Grafana instance and install a pre-configured Prometheus Server Statistics Dashboard.
Prerequisites
To follow this tutorial, you will need:
- Ubuntu 14.04 Droplet
- User with sudo access (see the Initial Server Setup with Ubuntu 14.04 tutorial for details)
- Prometheus and Grafana 2.5+ installed with the instructions from How To Install Prometheus using Docker on Ubuntu 14.04
Step 1 — Adding Prometheus as a Grafana Data Source
In this section, we will configure Grafana to access your Prometheus server as a data source. Each Prometheus server is a separate data source, and if you are configuring more than one Prometheus server, repeat this section for each.
Go to the Grafana main view at http://your_server_ip:3000/, and log into your admin account.
Click the Grafana icon in the top left corner to show the main menu. Select Data Sources to navigate to the data source list page. Click Add New in the top navigation bar. You should see the following:
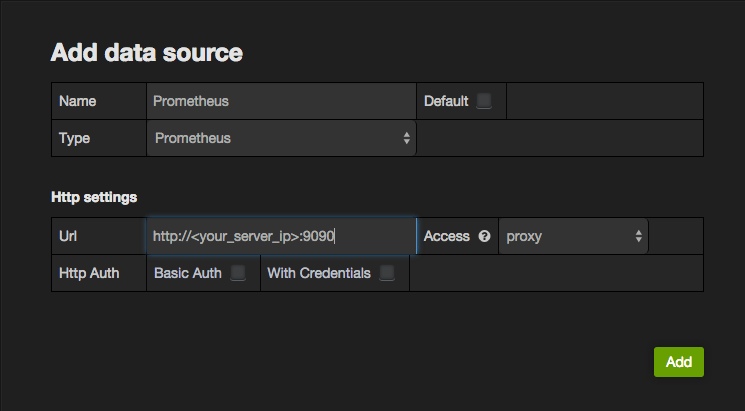
Use the following values to create a new data source:
Name: PrometheusType: PrometheusURL: http://<your_server_ip>:9090, (default port is 9090)Access: proxyBasic Auth: Enabled or Disabled, as your Prometheus server is configured.
Click Add to add your data source, and then click Test Connection to verify everything is working properly. If successful, move on to the next step to import your dashboard.
Step 2 — Importing the Prometheus Stats Dashboard
This section will download an official, pre-built Prometheus Stats Dashboard and instruct you on how to import it into Grafana.
Download the latest Prometheus Dashboard one of two ways:
- Right click and save the following link: Prometheus Stats - Default Grafana Dashboard
- Navigate your browser directly to the dashboard JSON file:
http://grafana.org/assets/dashboards/prometheus-dash.json
The import view can be found at the Dashboard Picker dropdown, next to the New Dashboard and Playlist buttons.
To import a dashboard from a local JSON file, click the Choose file button in the Import File section. Find the downloaded prometheus-dash.json on your local file system, and import it.
Note: If you have named your data source something other than Prometheus, you will need to do a find and replace the data source name in the .json file. Open it with:
- nano prometheus-dash.json
Find the following, and change the data source filename from Prometheus to whatever you named it:
"datasource": "Prometheus",
After importing the Prometheus Dashboard, you will immediately be taken to the Prometheus Stats Dashboard, and if everything is properly configured, you will start to see statistics from your Prometheus server.
Important: Click the Save button in the top menu to save your dashboard within your Grafana instance. If you do not save your dashboard, it will not appear in your Grafana after you close your browser.
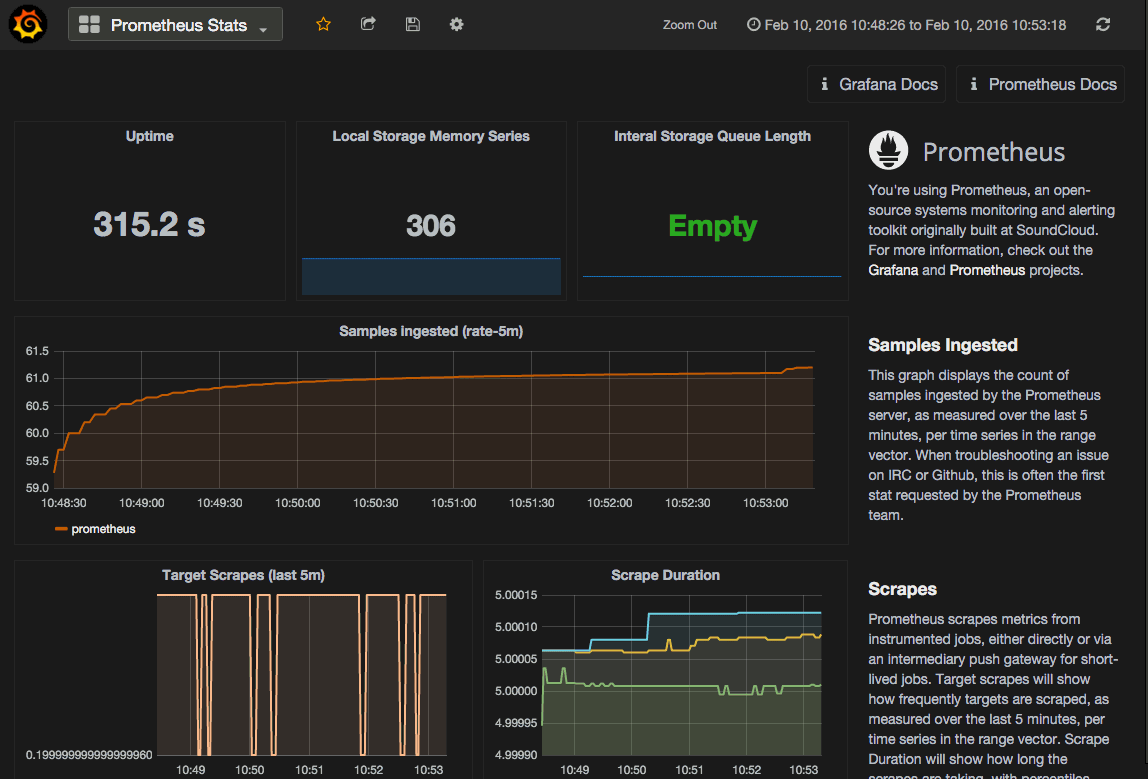
Step 3 — Viewing the Prometheus Stats Dashboard
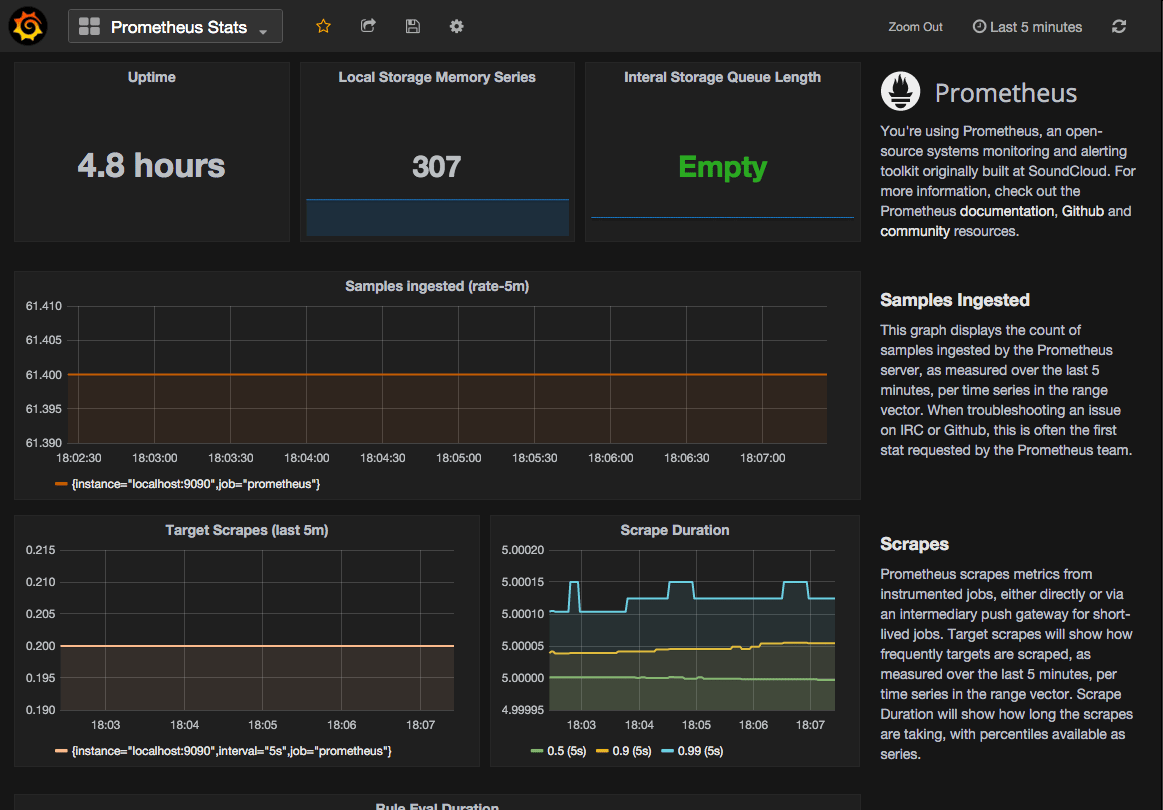
Upon a successful import, you will immediately be taken to your new, unsaved dashboard. This dashboard was built with the help of the Prometheus team, highlighting on the basic metrics commonly used to troubleshoot your Prometheus server.
The individual panels and reported metrics are as follows:
Single Stat Graphs
-
Uptime: This single stat graph is the uptime, or the time since the Prometheus server was brought online. At a glance, this stat is useful to know if your server has recently restarted.
-
Local Storage Memory Series: This panel displays the current number of series held in memory, as of the
Fromvalue specified on the dashboard time range. By default, this isnow. -
Internal Storage Queue Length: Ideally, this queue length should be Empty (0) or a low number.
-
Sample Ingested: This graph displays the count of samples ingested by the Prometheus server, as measured over the last 5 minutes, per time series in the range vector. When troubleshooting an issue on IRC or Github, this is often the first stat requested by the Prometheus team. This number should align with the number of metrics you believe you are ingesting.
The Samples Ingested query is as follows:
rate(prometheus_local_storage_ingested_samples_total[5m])
Scrapes
Prometheus scrapes metrics from instrumented jobs, either directly or via an intermediary push gateway for short-lived jobs. The Target Scrapes graph will show how frequently targets are scraped as measured over the last 5 minutes, per time series in the range vector. The Scrape Duration graph will show how long the scrapes are taking with percentiles available as series. The scrape duration shows the 50th percentile (0.5), 90th percentile (0.9). and 99th percentile (0.99) as three separate series to help identify outliers that may be skewing the data.
The Target Scrapes query is as follows:
rate(prometheus_target_interval_length_seconds_count[5m])
The Scrape Duration query is as follows:
prometheus_target_interval_length_seconds{quantile!="0.01", quantile!="0.05"}
Rule Eval Duration
This graph panel plots the duration for all evaluations to execute. The 50th percentile (0.5), 90th percentile (0.9), and 99th percentile (0.99) are shown as three separate series to help identify outliers that may be skewing the data.
Step 4 — Analyzing the Data from the Prometheus Dashboard
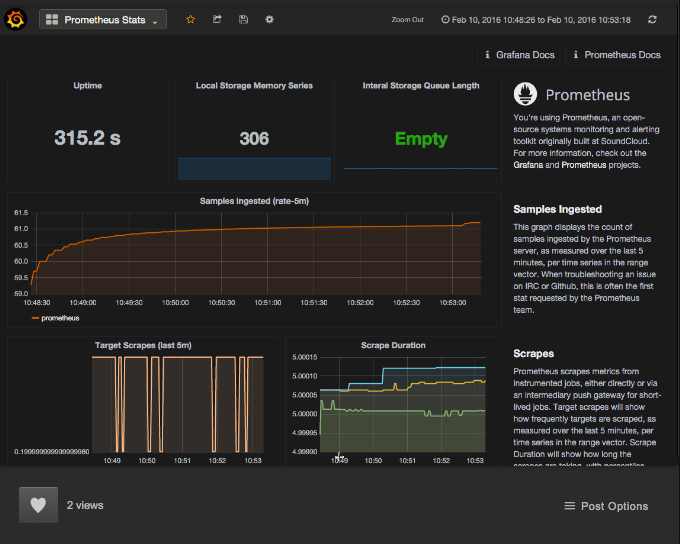
For a newly running Prometheus server, your graphs should appear pretty flat and small.
Long term, these graphs will vary greatly depending on your particular use case and workloads. In general, you want all of these graphs to remain stable. If more targets are being scraped and/or they start exporting more metrics, the number of ingested samples, memory series, and target scrapes per second will increase — that is to be expected.
If your target scrapes drop unexpectedly or the scrape latency goes up, you should determine the cause. For example, a client can start exporting 1 million metrics instead of the usual 10 thousand metrics or someone can export a time series with a different label for each user. Both of these would cause an increase in scrape latency. So, when a graph suddenly goes up, you should investigate whether an application was just scaled up significantly or whether it might be instrumented badly.
Slow rule evaluation is also a good indicator that the node on which the Prometheus server runs is simply not sufficient to handle the load.
Step 5 — Customizing Graphs and Metrics
You now have a Prometheus Dashboard added to your Grafana instance with a set of pre-configured Prometheus server statistics.
Grafana gives you the power to visualize any metric available on your Prometheus server — all accessible within a specialized Prometheus Query Editor. To access the query editor on any panel, click the panel title area to show the panel menu. Click Edit. The Metrics tab will be pre-selected for you, and provide direct access to the query and available options for the Prometheus data source.
As changes are made in the query editor, the graph will instantly update to show your edits.
Conclusion
For a full list of available metrics, you can navigate to http://`<your_server_ip>:9090`/metrics (port 9090 is the default).
Any of these metrics can be copy and pasted into the Grafana query editor, and until you save your dashboard, none of your edits will overwrite the existing dashboard.
So experiment, have fun, and start visualizing!
Thanks for learning with the DigitalOcean Community. Check out our offerings for compute, storage, networking, and managed databases.
About the author(s)
Technical Editor, DigitalOcean
Still looking for an answer?
This textbox defaults to using Markdown to format your answer.
You can type !ref in this text area to quickly search our full set of tutorials, documentation & marketplace offerings and insert the link!
@mattttt, thanks for sharing. I wonder if I can use the DO agent monitoring as a source and if you can provide some instructions on that? Also, can a SQL database be monitored, displaying certain queries in Grafana?
Great article, but it needs an update, e.g. the URL to the JSON-file for the Prometheus-dashboard has gone missing and makes the whole unusable.
I was wondering about federation… Mostly across multiple servers, I want to create a number of different Dashboards, the real question is, do I need Prometheus on each and every machine? Or do I simple just need node_exporter.
 This work is licensed under a Creative Commons Attribution-NonCommercial- ShareAlike 4.0 International License.
Become a contributor for community
Get paid to write technical tutorials and select a tech-focused charity to receive a matching donation.

DigitalOcean Documentation
Full documentation for every DigitalOcean product.

Resources for startups and AI-native businesses
The Wave has everything you need to know about building a business, from raising funding to marketing your product.
The developer cloud
Scale up as you grow — whether you're running one virtual machine or ten thousand.

Start building today
From GPU-powered inference and Kubernetes to managed databases and storage, get everything you need to build, scale, and deploy intelligent applications.
