By tcollins and Hazel Virdó

Introduction
InfluxDB is a time series, metrics, and analytics database. Time series databases are designed to address the problem of storing data resulting from successive measurements made over a period of time. This data may consist of items such as system metrics (like CPU and memory usage) and application metrics (like application errors and REST endpoint calls).
The longer a system operates, the greater the amount of data accumulated. InfluxDB provides a solution for efficiently storing this data. It is targeted at use cases for DevOps, metrics, sensor data, and real-time monitoring and analytics. Using InfluxDB, you can quickly build a powerful real time monitoring framework which also provides historical analysis.
In this guide, we will cover:
- How to install and configure InfluxDB on CentOS 7.
- How to feed system monitoring data from the collectd system statistics daemon to InfluxDB.
- How to use the InfluxDB SQL-like query language to quickly understand and analyze the performance of the monitored system.
- How to use the Grafana visualization tool stack to create a rich dashboard solution to better explore and present the data stored in our InfluxDB instance.
Prerequisites
Before you start, you’ll need the following:
-
One 64-bit CentOS 7 Droplet. The amount of CPU, RAM, and storage that your server will require depends on the volume of data that you intend to gather, but 2GB RAM and 2 CPUs is typically sufficient to start with.
-
A sudo non-root user. The CentOS 7 Initial Server Setup tutorial explains how to do this.
-
4 GB of swap space. The How To Add Swap on Centos 7 tutorial explains how to do this.
Step 1 — Installing InfluxDB
In this step, we will install InfluxDB.
InfluxDB is distributed as a self contained system. This means that it has no external dependencies; everything you need to run the database is provided in the release package you use during installation, which makes installation easy.
First, update your system to ensure you have the latest bug and security fixes.
- sudo yum -y update
Next, install the latest version of InfluxDB, which is v0.8.8 at the time of writing.
- sudo yum -y install https://s3.amazonaws.com/influxdb/influxdb-latest-1.x86_64.rpm
After the package has successfully been installed, a number of files will be installed in /opt/influxdb/versions/0.8.8, and a symbolic link will be created in /etc/init.d for the InfluxDB service management script.
Step 2 — Configuring and Starting InfluxDB
In this step, we will customize the InfluxDB configuration to disable anonymous data reporting and extend the default read-timeout limit.
InfluxDB’s main configuration file is /opt/influxdb/shared/config.toml. This uses the TOML format, which looks very similar to INI configuration formats and is designed to be easy to read because of its obvious semantics.
Before we customize our configuration, make a backup of the original.
- sudo cp /opt/influxdb/shared/config.toml /opt/influxdb/shared/config.toml_backup
As of version 0.7.1, InfluxDB reports anonymous data once every 24 hours to m.influxdb.com. To minimize our bandwidth usage, we will disable this reporting. First, open the configuration file for editing using nano or your favorite text editor.
- sudo nano /opt/influxdb/shared/config.toml
Find the configuration key reporting-disabled and change it to true. After editing, that section should look like this:
. . .
# Change this option to true to disable reporting.
reporting-disabled = true

[logging]
. . .
Next, we will update the default read-timeout to permit a slightly longer lead time for connections. The read-timeout controls how long connections to the database will be permitted to wait before they are closed.
In the same configuration file, find the configuration key read-timeout and change it from 5s to 10s.
. . .
# However, if a request is taking longer than this to complete, could be a problem.
read-timeout = "10s"

[input_plugins]
. . .
Save and close the file, then start the InfluxDB daemon.
- sudo /etc/init.d/influxdb start
On a successful start, the service manager script will provide the following output.
Setting ulimit -n 65536
Starting the process influxdb [ OK ]
influxdb process was started [ OK ]
After InfluxDB has started navigate to http://your_server_ip:8083 in a web browser to verify that InfluxDB is up and running. This will show you the default administration UI, which will have two sections labeled Connect and Hostname and Port Settings.
Step 3 — Changing the Default InfluxDB Admin Credentials
Every InfluxDB ships with a default set of admin credentials. For security, you should change this password.
Log into the InfluxDB UI using the default username root and password root in the Connect section. Leave the database blank, and click the blue Connect button.
In the top menu on the next page, click on Cluster Admins. This will take you to the user administration page. Under the Username section, click on root and change the password by filling in your new password twice and clicking the blue Change Password button.
Finally, log out using the blue Disconnect button, and log back in using your new password.
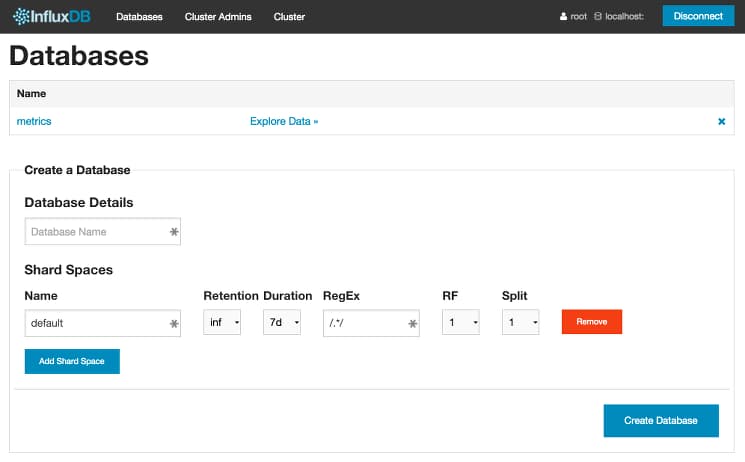
Step 4 — Creating a Database
When InfluxDB is first set up, it does not contain any actual databases, so we need to create a database which we will ultimately use to store our metrics.
Click on the Databases menu from the top menu in the web UI. In the Create a Database section, under Database Details, enter metrics as the database name. The default options in Shard Spaces options can be kept. Next click on the blue Create Database button in the bottom right to create your database.
After the database has been successfully created, you will see it listed at the top of the screen next to an Explore Data link.
To verify that the database we created is working correctly, we can write and check some sample data to it using the data UI. Click on the Explore Data link to reach the data UI. You will see this screen:
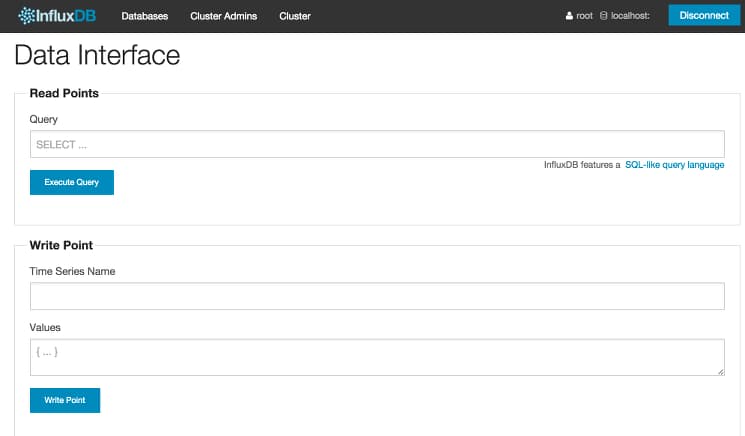
From this screen, you can write some test data to the database. You will also be able to issue ad-hoc queries against the data stored in the database and see basic visualizations. Let’s write a little data to verify that our database is functional.
To enter data using the web UI you need to provide a series name and values for the series. The series name is an alphanumeric string without spaces, and the value field should be supplied in a JSON key-value format.
In the Write Point section, for Time Series Name enter test_metric, and for Values, enter {"value": 23.4}. Then, click the blue Write Point button to enter the data. You’ll see 200 OK pop up in green next to the button.
Repeat the process with the same time series name and each of the following values: {"value": 13.1}, {"value": 13.1}, {"value": 78.1}, and {"value": 90.4}. Note that we are intentionally writing the value 13.1 twice. You will add a total of five points.
Now that we have written some example data points, we can inspect them. In the Read Points section at the top of the page, in the Query box, enter the following query:
select * from test_metric
Then press the blue Execute Query button. The result of this query will display all data points stored in the database for the test_metric series. You’ll then see a graph which will look something like this:
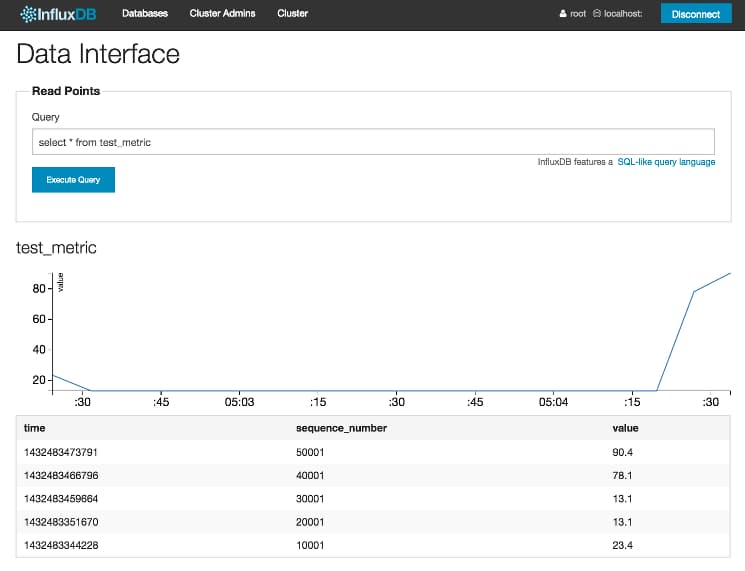
This screen shows a line graph which summaries the trend of the metric over the time series and a data table which summarizes the data as stored in the database.
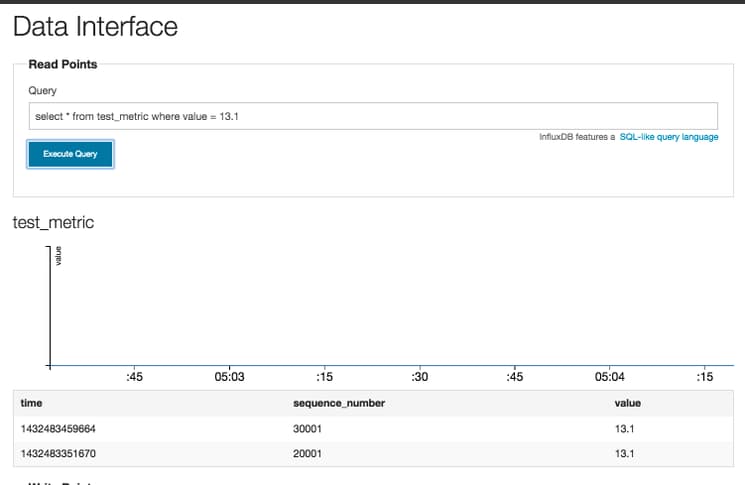
We can also use the column identifiers to narrow the scope of our search. For example, to find events where the event value was 13.1, enter the following search query:
select * from test_metric where value = 13.1
This will result in two rows being returned for our example data:
To give a little more detail, data in InfluxDB is organized by time series, which is test_metric in our example. Each series has a set of data points corresponding to an event. We created five events above when we entered our data. Each event has a time, a sequence number, and some columns which are analogous to the metric we are measuring for an event. In our example we have a single metric called value in each of our five events.
Step 5 — Installing and Configuring collectd
In this step, we will set up and configure collectd to collect metrics for our system. collectd is a Unix daemon that collects, transfers, and stores performance data. It’s helpful in maintaining an overview of available resources to detect existing or looming bottlenecks.
First, enable the EPEL (Extra Packages for Enterprise Linux) repository:
- sudo yum -y install http://dl.fedoraproject.org/pub/epel/7/x86_64/e/epel-release-7-5.noarch.rpm
Then install collectd.
- sudo yum -y install collectd
After the package has successfully been installed, a number of binaries, shared libraries, and configuration files will be created. The main files to be aware of are the collectd configuration file, /etc/collectd.conf, and the primary collectd daemon binary, /usr/sbin/collectd. Like before with InfluxDB, let’s first make a copy of the original configuration file.
- sudo cp /etc/collectd.conf /etc/collectd.conf_backup
Next open the configuration file for editing.
- sudo nano /etc/collectd.conf
The main collectd configuration file contains many settings, the majority of which are not active by default because they are commented out. We will uncomment and modify some of them.
At the top of the file configuration, in the Global section, you will see the following. The parts you will edit are highlighted in red.
. . .
#Hostname    "localhost"
#FQDNLookup   true
#BaseDir     "/var/lib/collectd"
#PIDFile     "/var/run/collectd.pid"
#PluginDir   "/usr/lib64/collectd"
#TypesDB     "/usr/share/collectd/types.db"
. . .
Uncomment the Hostname, BaseDir, PIDFile, PluginDir, and TypesDB fields by deleting the # at the beginning of the line. Additionally, set the Hostname field to influxdb. When completed, this section of the file should look like this:
Hostname    "influxdb"
#FQDNLookup   true
BaseDir     "/var/lib/collectd"
PIDFile     "/var/run/collectd.pid"
PluginDir   "/usr/lib64/collectd"
TypesDB     "/usr/share/collectd/types.db"
Next, scroll down to the LoadPlugin section, which lists a large number of plugins in alphabetical order. Scroll through them and uncomment the LoadPlugin network and LoadPlugin uptime lines by deleting the # at the beginning of the line.
Finaly, we will configure collectd to send data directly to InfluxDB.
Scroll down to the Plugin Configuration section. After the section separator (shown below), add the network plugin configuration (highlighted in red).
. . .
##############################################################################
# Plugin configuration                                                       #
#----------------------------------------------------------------------------#
# In this section configuration stubs for each plugin are provided. A desc-  #
# ription of those options is available in the collectd.conf(5) manual page. #
##############################################################################

 <Plugin network>
  Server "127.0.0.1" "8096"
 </Plugin>

#<Plugin "aggregation">
. . .
Now save and exit the file. We should check the configuration to ensure we have not inadvertently introduced any typos or syntax errors. We can use collectd to test the configuration as follows:
- sudo /usr/sbin/collectd -t
If the collectd configuration has no errors, this command will return with no output. If there are any errors found in the file, they will be listed in the terminal.
Once the configuration is error-free, restart collectd to activate the new configuration. This may take a moment.
- sudo service collectd start
Step 6 — Configure InfluxDB to Consume collectd Metrics
To store the collectd system metrics being gathered by collectd in InfluxDB, we need to enable and configure the InfluxDB collectd input plugin.
First, open the InfluxDB configuration file for editing.
- sudo nano /opt/influxdb/shared/config.toml
Locate the the input_plugins.collectd plugin configuration, which will look like this. The lines you will modify are highlighted in red.
. . .
  # Configure the collectd api
  [input_plugins.collectd]
  enabled = false
  # address = "0.0.0.0" # If not set, is actually set to bind-address.
  # port = 25826
  # database = ""
  # types.db can be found in a collectd installation or on github:
  # https://github.com/collectd/collectd/blob/master/src/types.db
  # typesdb = "/usr/share/collectd/types.db" # The path to the collectd types.db file
. . .
Modify it to match the excerpt below by making the following changes:
- Set enabled to true.
- Change the port to 8096.
- Change the database to metrics.
- Uncomment the port, database, and typesdb lines.
. . .
[label /opt/influxdb/shared/config.toml modified excerpt]
  # Configure the collectd api
  [input_plugins.collectd]
  enabled = true
  # address = "0.0.0.0" # If not set, is actually set to bind-address.
  port = 8096
  database = "metrics"
  # types.db can be found in a collectd installation or on github:
  # https://github.com/collectd/collectd/blob/master/src/types.db
  typesdb = "/usr/share/collectd/types.db" # The path to the collectd types.db file
. . .
Save the file and restart InfluxDB to activate the new configuration.
- sudo /etc/init.d/influxdb restart
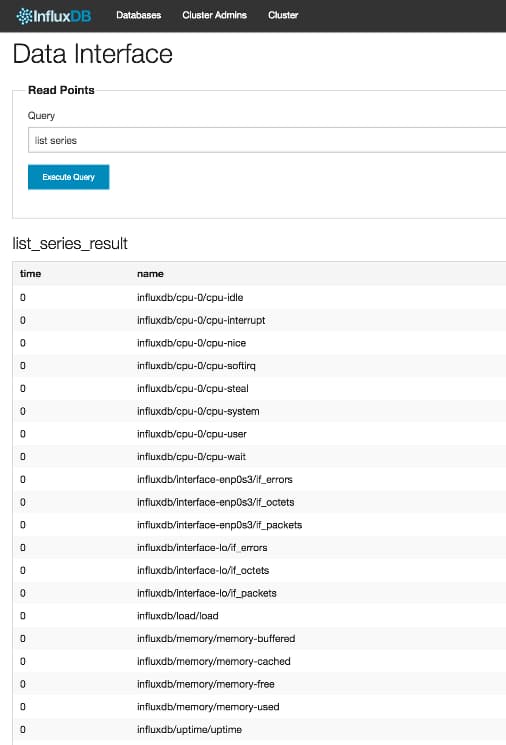
Next, let’s check that InfluxDB is receiving system metrics from collectd. In the Data Interface in the UI, where we left off in Step 5, enter the following query in the Query text box under Read Points, then press the blue Execute Query button.
list series
If you are receiving data from collectd, you should observe a long list of series similar to the below:
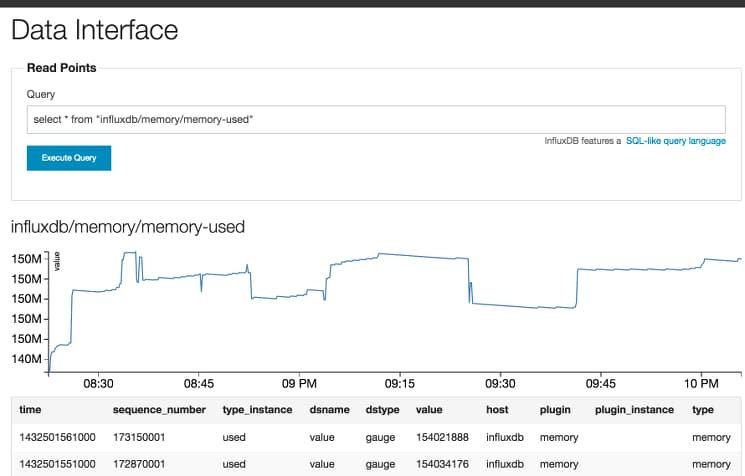
We can now start to analyze the performance of our system by exploring this data like in step 5. For example, issuing the following query will allow you observe memory usage in your system:
select * from "influxdb/memory/memory-used"
The resultant data display clearly shows the variations in memory usage that have been recorded to our InfluxDB instance. Here’s an example:
Step 7 — Installing and Starting Grafana
We can use InfluxDB’s web interface to explore the data and visualize system trends from the time series data. However, the web UI is somewhat rudimentary and not ideal for presenting the metrics data we are collecting.
Grafana is a feature rich metrics dashboard which integrates well with InfluxDB. Grafana will give us the capacity to create dashboards which provide system overviews and are suitable for sharing or using as wall displays.
To install Grafana, enter the following command.
- sudo yum -y install https://grafanarel.s3.amazonaws.com/builds/grafana-2.0.2-1.x86_64.rpm
Start the Grafana stack by first reloading systemd’s daemons.
- sudo systemctl daemon-reload
Then start the Grafana server.
- sudo systemctl start grafana-server
Finally, check its status.
- sudo systemctl status grafana-server
On a successful start, the service manager status will confirm that the Grafana service has started and that the web UI is being served. The output you receive in your terminal will begin with this:
grafana-server.service - Starts and stops a single grafana instance on this system
   Loaded: loaded (/usr/lib/systemd/system/grafana-server.service; disabled)
   Active: active (running) since Tue 2015-06-02 18:59:17 EDT; 3s ago
. . .
Step 8 — Changing the Default Grafana Admin Credentials
Every Grafana instance ships with a default set of admin credentials. For security, you should change this password. You can use the web UI or the Grafana configuration file to do so, but due to ease of use, we will use the web UI.
After Grafana has started, navigate to http://your_server_ip:3000. Log into the Grafana UI using the default username admin and password admin. Click on the Graphana logo in the top left corner of the screen, then click admin in the menu that appears. This will bring you to the following profile administration page.
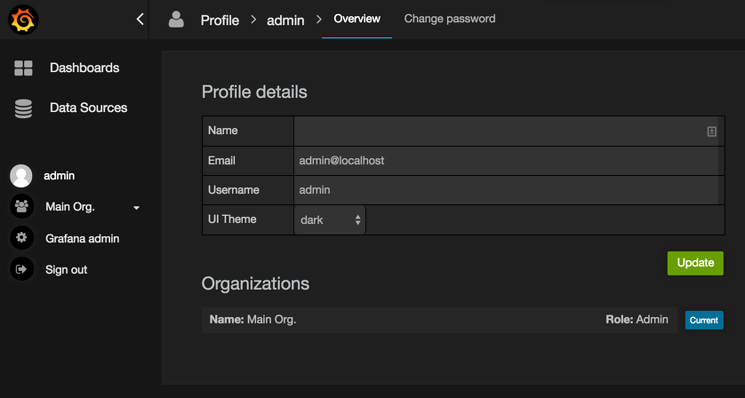
Click on the Change Password link in the top header menu. Fill in your new password in the appropriate fields, then click Change Password.
Step 9 — Adding the InfluxDB Database to Grafana
In this step, we will add our InfluxDB database as a source in Grafana.
To add the data source, open the side menu by clicking the the Grafana icon in the top header. In the side menu, click Data Sources. Click on the Add New link in the top header to bring up the data source definition screen.
Populate this screen using the following settings:
- Name: influxdb
- Type: Choose InfluxDB 0.8.x from the pull-down menu.
- Default: Make sure this checkbox is checked. The default data source means that it will be pre-selected for new panels.
- Url:
http://localhost:8086 - Access: Choose proxy from the pulldown menu.
- Basic Auth: Leave this checkbox unselected.
- Database: metrics
- User: root
- Password: The root InfluxDB database password you chose in step 4.
Finally, click the green Add button at the bottom of the screen.
Step 10 — Creating Grafana Dashboards
Grafana provides a powerful yet user friendly means of creating informative charts and dashboards. In this step, we will create a system overview dashboard to display trends for the system metrics we are collecting in InfluxDB.
In Grafana, a dashboard is the basic pallet you work from. Dashboards contain display elements (such as graphs and text panes). Display elements contain queries which are used to source the data from your data source (which, in our case, is InfluxDB). Therefore, we first need to create an empty dashboard which will serve as the foundation for our display.
Navigate to the Grafana home page, http://your_server_ip:3000. Click on the Home link in the top header to bring up the dashboard listing screen. At the bottom of the this screen, click on + New. This will bring you to your new, blank dashboard.
Click on the gear in the header menu of your dashboard, and then click on Settings. You will be presented with the following screen:
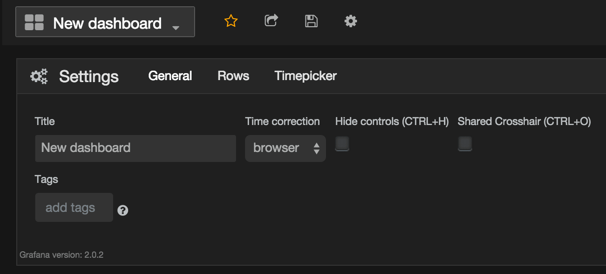
This screen is used to change the main settings for your dashboard. Change the Title field from New dashboard to System Overview. Next, click on the floppy disk icon in the top header to save your dashboard.
We will now populate the dashboard with display elements to create a visual system overview information radiator.
From your dashboard, click on the row controls menu, which is the small green rectangle located to the top left of your dashboard. In this menu, hover over Add Panel and then click on Graph. This will create a blank graph on your dashboard.
Click on the chart title at the top of the chart, which reads no title (click here), and next click on edit from the resultant menu. This will bring you to the chart administration menu. Click on the General tab and change the Title field to Network.
Next, click on the Metrics tab to bring you to the query builder. In the series field, we can specify the metrics we wish to use as the source of our data for the graph. Start to type interface; you will then be presented with an autocomplete selection. Select the influxdb/interface-eth0/if_errors metric.
Next, click on + Add query at the bottom of the chart administration menu. This will add a second query row to the query builder. Use the same method as before to add a query for the influxdb/interface-eth0/if_octets metric, and again for the influxdb/interface-eth0/if_packets metric.
After adding the three queries your metrics screen should look something like this:
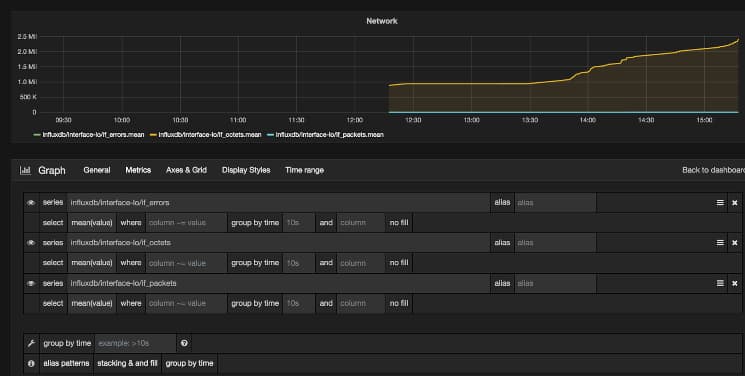
Finally, click on the Back to Dashboard link to bring you to your dashboard, which now contains a graph displaying the network trends for your system, and click on the on the floppy disk icon in the top header to save your new display graph and dashboard.
The above process can be repeated to create visual graphs to display any data being stored to the InfluxDB series.
Conclusion
InfluxDB is a powerful tool for storing and analyzing time series data, like data generated when monitoring the performance of a running system. Combining InfluxDB with Grafana provides a solution for efficiently storing and visualizing such data.
After completing this tutorial, you should have a general understanding of InfluxDB: how to install it, how to configure the database for usage, and how to send data to it. In addition, you can set up Grafana and using it to build a general purpose system monitoring dashboard.
InfluxDB and Grafana have many further features and use cases. You can perform more in-depth analysis on the behavior of your systems using the aggregate functions provided by InfluxDB. You may also wish to start collecting data from distributed systems so as to compare performance across a number of systems, or start collecting and analyzing other, non-system level metric types (e.g. the number of page visits per user or the number of API calls for a REST endpoint). InfluxDB is very well-suited to such data and there are a number of tools and libraries listed in the official InfluxDB documentation.
Thanks for learning with the DigitalOcean Community. Check out our offerings for compute, storage, networking, and managed databases.
About the author(s)
former DO tech editor publishing articles here with the community, then founded the DO product docs team (https://do.co/docs). to all of my authors: you are incredible. working with you was a gift. love is what makes us great.
Still looking for an answer?
This textbox defaults to using Markdown to format your answer.
You can type !ref in this text area to quickly search our full set of tutorials, documentation & marketplace offerings and insert the link!
Hi it seems my collectd do not get the information when i luanch it i have this message :
nov. 09 11:23:22 server systemd[1]: Starting Collectd statistics daemon… nov. 09 11:23:22 server systemd[1]: Started Collectd statistics daemon. nov. 09 11:23:22 server collectd[35345]: Initialization complete, entering read-loop.
Could you help me ?
I missed the “LoadPlugin network” line and went crazy investigating iptables and influxdb options… Go me.
Really nice article!
I think this is an error:
Find the configuration key reporting-disabled and change it to true. After editing, that section should look like this:

/opt/influxdb/shared/config.toml excerpt
. . .

# Change this option to true to disable reporting.
reporting-disabled = false

[logging]
reporting-disabled should be true in this snippet.
Hi,
I am trying to deploy in centos 7.x.
First of all
sudo yum -y install https://s3.amazonaws.com/influxdb/influxdb-latest-1.x86_64.rpm
is not able to fetch and install the package.
So in stalled… yum install https://repos.influxdata.com/rhel/7/x86_64/stable/influxdb-1.4.2.x86_64.rpm
Later I am not able to find
/opt/influxdb/shared/config.toml.
Any help on this please ?
 This work is licensed under a Creative Commons Attribution-NonCommercial- ShareAlike 4.0 International License.
Become a contributor for community
Get paid to write technical tutorials and select a tech-focused charity to receive a matching donation.

DigitalOcean Documentation
Full documentation for every DigitalOcean product.

Resources for startups and AI-native businesses
The Wave has everything you need to know about building a business, from raising funding to marketing your product.
The developer cloud
Scale up as you grow — whether you're running one virtual machine or ten thousand.

Start building today
From GPU-powered inference and Kubernetes to managed databases and storage, get everything you need to build, scale, and deploy intelligent applications.
