By James Quick

Warning: Since publication, the Debugger for Chrome extension in this tutorial has been deprecated.
Introduction
In this tutorial, you will create an Angular application with Angular CLI and then add configuration to debug it in Visual Studio Code (VS Code).
Prerequisites
- Download and install the latest version of Google Chrome.
- Download and install the latest version of Visual Studio Code.
- Node.js installed locally, which you can do by following How to Install Node.js and Create a Local Development Environment.
- Angular CLI installed.
Step 1 — Setting Up the Project
To be able to test an Angular application, you need an Angular application.
- ng new angular-cli-debug-app
This creates the angular-cli-debug-app directory and installs the Angular dependencies.
In your Terminal, navigate to the project directory:
- cd angular-cli-debug-app
And execute the following command to run your application and make sure everything works:
- ng serve --open
You will be presented with a web browser window with the message:
Outputangular-cli-debug-app app is running!
At this point, you have a new Angular project.
Step 2 — Creating Your Debug Configuration
To debug your application, you’ll create a debug configuration. Debug configurations are saved in a launch.json file which is stored inside of a .vscode folder, which is where you’ll find all of the configuration files for Visual Studio Code
Before you create your debug configuration, you need to install the Debugger for Chrome extension. Find and install this extension from the Extensions tab in Visual Studio Code.
Now, to create a debug configuration, you can open the debug panel. It looks like a “bug” and it’s located on the left panel of the user interface.

Next, you can click the link mentioned in the ‘To customize Run and Debug create a launch.json file’ message in the pane. Or you can navigate through the menu to Run > Add Configuration….
Then, select Chrome as your environment.
VS Code automatically generates the .vscode folder and launch.json file for your project.
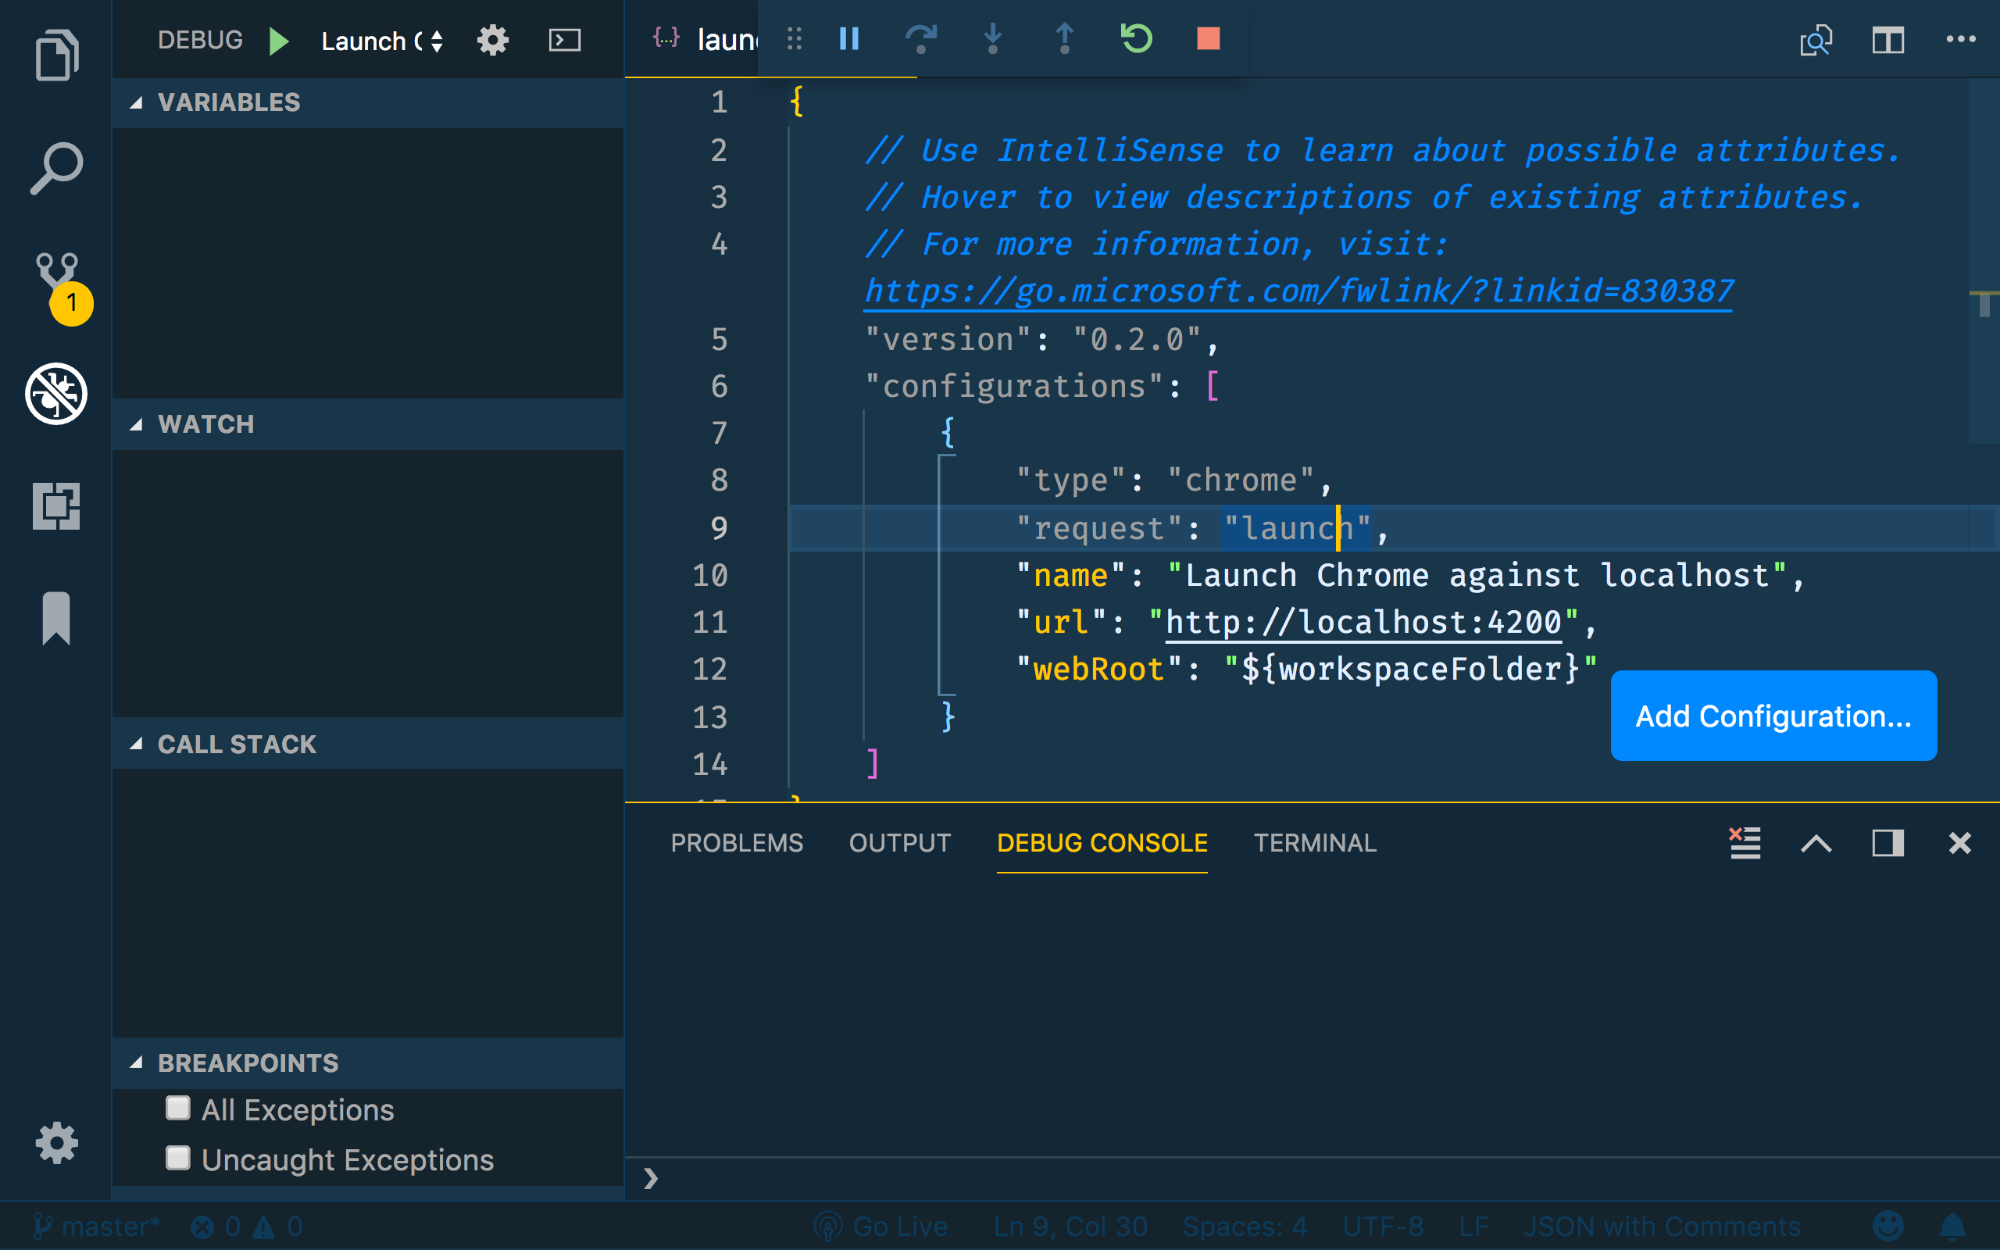
In the configuration provided, update the port from 8080 to 4200.
Your updated launch.json file will resemble:
{
  "version": "0.2.0",
  "configurations": [
    {
      "type": "chrome",
      "request": "launch",
      "name": "Launch Chrome against localhost",
      "url": "http://localhost:4200",
      "webRoot": "${workspaceFolder}"
    }
  ]
}
Visual Studio Code is now configured to debug your application.
Step 3 — Debugging Your App
Ensure that your Angular app is still running in your Terminal.
Click the Play button at the top of the Debug panel. This launches an instance of Google Chrome in debug mode.
If you switch to VS Code, you’ll see the Debug toolbar pop up:
Set a breakpoint in your app.component.ts file. Open the src/app/app.component.ts file in Visual Studio Code and add a breakpoint inside of the component by clicking in the area to the left of the line numbers, called the gutter, as shown in the following figure:

Now, refresh debugging by clicking the Restart button on the Debugging toolbar. This opens your application again and triggers the breakpoint. You’ll be directed back to VS Code directly to the place where you set your breakpoint:

From here, you can set more breakpoints, inspect variables, and debug your projects.
Conclusion
In this tutorial, you created an Angular application with Angular CLI and then added configuration to debug it in Visual Studio Code.
If you are interested in learning more about debugging JavaScript in general in either Chrome or VS Code you can check out Debugging JavaScript in Chrome and Visual Studio Code.
Thanks for learning with the DigitalOcean Community. Check out our offerings for compute, storage, networking, and managed databases.
About the author
Developer. Speaker. Teacher. Developer Advocate at Auth0.
Still looking for an answer?
This textbox defaults to using Markdown to format your answer.
You can type !ref in this text area to quickly search our full set of tutorials, documentation & marketplace offerings and insert the link!
i’m using angular 10 workspace with app & library, and i was having trouble setting breakpoints in my library.
i needed to tell “ng serve” to include vendor sourcemaps…
add a “sourceMap” object to your “angular.json” under projects / “my-app” / architect / “serve” / options:
        "serve": {
          "builder": "@angular-devkit/build-angular:dev-server",
          "options": {
            "browserTarget": "app:build",
            "sourceMap": {
              "scripts": true,
              "styles": true,
              "vendor": true
            }
          },
ng build my-library
ng serve my-app
launch.json:
{
    // Use IntelliSense to learn about possible attributes.
    // Hover to view descriptions of existing attributes.
    // For more information, visit: https://go.microsoft.com/fwlink/?linkid=830387
    "version": "0.2.0",
    "configurations": [
        {
            "type": "chrome",
            "request": "launch",
            "name": "my-app",
            "url": "http://localhost:4200",
            "webRoot": "${workspaceFolder}/projects/my-app",
            "sourceMaps": true,
        }
    ]
}
 This work is licensed under a Creative Commons Attribution-NonCommercial- ShareAlike 4.0 International License.
Become a contributor for community
Get paid to write technical tutorials and select a tech-focused charity to receive a matching donation.

DigitalOcean Documentation
Full documentation for every DigitalOcean product.

Resources for startups and SMBs
The Wave has everything you need to know about building a business, from raising funding to marketing your product.
The developer cloud
Scale up as you grow — whether you're running one virtual machine or ten thousand.

Get started for free
Sign up and get $200 in credit for your first 60 days with DigitalOcean.*

*This promotional offer applies to new accounts only.