By James Quick

Introduction
Learning to debug is an essential skill for developers, as it allows them to efficiently fix errors during development. Knowing how to use debugging tools may not always be obvious when working with JavaScript outside of an integrated developer environment (IDE).
This tutorial will take a look at debugging JavaScript with the Google Chrome DevTools, as well as with the popular text editor Visual Studio Code (VS Code).
Prerequisites
To complete this tutorial, you will need the following:
- The latest version of Google Chrome installed on your machine.
- The latest version of Visual Studio Code installed on your machine.
- Node.js installed locally, which you can do by following How to Install Node.js and Create a Local Development Environment.
For this tutorial, you can apply the lessons to one of your own JavaScript projects that can be run on a Node server, but there is also the option to follow along using a sample application if you prefer.
Step 1 — Creating a Sample App (Optional)
If you don’t have a JavaScript project to follow along with, you can complete this step to create a Quick Chat project.

You use Git to clone the Design-and-Build-a-Chat-Application-with-Socket.io repo. Or you can download the zip file and unzip the contents.
Note: If you need Git installed on your system, consult Getting Started with Git.
For the purposes of this tutorial, you will use the code from Part 8. Take a moment to familiarize yourself with how you would expect the application to work.
Start by navigating to the project directory and into the part-8 directory:
- cd Design-and-Build-a-Chat-Application-with-Socket.io
- cd part-8
Next, install the npm packages for the project:
- npm install
Then, start the server:
- npm start
If you visit 127.0.0.1:3000 in Chrome, you should see a prompt for username. After providing a username and clicking the Chat! button, you will be directed to the chat app and see the following:
- OutputUser joined the chat...
By entering text in the input at the bottom of the window and clicking the Send button, your messages will display in the chat window.
If you open a new browser tab and visit the same URL, you can log in as another user and observe chat messages being sent to the chat windows in both browser tabs. This is the expected functionality for this application.
Introducing the Bug
Now, you will intentionally introduce a tiny bug that fails to register who the user is after they’ve logged in.
Open part-8/public/app.js in a text editor and find line 96:
  //set the username and create logged in message
  username = usernameInput.value;
Change this line to the following:
  //set the username and create logged in message
  username = usernameInput.text; // added bug
Refresh your browser tab. Login and observe the following:
- Outputundefined joined the chat...
The app incorrectly grabs the user’s username by referencing usernameInput.text instead of usernameInput.value. We will use this to practice debugging.
Step 2 — Understanding the Basics of Debugging
Before you begin to debug your app, it is helpful to be familiar with how debugging works. The idea of debugging is being able to (conditionally) trigger what are called breakpoints to pause the execution of your code. This provides you with the opportunity to look at the state of your application by taking an action such as inspecting variables. You can even take it a step further and ‘watch’ variables of your choosing, so that whenever your application is paused, you can inspect the values for these variables specifically.
After triggering a breakpoint, you will typically have the following options:
- Continue the execution of your program.
- Step through your code line by line.
- Step out of the current function that you are in.
- Step into the next function call.
You’ll additionally have access to view the call stack. In other words, as functions call other functions in your program, you can inspect the history of those function calls.
Now that you’ve covered the basics of how debugging works, you are ready to start debugging your app.
Step 3 — Debugging in Google Chrome
To get started with debugging in Chrome, add a debugger statement to your application.
If you are following along with the sample application, you can add it to the loginBtn click event handler:
loginBtn.addEventListener('click', e => {
  debugger; // added debugger
  e.preventDefault();
  if (!usernameInput.value) {
    return console.log('Must supply a username');
  }

  //set the username and create logged in message
  username = usernameInput.text; // added bug
  sendMessage({ author: username, type: messageTypes.LOGIN });

  //show chat window and hide login
  loginWindow.classList.add('hidden');
  chatWindow.classList.remove('hidden');
});
When this statement is reached, your application will be paused and the debug tools will automatically be activated. You will notice that the application will be grayed out to signify that it has been stopped. You will also see the Sources tab in Chrome DevTools has popped up:

Let’s breakdown what we’re seeing.
Sources
The first thing you might notice is what appears to be a copy of your code. This is the code that the browser has loaded and is running as your application. You can also see that the debugger line is highlighted in a blue color to let you know that this is where your application has been paused:

Chrome gives you the ability to view this code for a reason. With the code in front of you, you can now set breakpoints. A breakpoint is an intentional stopping or pausing place in a program.
To add a breakpoint, click in the gutter, or empty space, to the left of the line numbers. As you do, notice that Chrome now adds this breakpoint to the list of breakpoints further down.
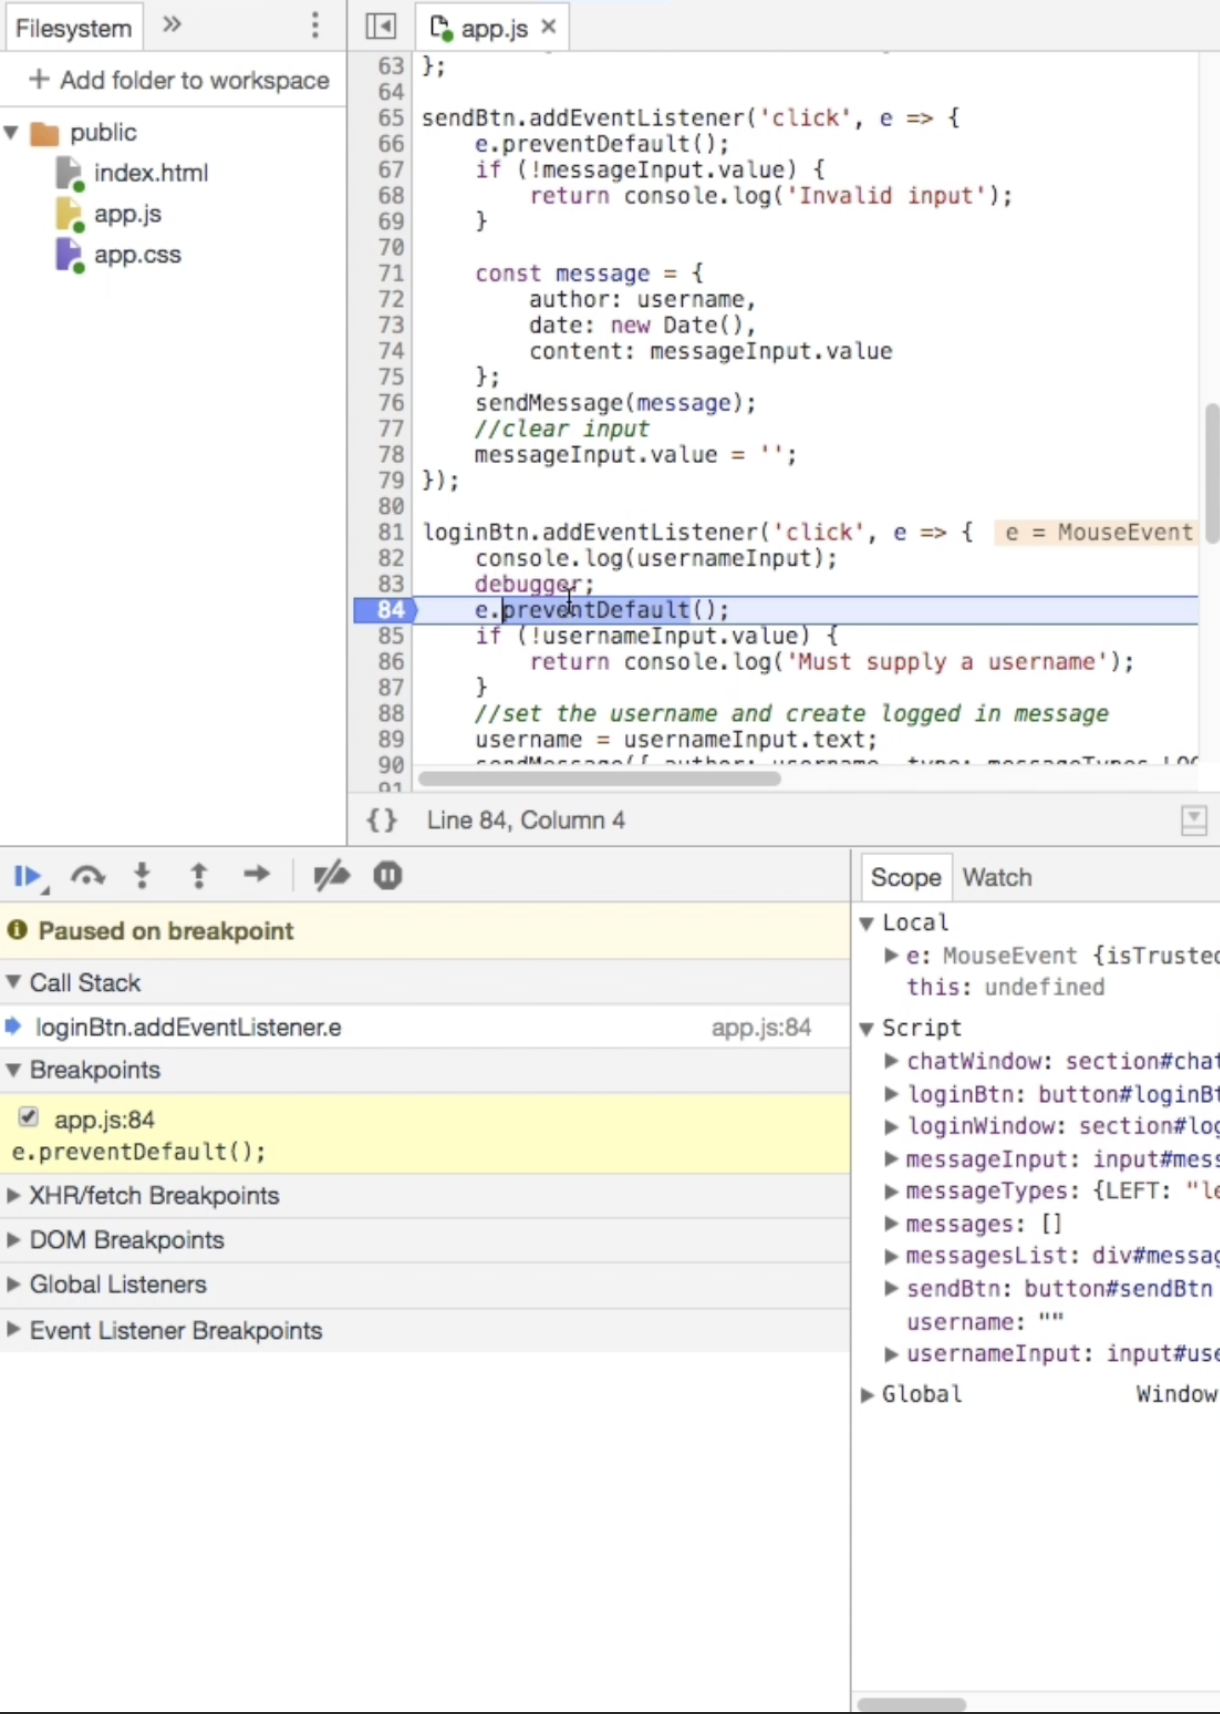
Scope
In the Scope tab, you have the ability to inspect variables in your application. You’ll notice there is a Local section (local scope to the function where the breakpoint is), a Global section (the global scope), and a Script section. In the Script section, you can view variables within the scope of the current script:

This is where a significant amount of your debugging time will be spent. This is a much more efficient replacement for writing out many console.log() statements.
Watch
In addition to viewing variables in the Scope tab, you can also define variables that you want to look into specifically. By adding a variable to the Watch tab, each time you hit a breakpoint, you can quickly find the value of that variable (which may be undefined depending on where you are in the code). Use the add icon (+) and enter the name of the variable you want to track.
If you are following along with the sample application, you can use:
usernameInput

Step Functions, Call Stack, and Breakpoints List
The last sections will allow you to view the list of breakpoints, call stack, etc.

If you are following along with the sample application, the call stack will contain the function listed for the event handler for the login button (loginBtn.addEventListener.e). This function is listed because it is the only function that has been called so far. As functions call more functions, that chain will be updated appropriately.
Notice also the arrow buttons at the top of the debugger.

These correspond to the functions referenced for continuing execution of your code or stepping through it line by line or by function. Test these buttons a bit to get used to how you navigate the execution of your code.
Lastly, there are different kinds of breakpoints that can be set. Let’s take a look at creating a conditional breakpoint, one that will only get triggered if a certain condition is met. Right-click the gutter and choose Add conditional breakpoint….
If you are following along with the sample application, you can create a breakpoint for when the the user attempts to log in without entering a username. Set a conditional breakpoint with the following condition:
usernameInput.text === ''

In the case of debugging the sample application, if you press the login button without entering a username, this breakpoint will be triggered. Otherwise code will continue to execute as normal.
Note that there are even more breakpoint options available that are not covered here.
Step 4 — Debugging in VS Code
As you’ve seen so far, the Chrome DevTools offer a great experience to debug your application with lots of functionality. However, Visual Studio Code in many ways has matching debugging functionality integrated more seamlessly into your environment.
To get started debugging in VS Code, install the Debugger for Chrome extension:

Let’s take a quick look at the debug tab in the sidebar (on the left side of your editor by default). Open the debug tab by clicking on the icon that looks like a bug:

With this pane open, you will see similar tools to what we saw in Chrome: variables, watch, call stack, and breakpoints.

The majority of the functionality that you get in Chrome DevTools is available right here inside of VS Code.
Now that you’ve seen the Debug tab, create a launch configuration that tells VS Code how to debug your application. VS Code stores debug configurations in a file called launch.json inside of a folder named .vscode.
To have VS Code create this file for you, you can click the link mentioned in the To customize Run and Debug create a launch.json file message in the pane. You could also accomplish this by navigating through the menu and selecting Run followed by Add Configuration…. Then you will choose Chrome.

The specific configuration that you created will automatically attach to the application at the defined port.
You may need to make changes to this configuration to correctly point to the source code for the app.
If you are following along with the sample application, you should change the port from 8080 to 3000.
The sample application is served from the public directory and you should update webRoot to reflect that.
For debugging the sample application, the launch.json file should resemble:
{
  "version": "0.2.0",
  "configurations": [
    {
      "type": "chrome",
      "request": "launch",
      "name": "Launch Chrome",
      "url": "http://localhost:3000",
      "webRoot": "${workspaceFolder}/public"
    }
  ]
}
Note: Keep in mind that your application must already be running locally at a certain port for this to work.
With the configuration defined, you can now start your debug session by clicking the green play button at the top of the pane. You can also use the menu (Run and then Start Debugging) and keyboard shortcuts.
Your application will pop up in a Chrome window.
You will notice the debug menu bar that popped up in the background inside of VS Code. With this debug toolbar, you can pause, restart, continue, and use step functions to navigate your code and interact with the debugger.
With debugging connected, you can set a breakpoint in the code like you did in Chrome. Click in the gutter next to the line number.
If you are following along with the sample application, create a breakpoint in the same location as before, just inside the login event callback.
Now, when trying to log in without entering a username, the breakpoint will trigger and switch the context back to VS Code for further investigation.

From here, the functionality that we discussed in Chrome maps over directly to VS Code. If you want to add a conditional breakpoint, right-click in the gutter and choose Add Conditional Breakpoint… with some condition. If you want to watch a variable, click to add a new one, and type the name of the variable to watch. If you want to explore variables, go to the Variables tab.
Conclusion
In this tutorial, you used both Chrome and Visual Studio Code to debug your application. Knowing how both of these options works will allow you to adopt a workflow that works best for you.
Taking the next step as a developer involves taking advantage of the ecosystem of tools that are available to your programming language. Debugging is one of those topics that takes some time and effort to get started with, but ultimately the benefit will outweigh the cost.
Thanks for learning with the DigitalOcean Community. Check out our offerings for compute, storage, networking, and managed databases.
About the author
Developer. Speaker. Teacher. Developer Advocate at Auth0.
Still looking for an answer?
This textbox defaults to using Markdown to format your answer.
You can type !ref in this text area to quickly search our full set of tutorials, documentation & marketplace offerings and insert the link!
 This work is licensed under a Creative Commons Attribution-NonCommercial- ShareAlike 4.0 International License.
Become a contributor for community
Get paid to write technical tutorials and select a tech-focused charity to receive a matching donation.

DigitalOcean Documentation
Full documentation for every DigitalOcean product.

Resources for startups and SMBs
The Wave has everything you need to know about building a business, from raising funding to marketing your product.
The developer cloud
Scale up as you grow — whether you're running one virtual machine or ten thousand.

Get started for free
Sign up and get $200 in credit for your first 60 days with DigitalOcean.*

*This promotional offer applies to new accounts only.