By James Quick

Introduction
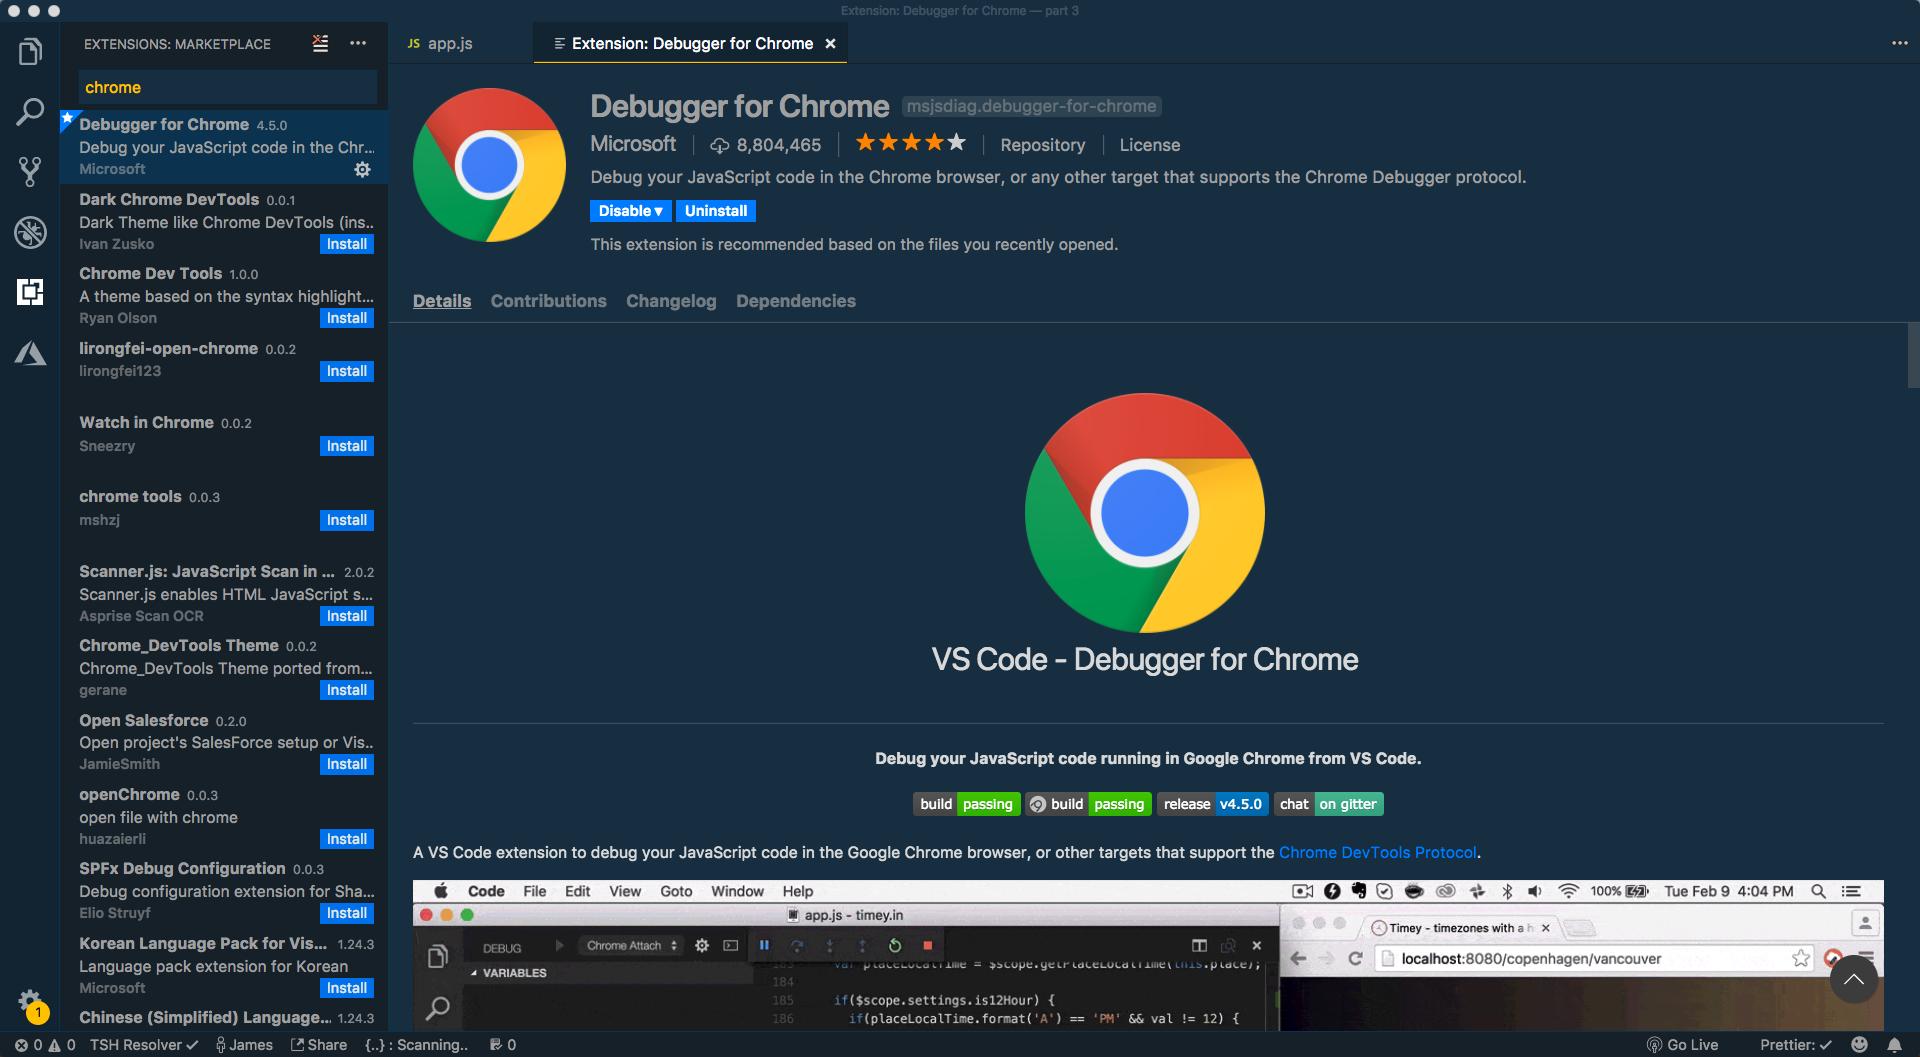
Visual Studio Code has a large amount of functionality built-in, including support for debugging applications. In this article, you will configure VS Code to debug Node.js by downloading the Debugger for Chrome extension, creating a debug configuration, launching a debug configuration, and setting breakpoints.
Prerequisites
To complete this tutorial, you will need:
- Node.js installed locally, which you can do by following How to Install Node.js and Create a Local Development Environment.
- The latest version of Visual Studio Code installed on your machine.
- The Debugger for Chrome extension installed in Visual Studio Code.
For this tutorial, you can apply the lessons to one of your JavaScript projects that can be run on a Node server.
There is also the option to follow along using a sample application if you prefer.
Step 1 — Creating a Sample App (Optional)
This tutorial will debug an example application called Quick Chat. If you do not have a project to follow along with, you can follow this step to create this application.
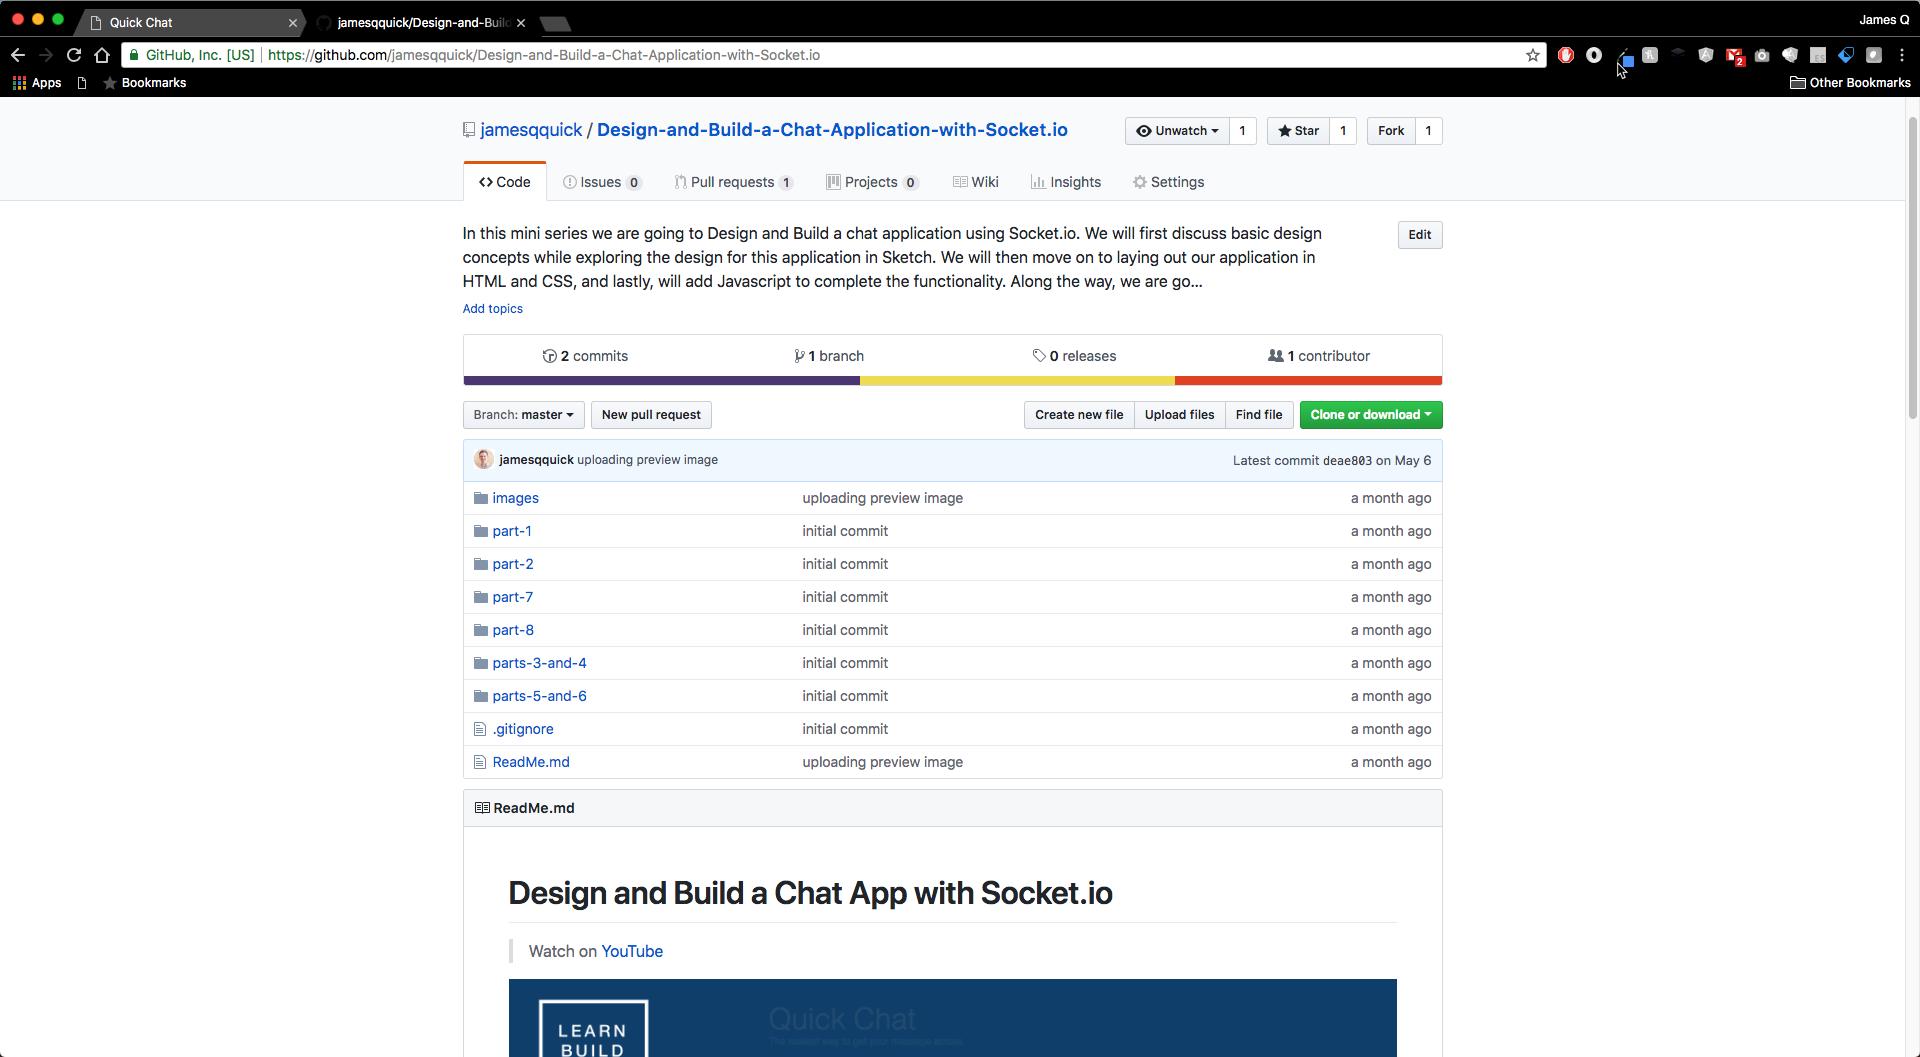
You use Git to clone the Design-and-Build-a-Chat-Application-with-Socket.io repo. You can also download the zip file and unzip the contents.
Note: If you need Git installed on your system, consult Getting Started with Git tutorial.
For this tutorial, you will use the code from Part 8 of the project. Take a moment to familiarize yourself with how you would expect the application to work.
Start by navigating to the project directory and then into the part-8 directory:
- cd Design-and-Build-a-Chat-Application-with-Socket.io
- cd part-8
Next, install the npm packages for the project:
- npm install
Then, start the server:
- npm start
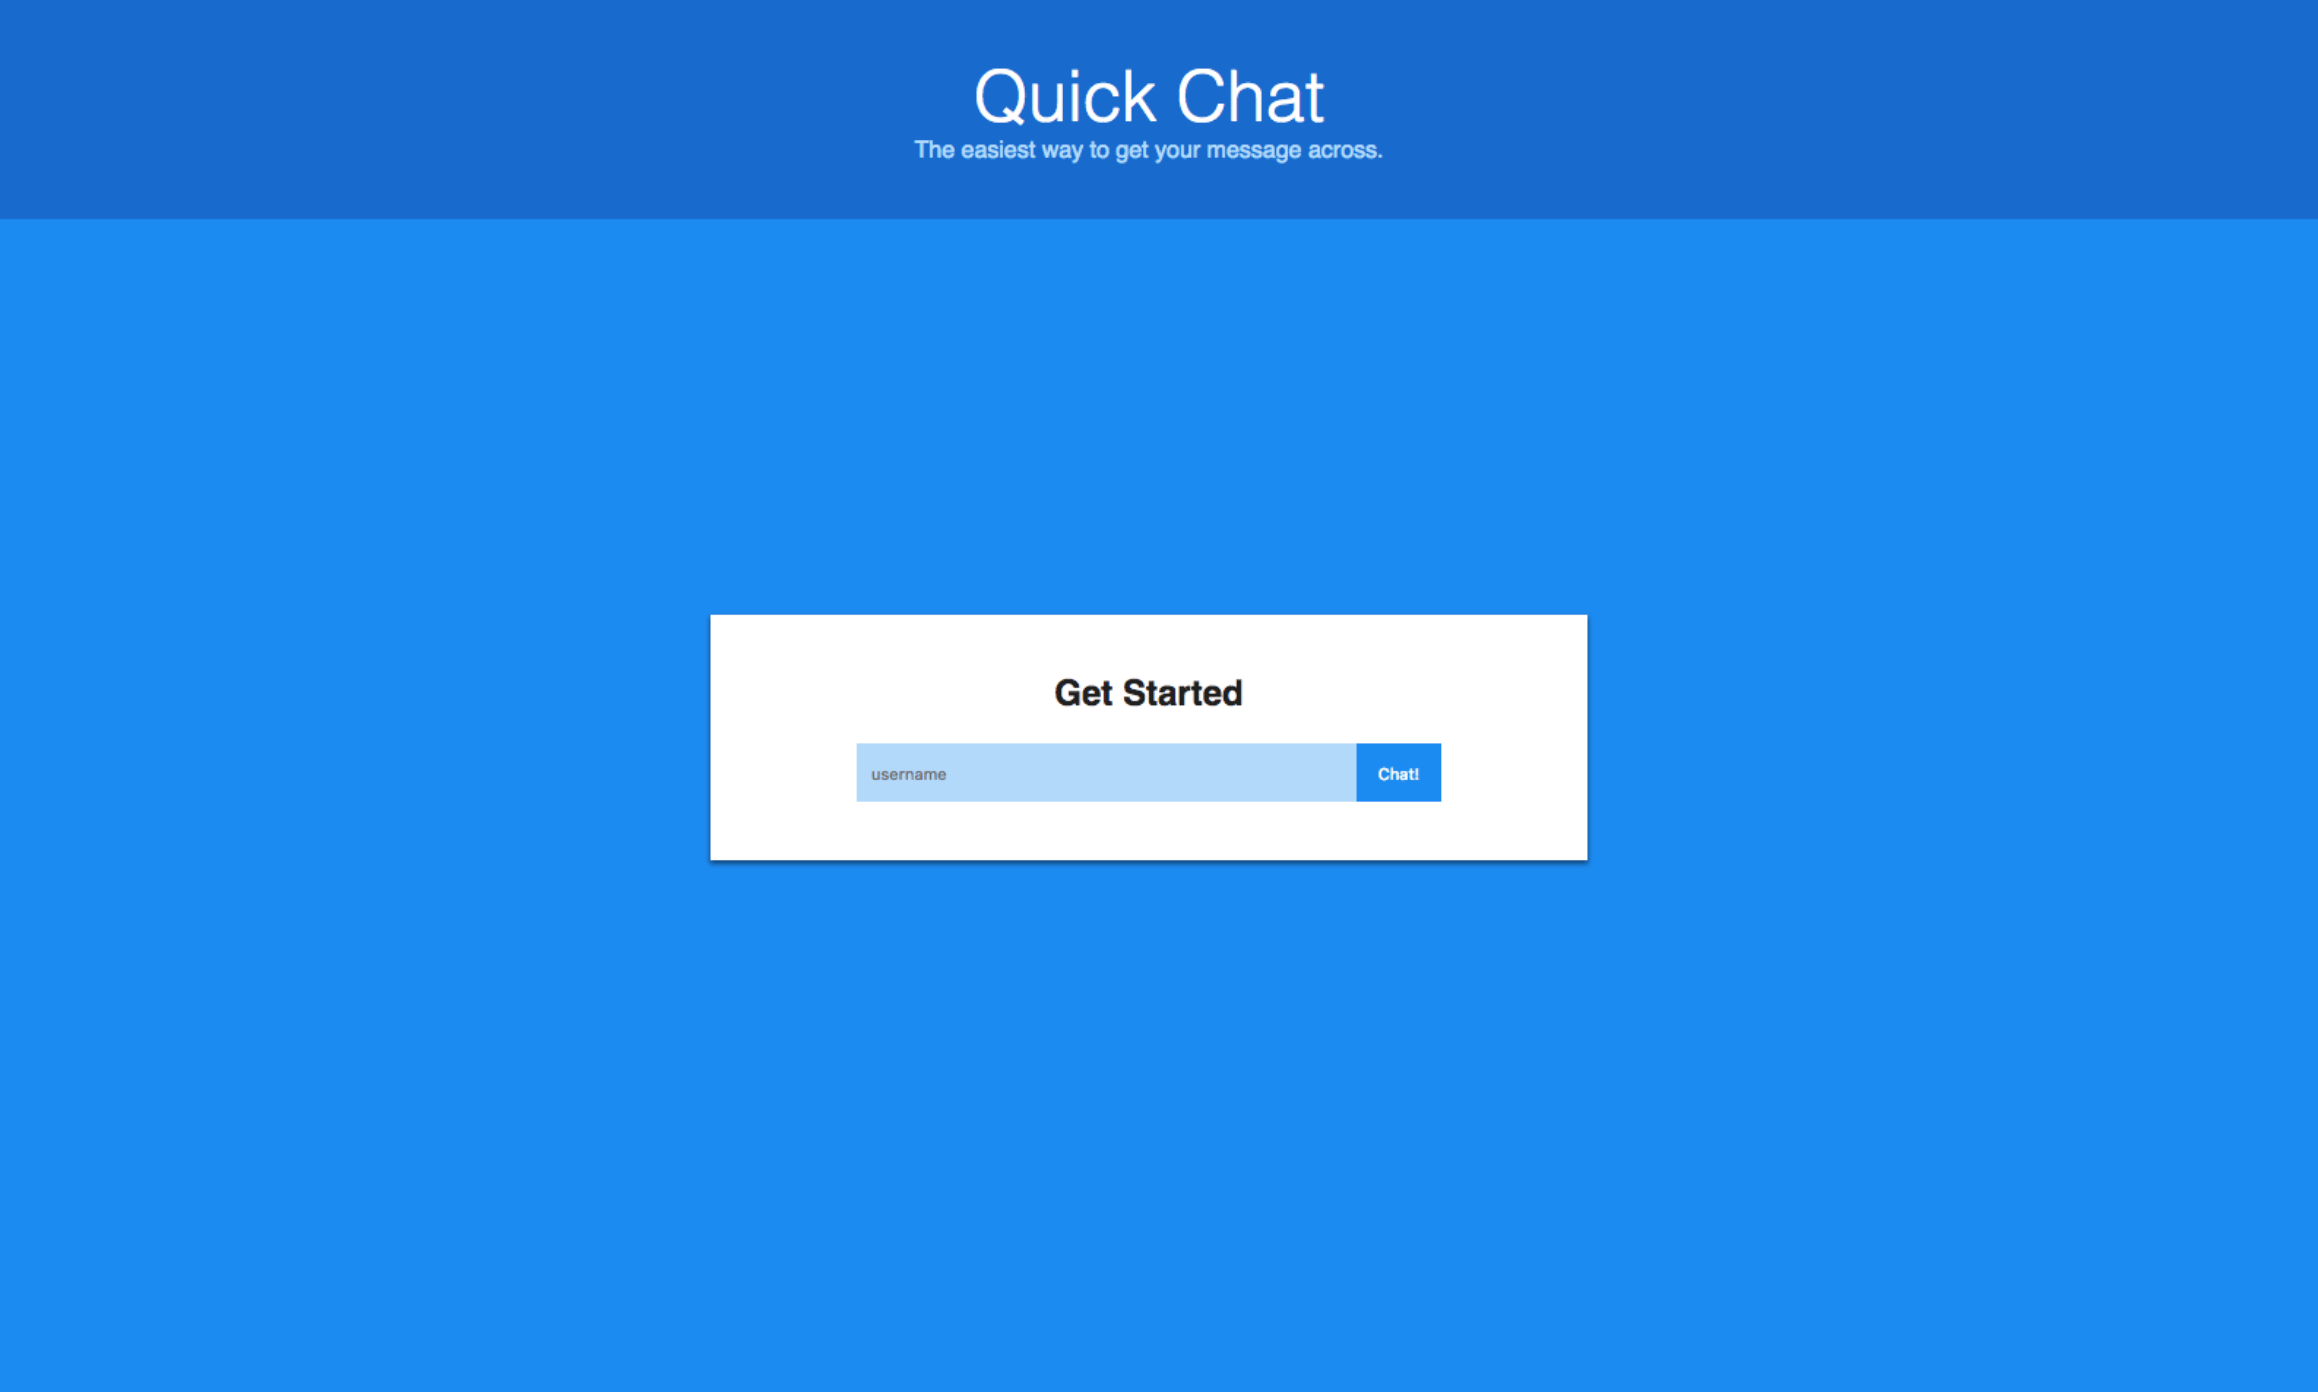
If you visit 127.0.0.1:3000 in Chrome, you will see a username prompt. After providing a username and clicking the Chat! button, you will be directed to the chat app and see the following:
- OutputUser joined the chat...
By entering text in the input at the bottom of the window and clicking the Send button, your messages will display in the chat window.
If you open a new browser tab and visit the same URL, you can log in as another user and observe chat messages sent to the chat windows in both browser tabs. This behavior is the expected functionality for this application.
Step 2 — Creating a Breakpoint
Now, let’s create a breakpoint in our app. Breakpoints allow you to pause your code and inspect it.
The Quick Chat application is a Node/Express app that uses Socket.io to allow users to chat with each other in real-time. We will add a breakpoint where a client connects to our server.
To create a breakpoint in VS Code, click in the gutter, or empty space, to the left of the line numbers.
As shown in the following screenshot, we’ve created a breakpoint (the red circle) inside the function that gets called each time a user gets connected.
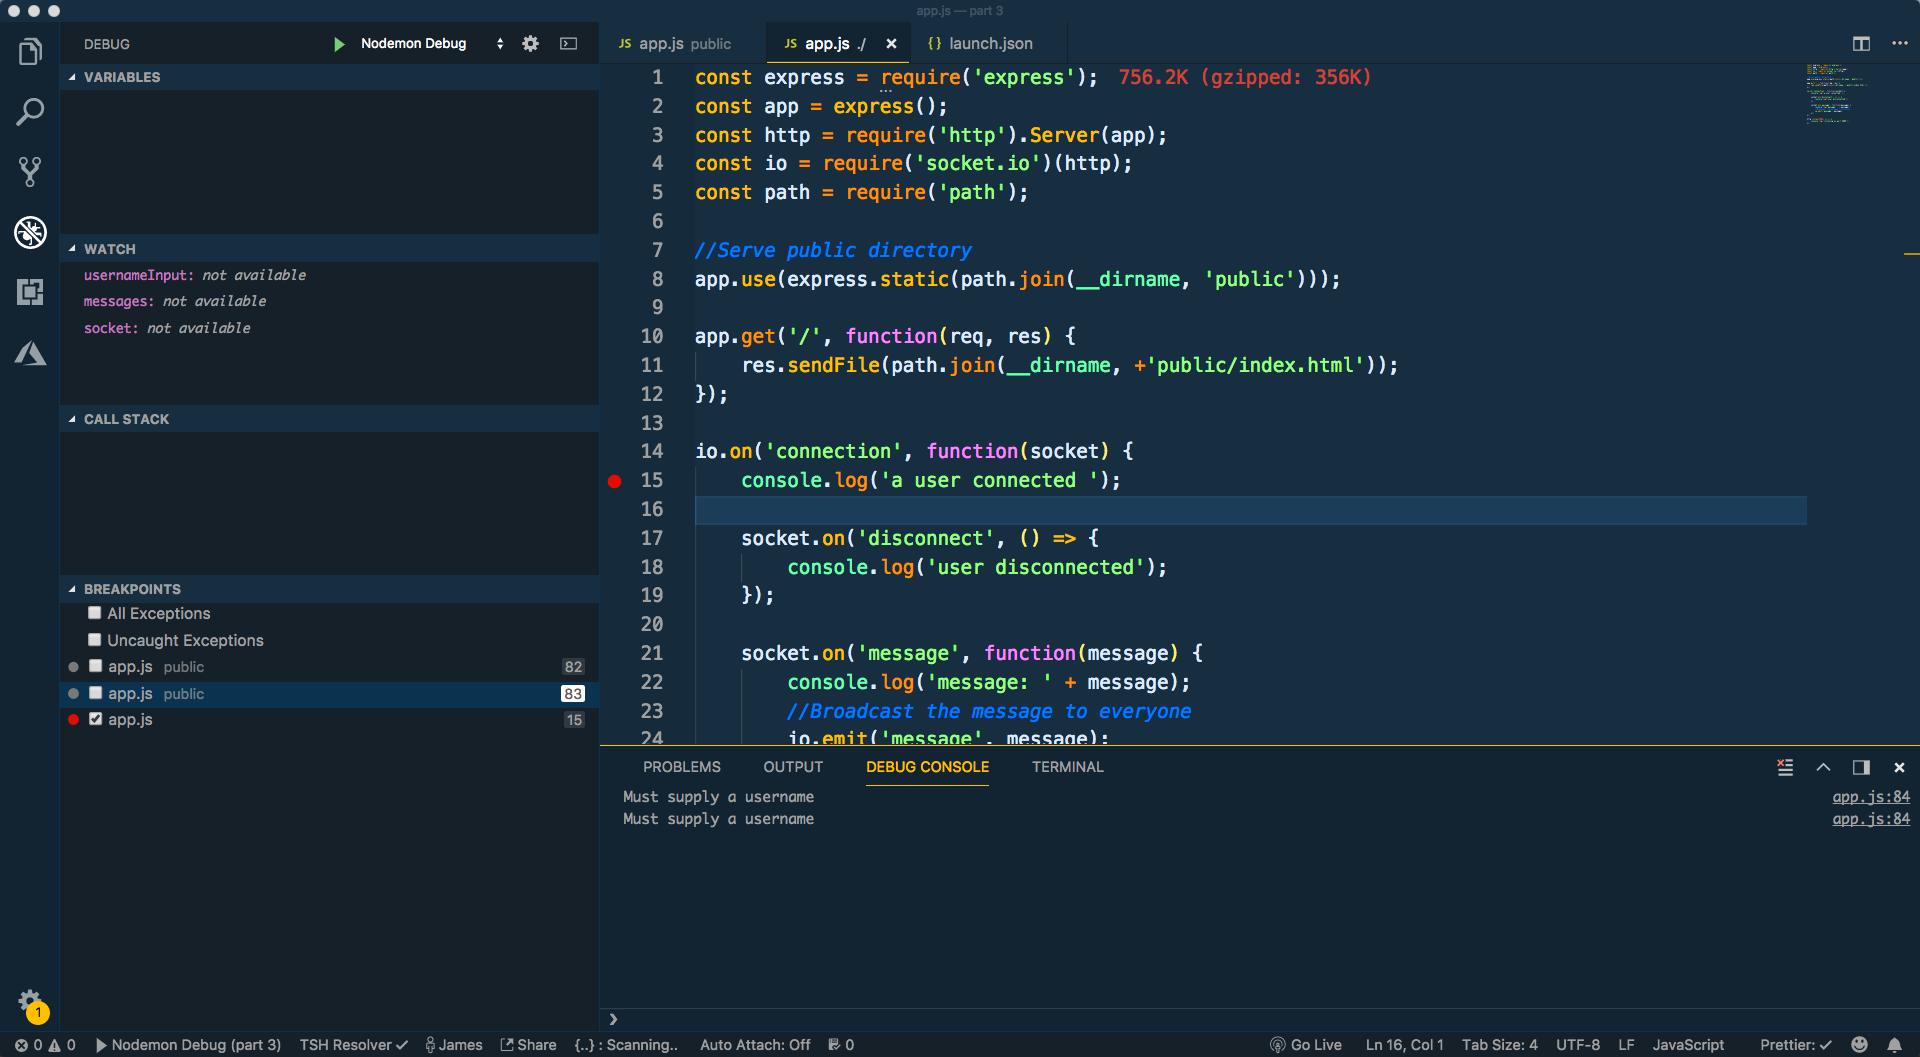
// ...
io.on('connection', socket => {
  console.log('a user connected');
  // ...
});
Regardless of what application you are debugging, set a breakpoint that can be triggered easily, such as when the application loads, a route is triggered, etc.
Step 3 — Using the VS Code Debugging Panel
To open the debug panel, click on the bug icon on the sidebar (on the left side by default). You’ll notice that there are four different sections: variables, watch, call stack, and breakpoints.
At the top of the panel, you will see a green play button and a dropdown that says No Configurations if you have yet to create a debug configuration. If you have already created a configuration, you’ll see it listed there.
VS Code stores debug configurations in a file called launch.json inside of a folder called .vscode. VS Code helps us not only create that folder and file but also helps to generate predefined configurations as well. Let’s take a look at creating our first one.
To create your initial launch.json file, click the No Configurations dropdown and choose Add Configuration. From here, ignore the popup and we will get started with creating our first configuration.
Key Components of a Debug Configuration
name- The name of the configuration as displayed in the configurations dropdown.request- The type of action that you want to take.type- The type of debugger for the configuration. This type can be Node, Chrome, PHP, etc.
As you create different configurations, VS Code will also provide IntelliSense for other properties that can be defined.
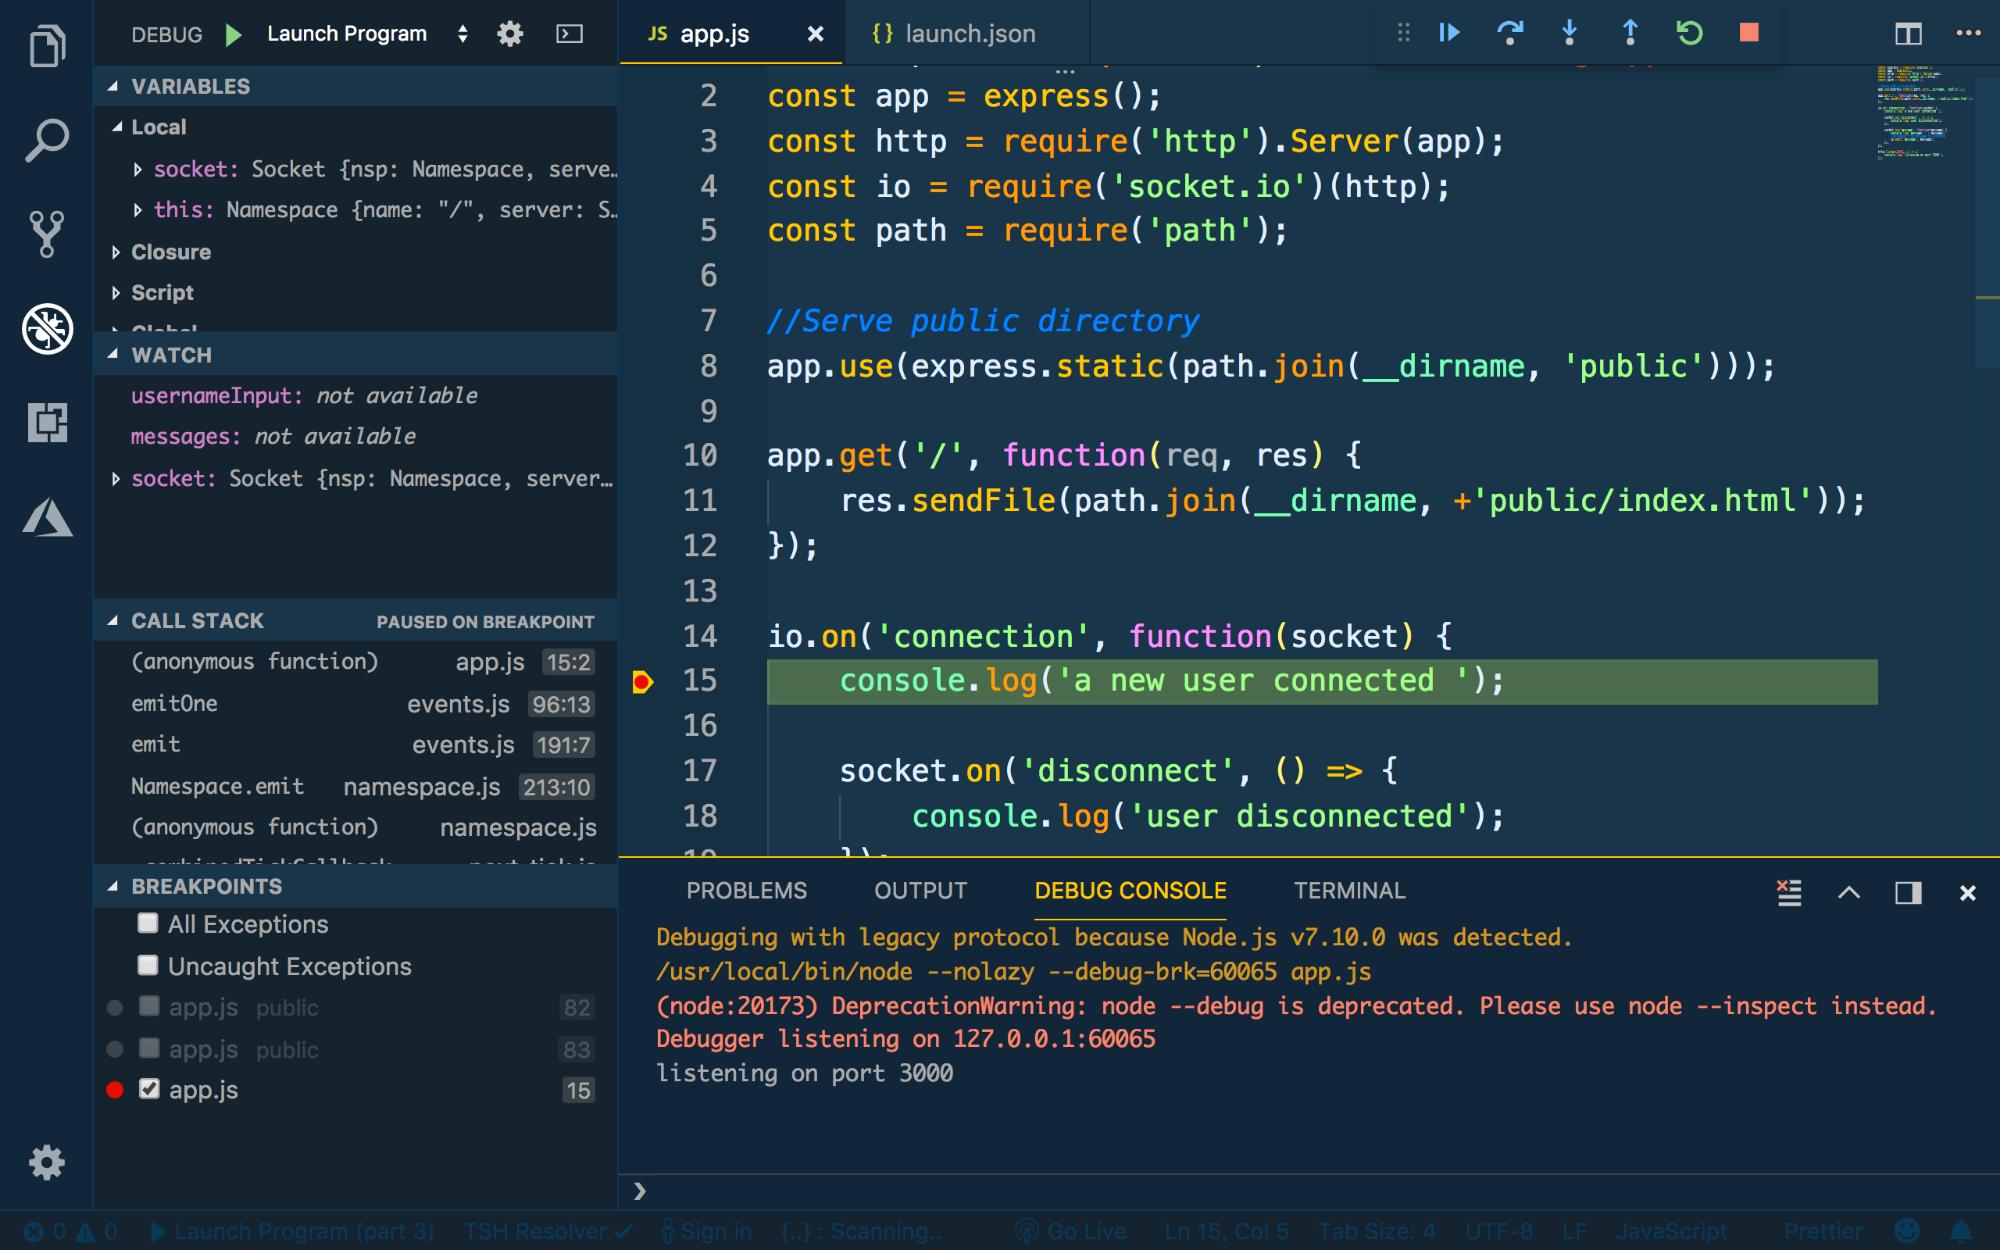
Step 4 — Debugging with Launch Program
This first configuration will launch our Node application in debug mode. Running in debug mode means that VS Code will connect to our app over a specific port for debugging. For this configuration, we need to define the program file that will be run. The configuration looks like this:
{
  "type": "node",
  "request": "launch",
  "name": "Launch Program",
  "program": "${workspaceFolder}/app.js"
},
To run this configuration, choose it from the configurations dropdown list, and click the green play button. Your debug action bar will pop up in the top right with step, continue, restart, and stop buttons.
To start a Node application in debug mode going forward, use the --inspect flag.
Step 5 — Debugging with Attach by Process ID
The second configuration we’ll look at is attaching to a Node process by Process ID. This scenario would be relevant for an application that is already running on your local environment.
{
  "type": "node",
  "request": "attach",
  "name": "Attach by Process ID",
  "processId": "${command:PickProcess}"
},
For this, we will need to start the Node server ourselves before running the debug configuration. Use the following command to start your server (using --inspect as mentioned earlier) and replace app.js with the name of your server file.
- node --inspect app.js
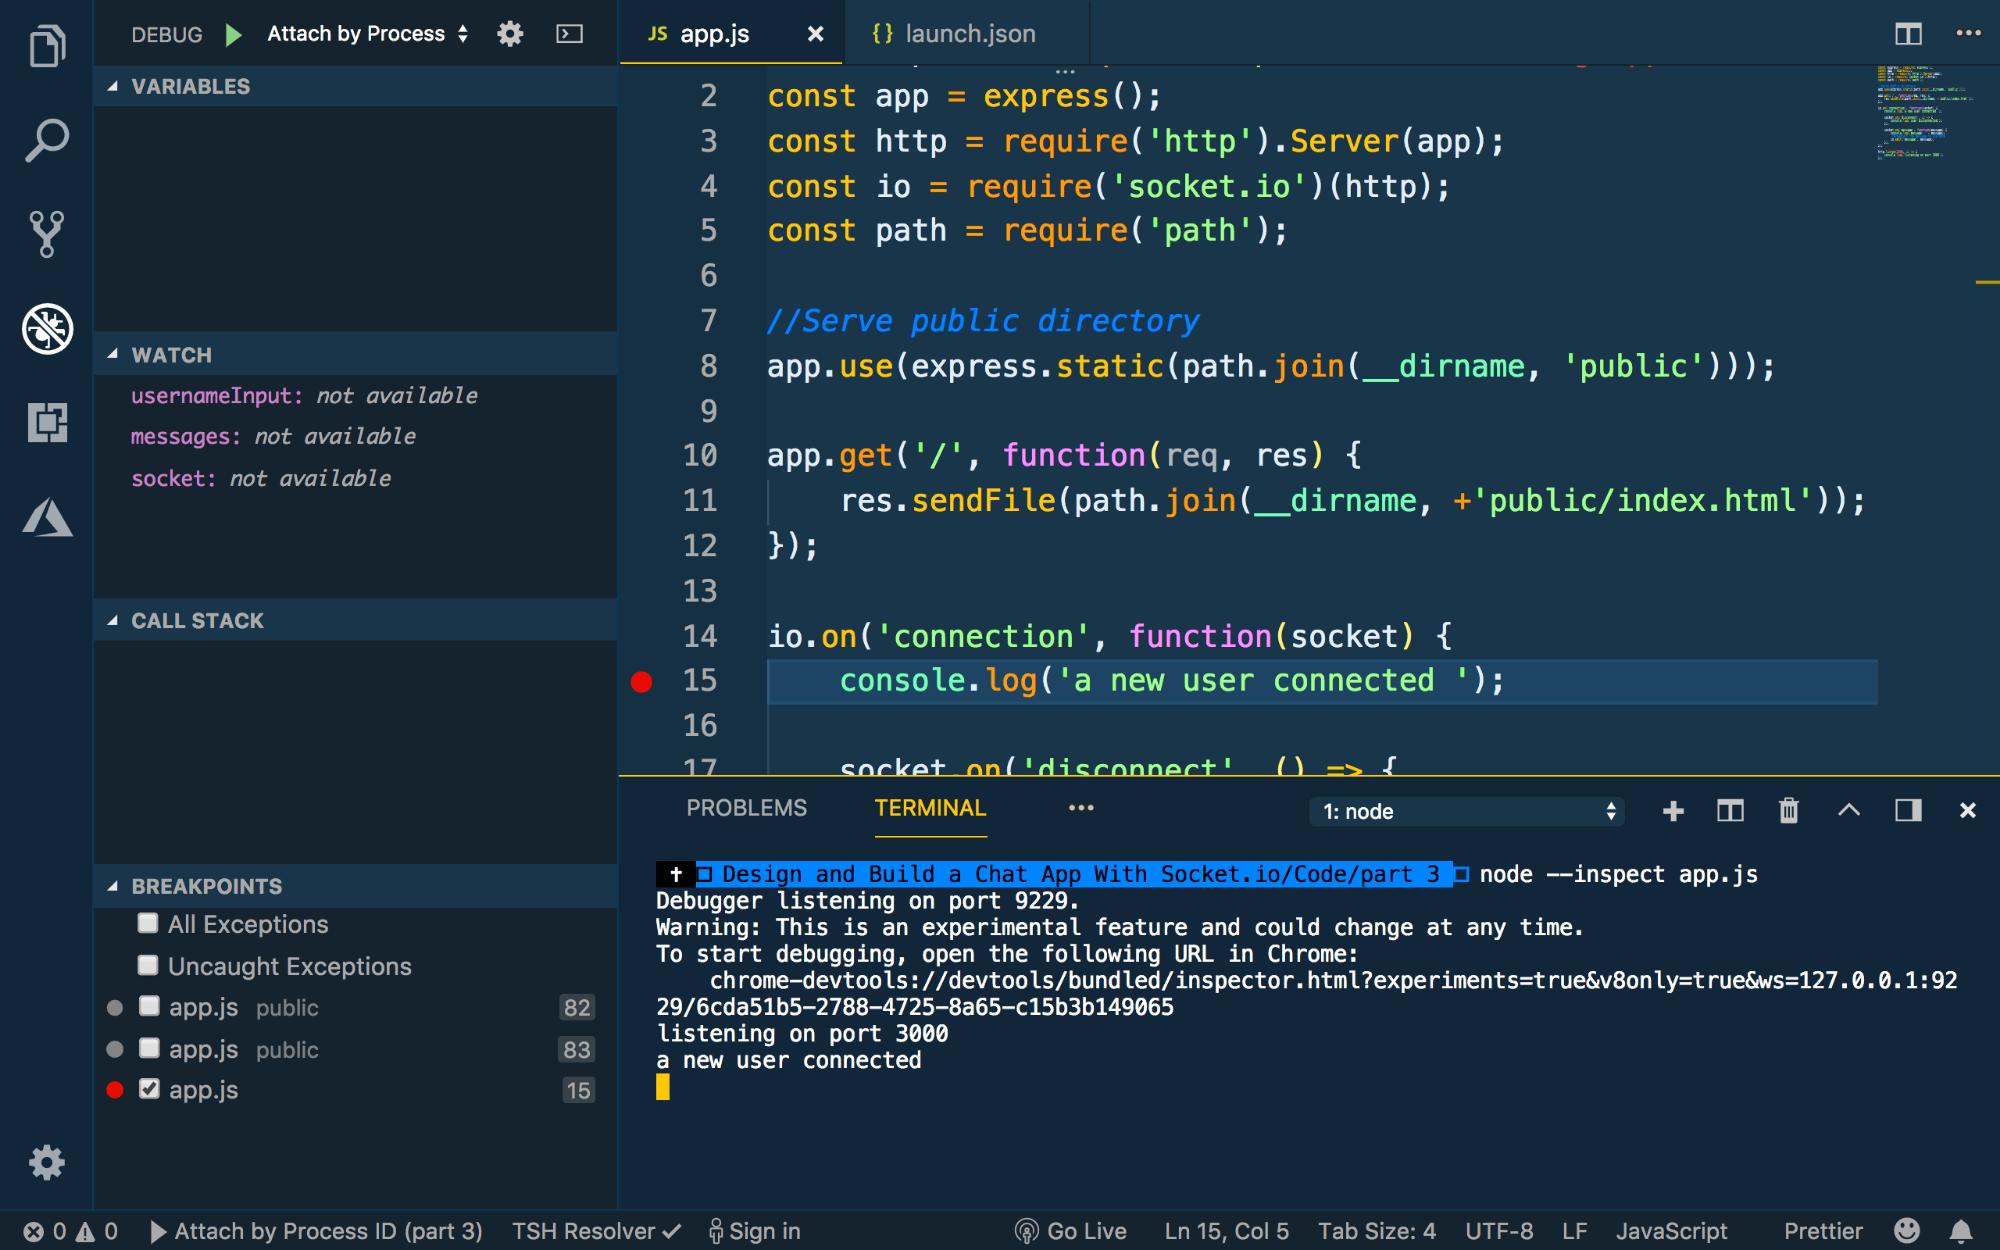
With your server started, now you can run your debug configuration. When prompted, choose the Node process that corresponds to the command you just ran to start the server.
You will get a successful connection:
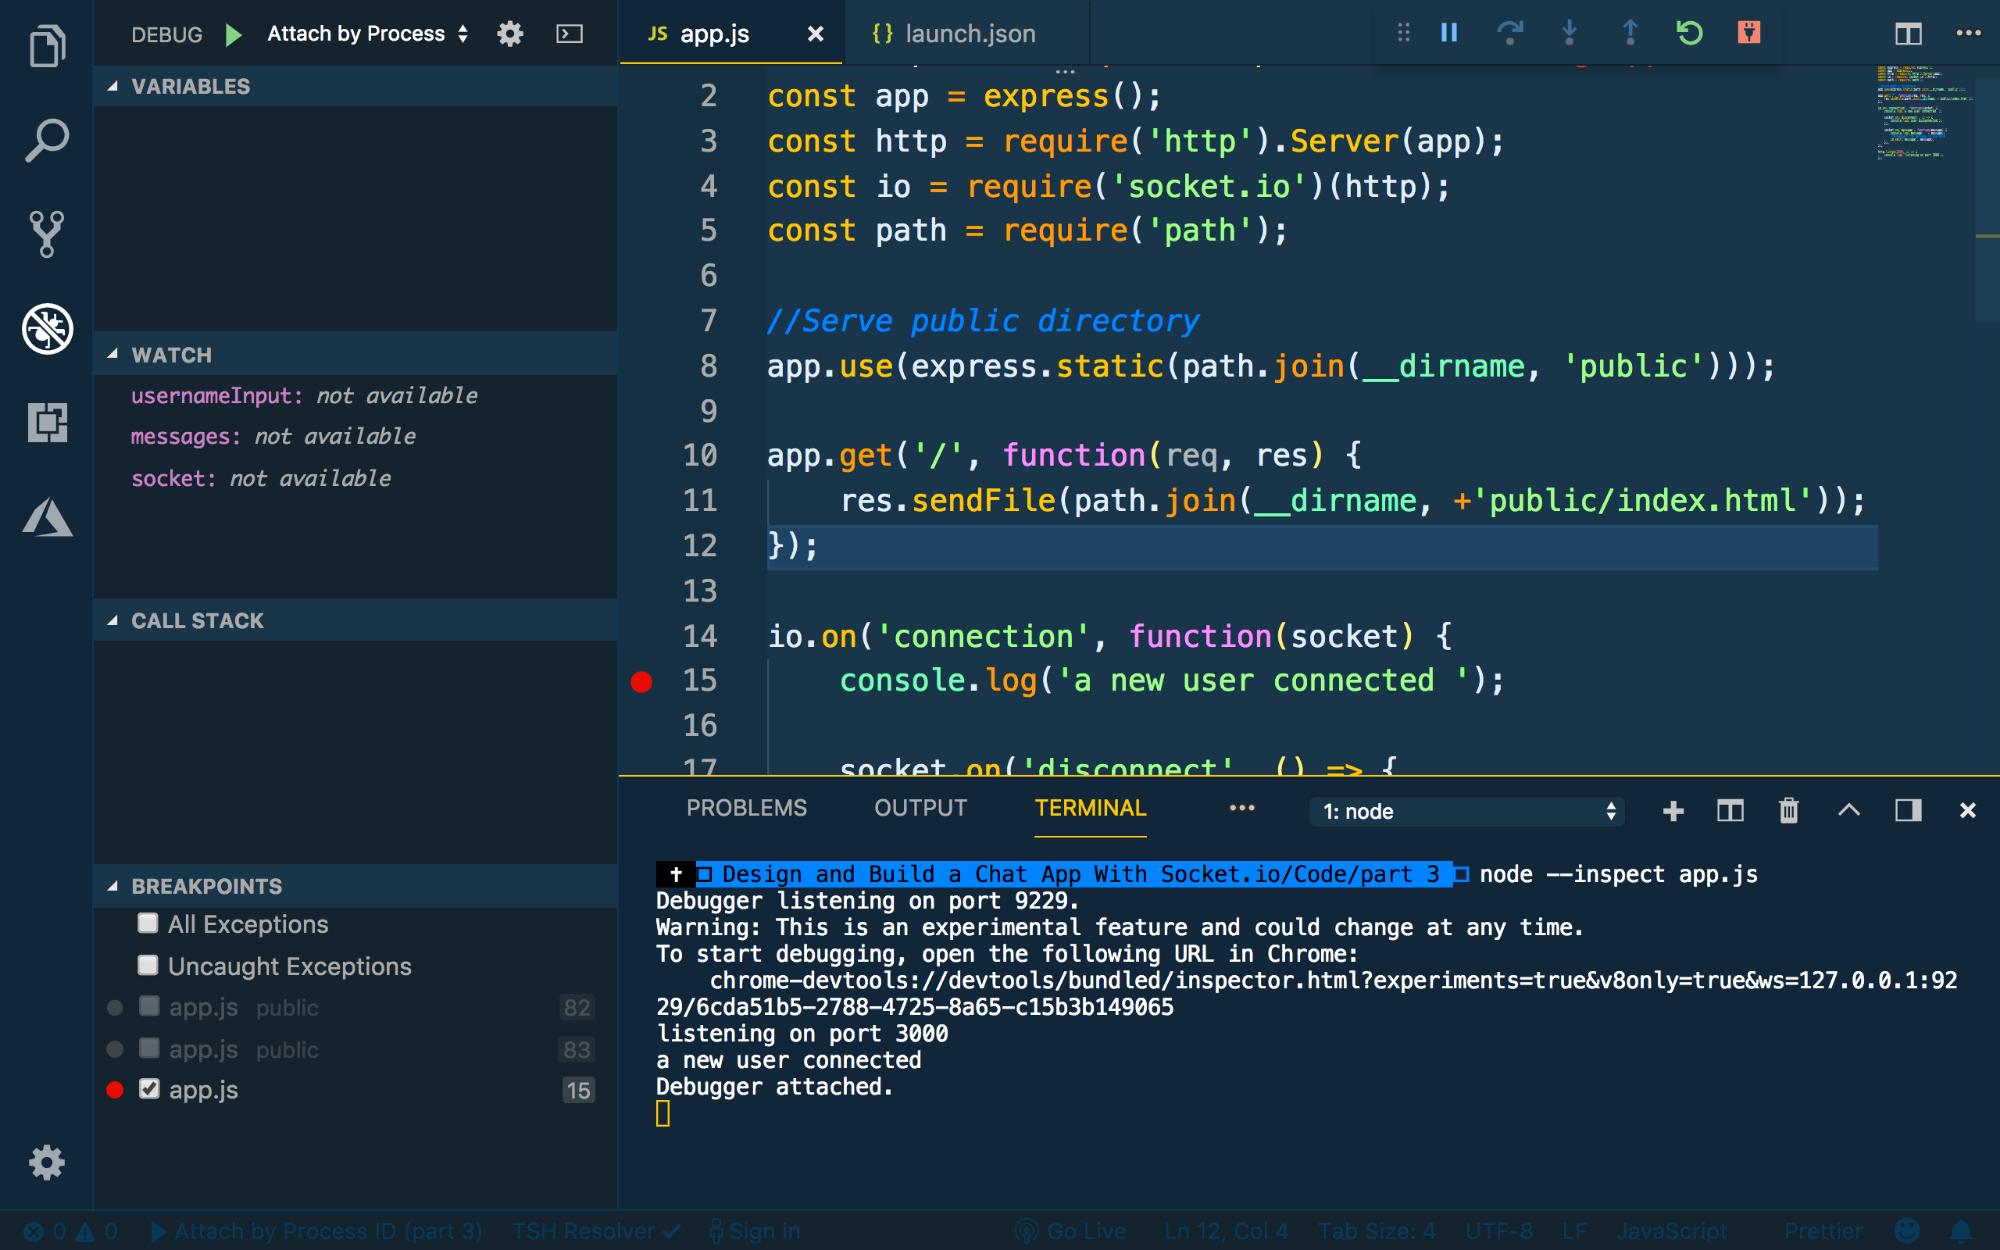
Step 6 — Debugging with Attach to Port
For our third configuration, we will be attaching to an existing Node application running on a given port.
{
  "type": "node",
  "request": "attach",
  "name": "Attach to Port",
  "port": 9229
},
9229 is the default port for debugging when using the --inspect flag, so that’s what we’re going to use.
Since we’ve already started our server with the previous configuration, we can go ahead and start our debug configuration. Choose the Attach to Port configuration and click play:
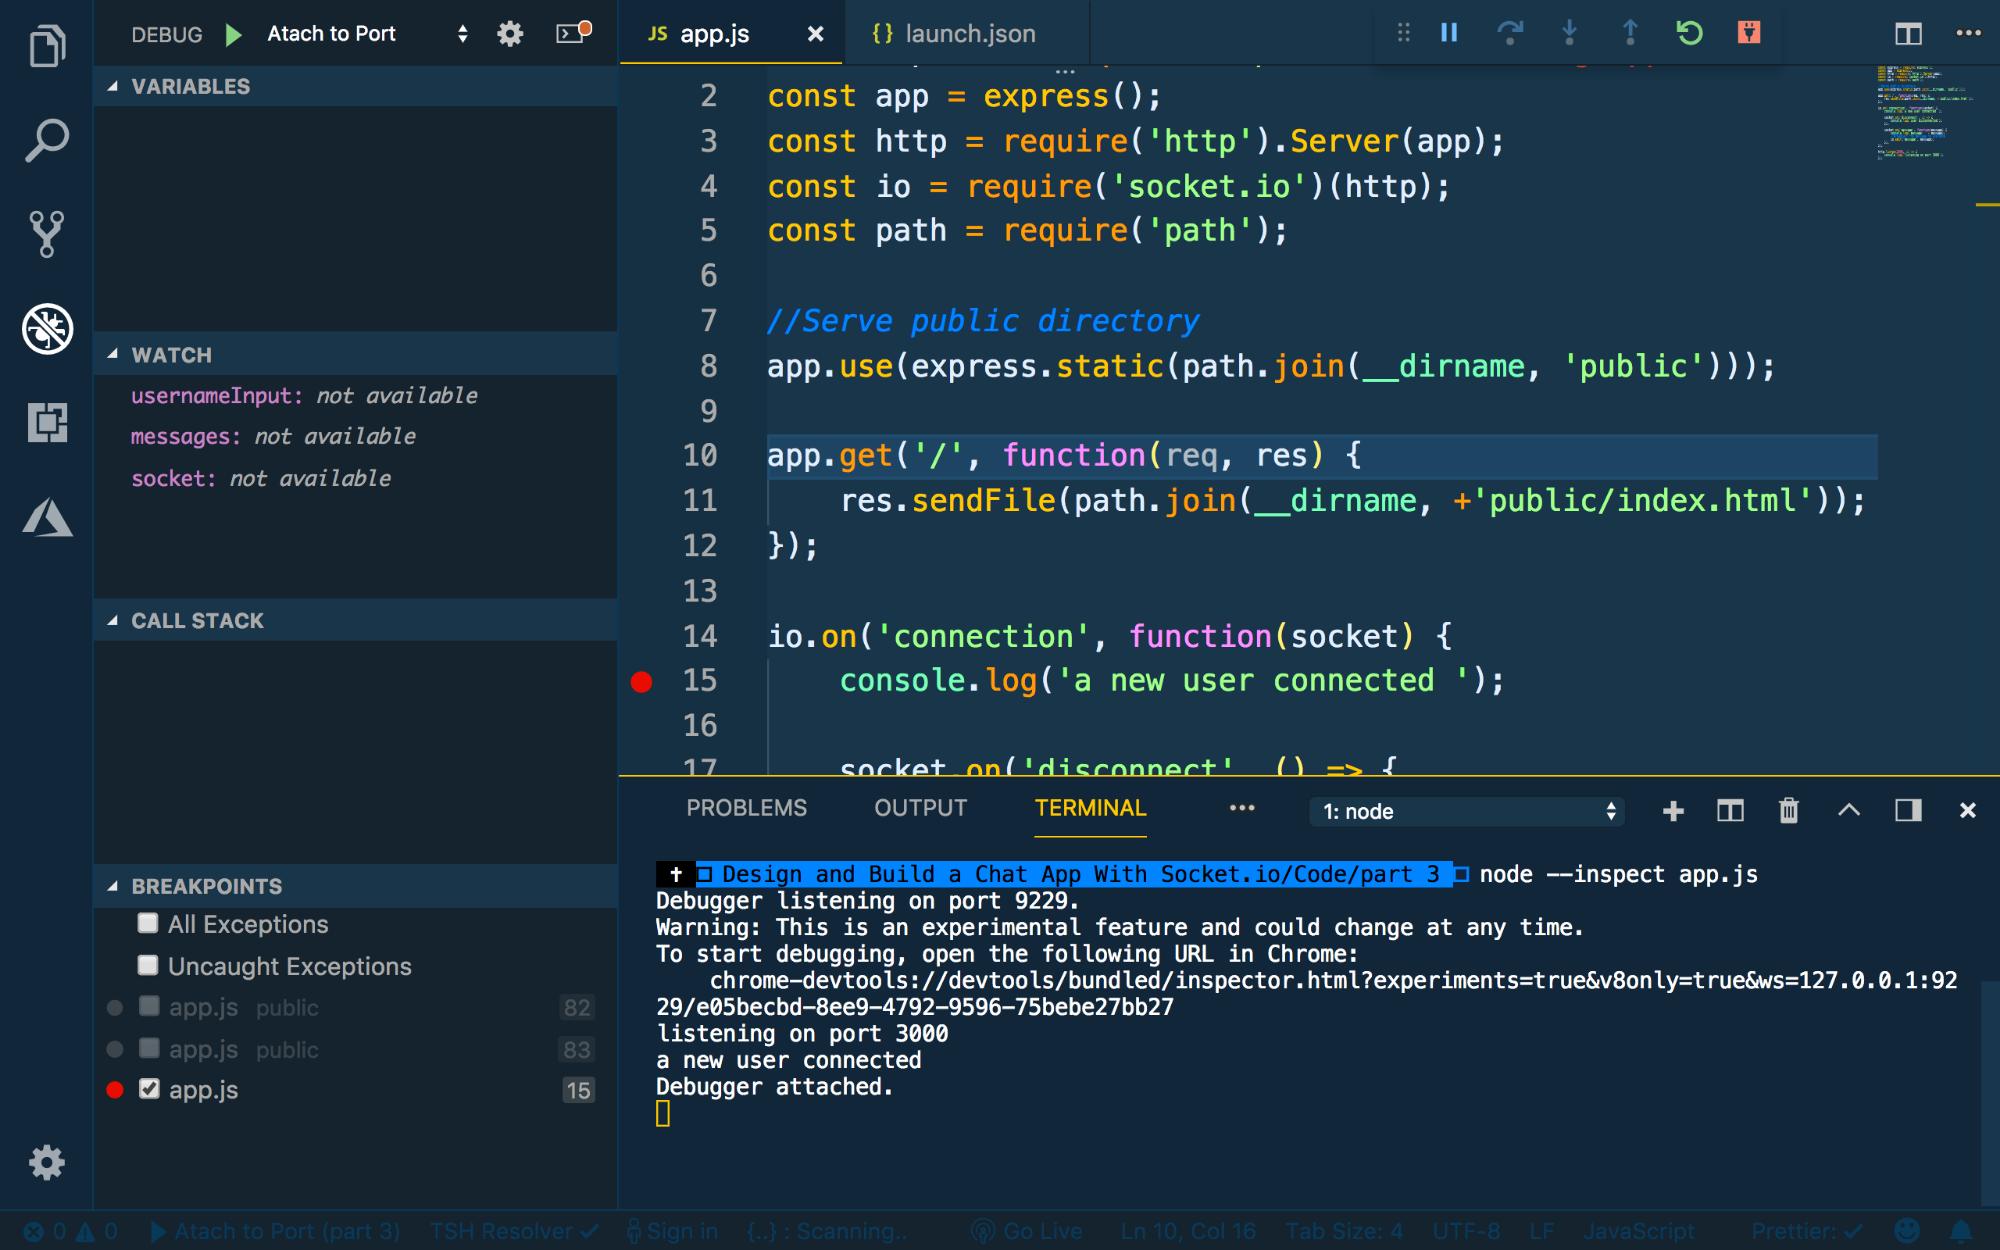
By specifying a port, localRoot, and remoteRoot it is also possible to debug by attaching over a network connection to a remote machine.
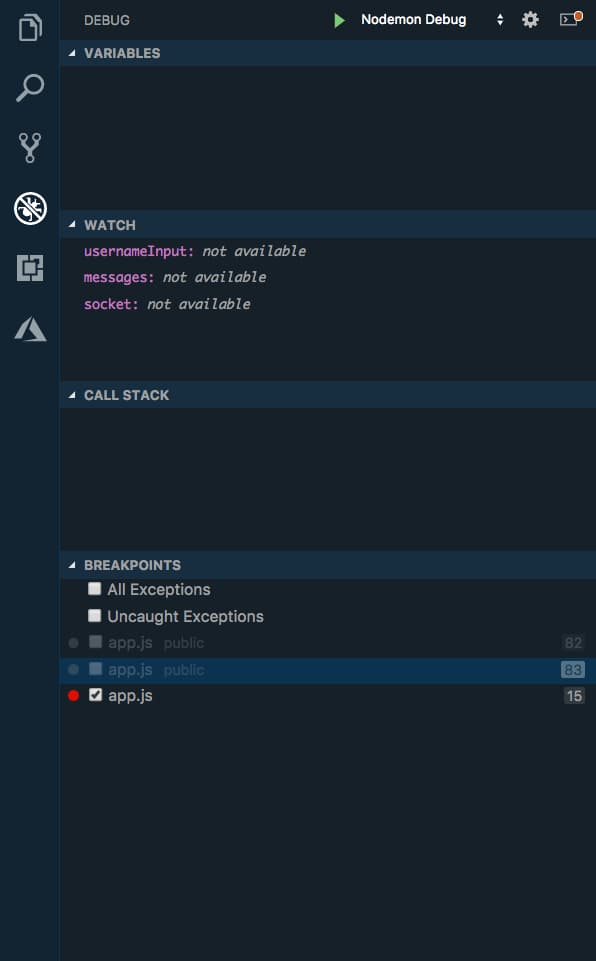
Step 7 — Debugging with Attach to Port with Nodemon
For our final configuration, we are going to tweak the previous one to support auto-reloading with Nodemon. Nodemon is a package, typically installed globally from npm, that will auto-reload your Node server as you save your files. This makes it much easier to make changes and test at the same time.
{
  "type": "node",
  "request": "attach",
  "name": "Nodemon Debug",
  "port": 9229,
  "restart": true
},
Note: Modern versions of VS Code support a runtimeExecutable parameter which can be used for a different ‘Node.js Nodemon Setup’ configuration.
To install Nodemon, use the following command:
- npm install -g nodemon
Because Nodemon will auto-restart our server, we’ve set the restart property to true in the debug configuration. This way, our debugger will reconnect when our server restarts. To test this out, run your server using this command (replacing node, from earlier, with nodemon):
- nodemon --inspect app.js
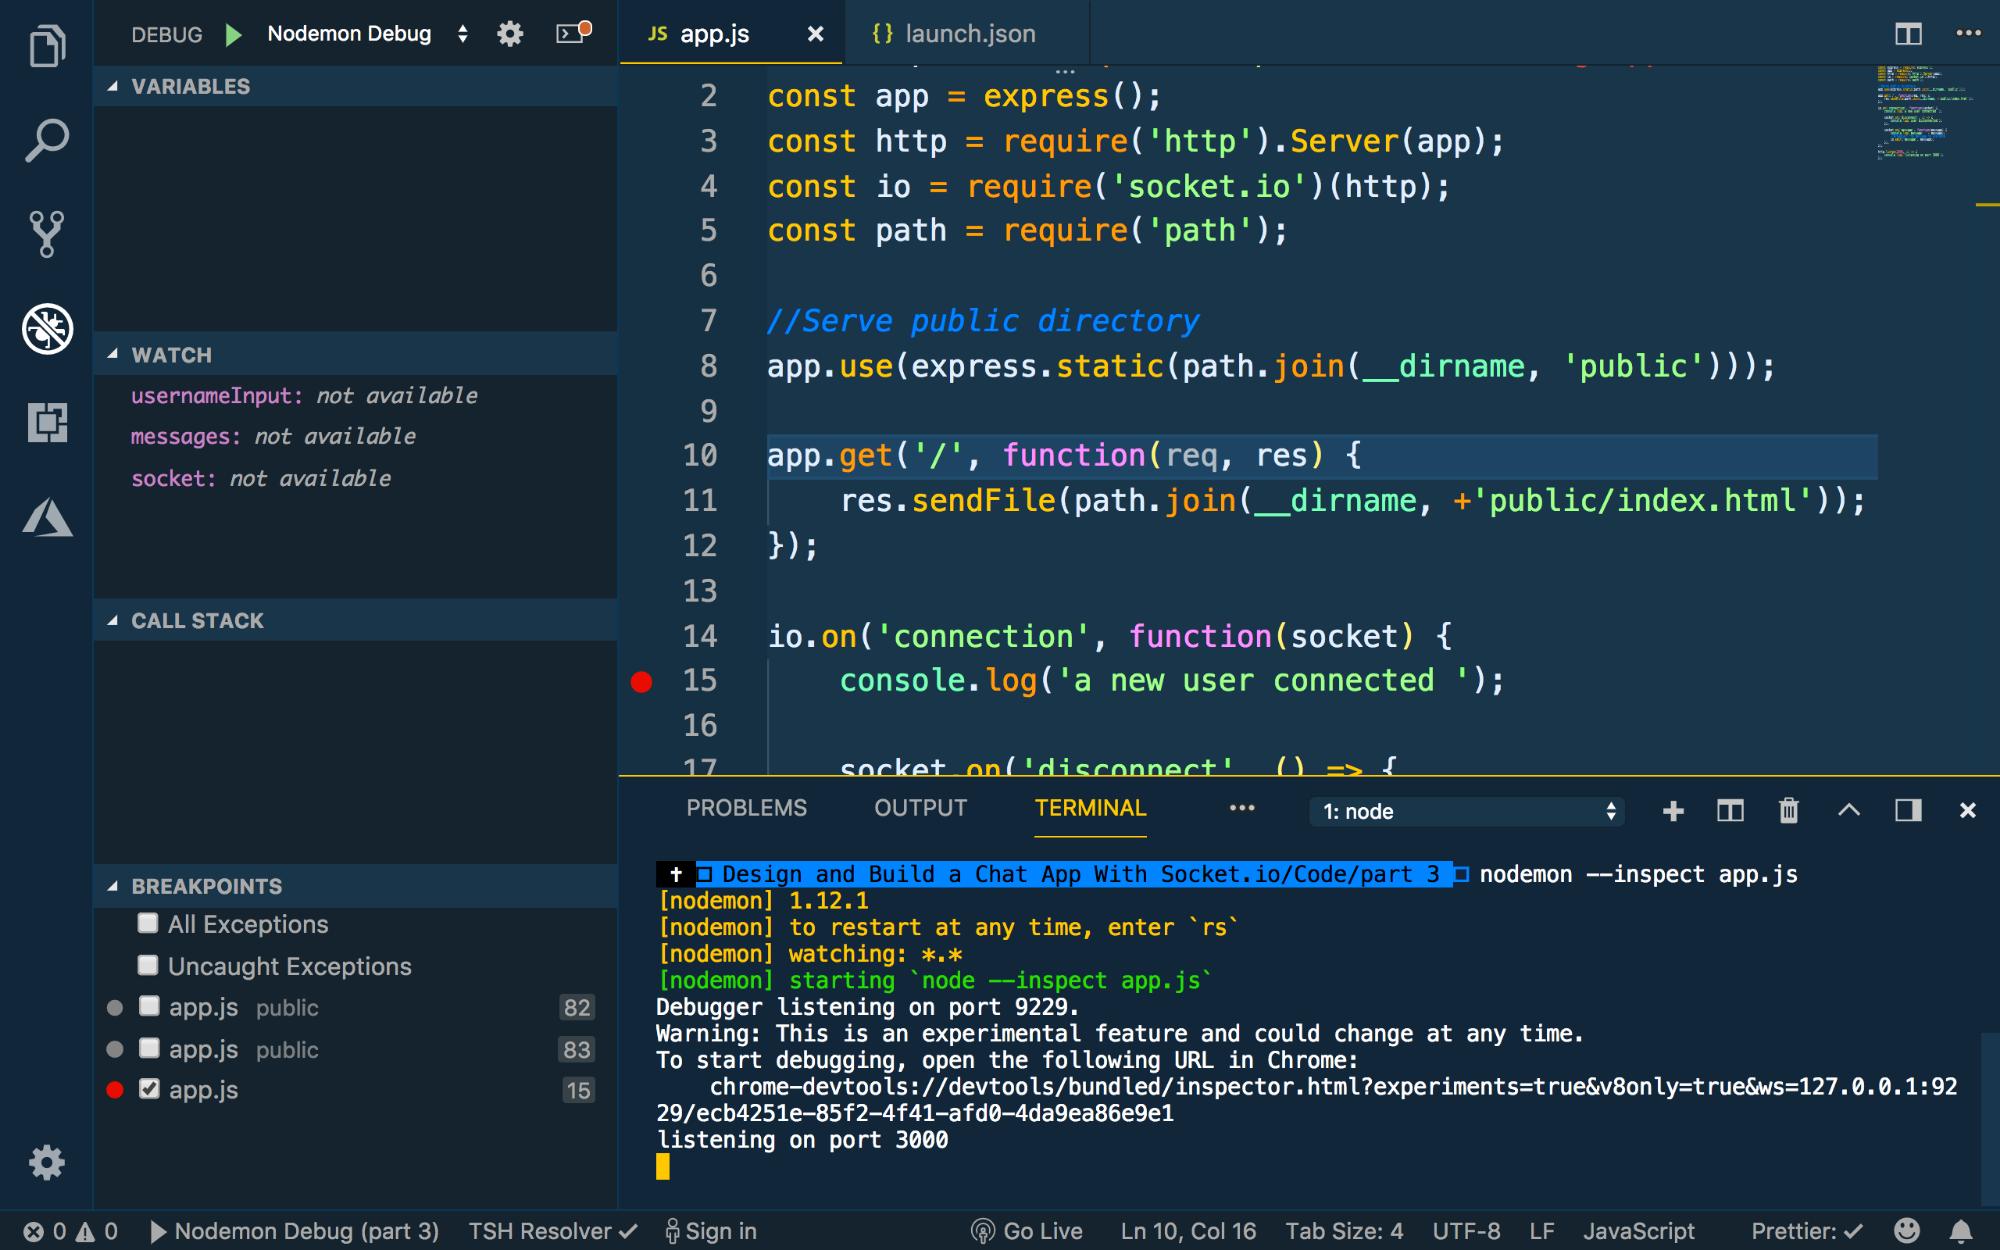
Then, run your configuration:
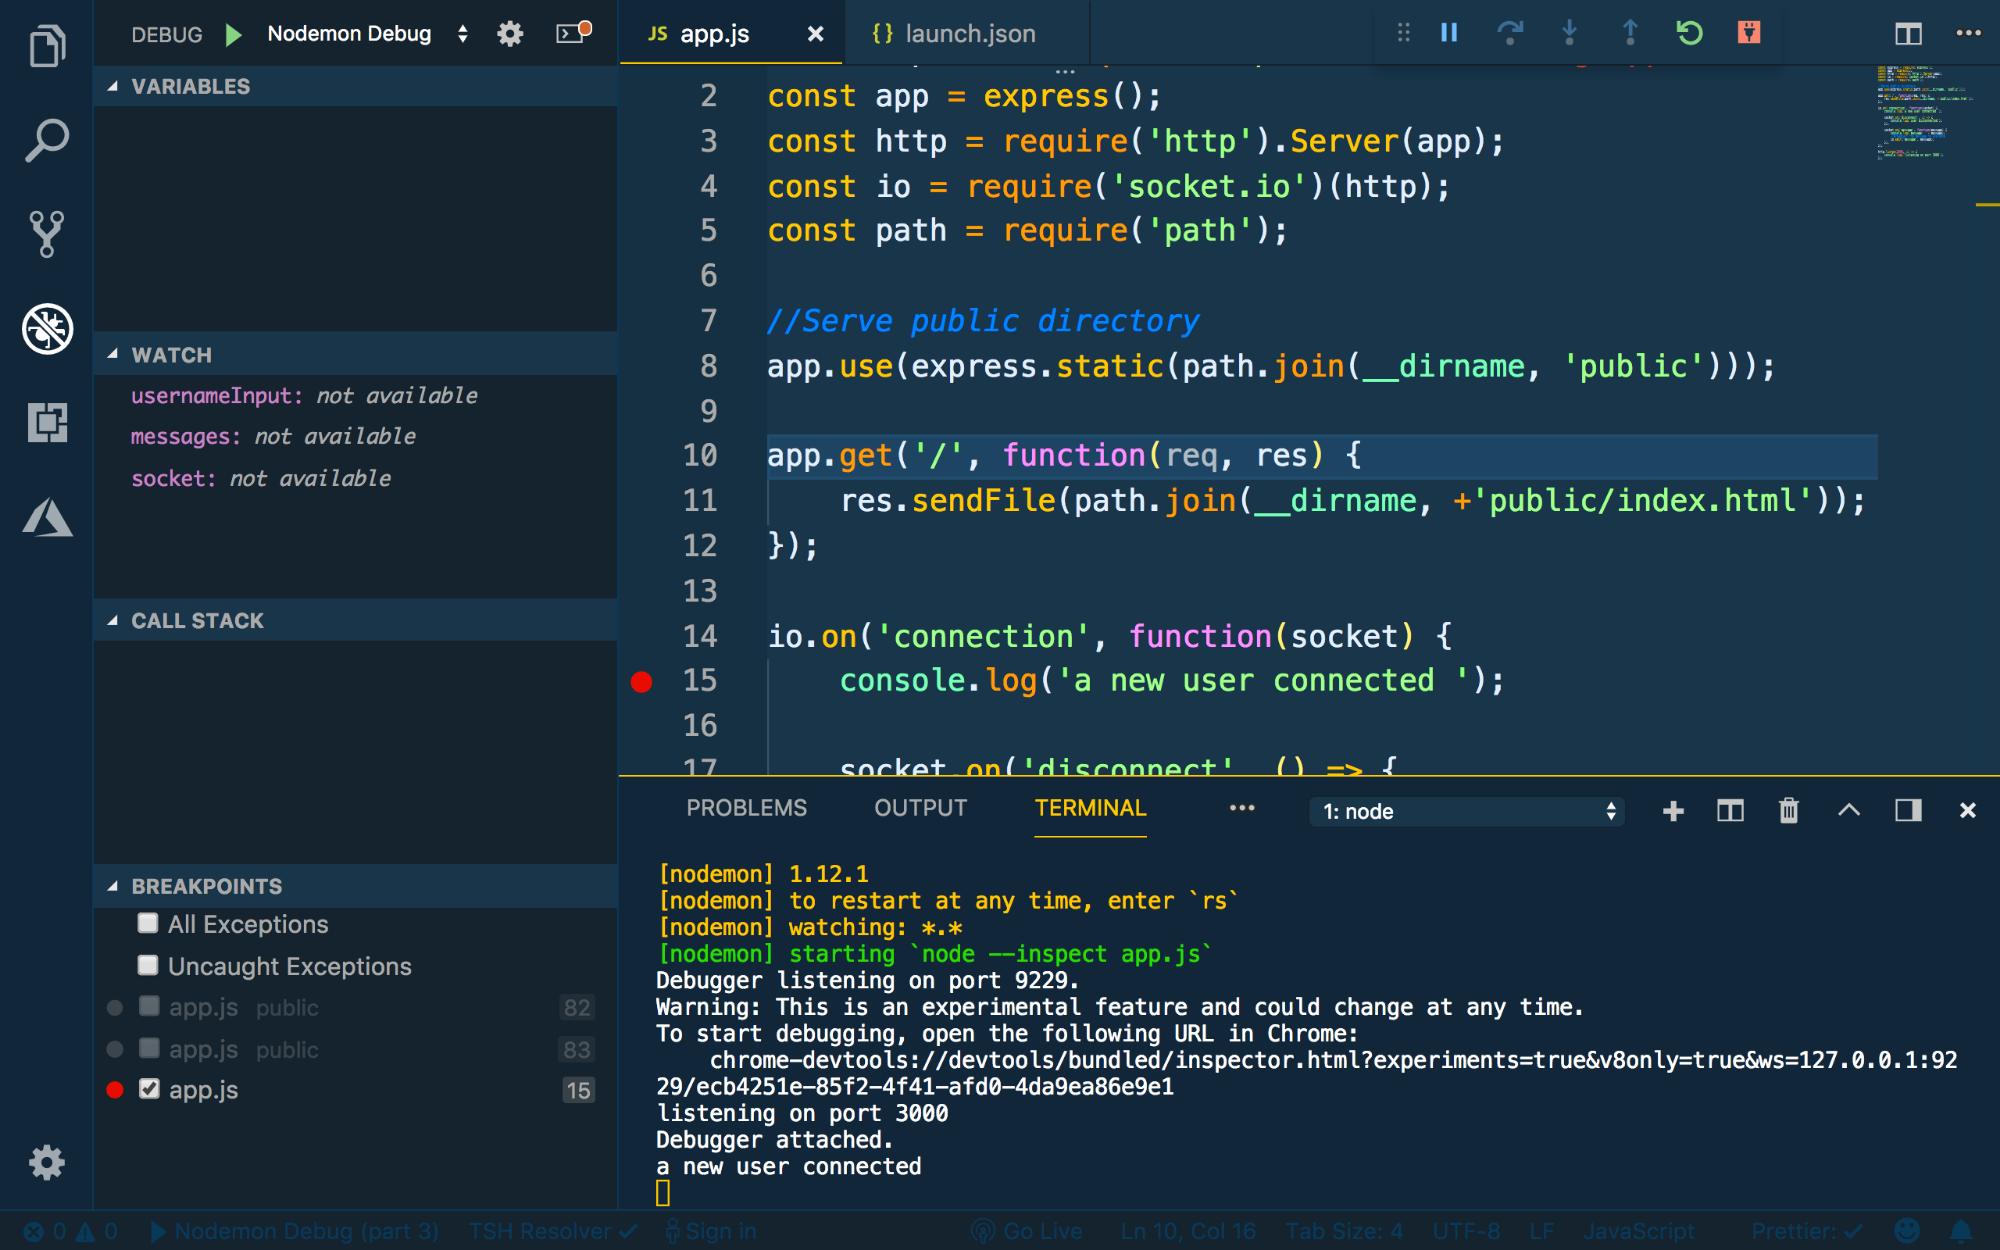
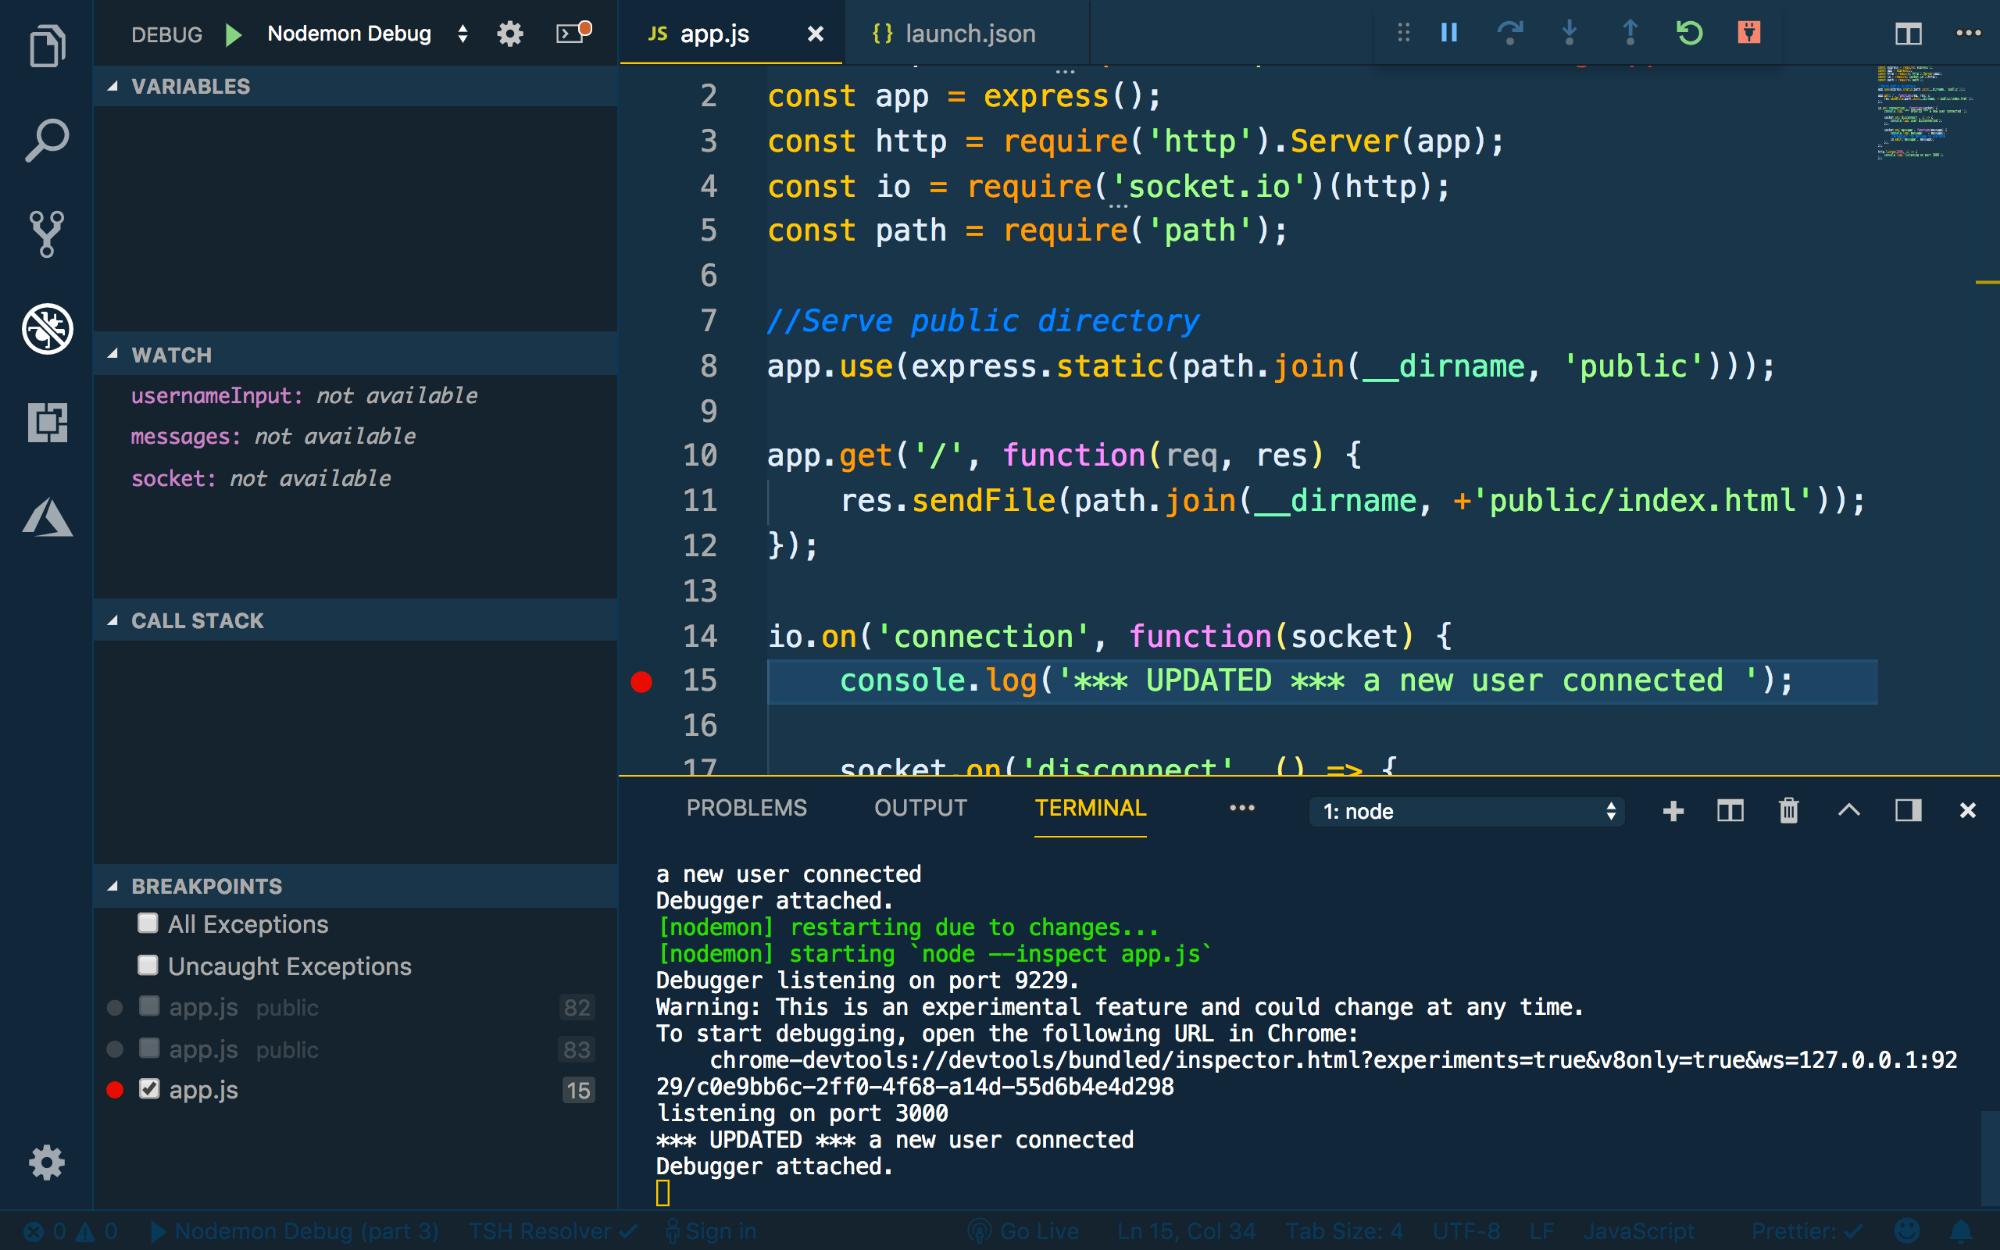
Since we are using Nodemon, if we make a change to our server file and save it, our server will automatically be reloaded. We’ve defined our debug configuration to handle this scenario and reconnect as well. Make a small change to your file, save it, and make sure that your debugger reconnects when the server restarts.
Conclusion
In this tutorial, you set up VS Code to debug Node.js code. You now have appropriate configurations to start debugging.
To learn more about Node.js, see our How To Code in Node series.
Thanks for learning with the DigitalOcean Community. Check out our offerings for compute, storage, networking, and managed databases.
About the author
Still looking for an answer?
This textbox defaults to using Markdown to format your answer.
You can type !ref in this text area to quickly search our full set of tutorials, documentation & marketplace offerings and insert the link!
 This work is licensed under a Creative Commons Attribution-NonCommercial- ShareAlike 4.0 International License.
Become a contributor for community
Get paid to write technical tutorials and select a tech-focused charity to receive a matching donation.

DigitalOcean Documentation
Full documentation for every DigitalOcean product.

Resources for startups and AI-native businesses
The Wave has everything you need to know about building a business, from raising funding to marketing your product.
The developer cloud
Scale up as you grow — whether you're running one virtual machine or ten thousand.

Start building today
From GPU-powered inference and Kubernetes to managed databases and storage, get everything you need to build, scale, and deploy intelligent applications.
