By Ethan Tola and Lisa Tagliaferri

Introduction
Textual data exists in many different forms, from journalism to social media to emails. When we analyze and visualize textual data we can bring to light general trends that can change the way we interpret the text.
In this tutorial, we will be exploring graphing word frequency in a text corpus. The program we will be creating will search through a plain text document and organize each unique word with its frequency. We will then graph the data we found using matplotlib.
Prerequisites
To be able to use this tutorial, make sure you have the following prerequisites:
-
You should have Python 3 and a programming environment already installed on your local computer or server.
-
To get the most out of this guide, you should be familiar with Python 3 and about the dictionary data type in particular.
Finally, make sure you follow Step 1 — importing matplotlib of our How to Plot Data in Python 3 Using matplotlib as it is essential to have matplotlib installed for this project.
Step 1 — Setting Up the Program File
Now that we have matplotlib installed on our computer, we can begin to create our project.
Using a text editor of your choice, create a new Python file and call it word_freq.py. This will be our main file.
In this program, we will import matplotlib and the class that we need (which is pyplot), passing it the plt alias. This essentially declares plt as a global variable that will be used throughout our script.
import matplotlib.pyplot as plt
Next, we’ll import some default packages in Python. These will be used to set up and take in command-line inputs. The important package to note is argparse. This is what we will be using to grab information from the command line and include help text for the user.
Let’s import the following default packages in Python:
import matplotlib.pyplot as plt
import sys
import operator
import argparse
Lastly, create the standard main method and call. Inside the main method is where we will write most of our code.
import matplotlib.pyplot as plt
import sys
import operator
import argparse


def main():

if __name__ == "__main__":
  main()
Now that we’ve imported everything and set up the skeleton for our project, we can move on to using the packages we’ve imported.
Step 2 – Setting Up the Argument Parser
For this part, we will be creating the command-line arguments and storing them in a variable for quick access.
In our main method, let’s create our parser variable and assign it to the default constructor argparse provides. Then we will assign the expected argument for the word we will be looking for in the file. Lastly, we will assign the expected argument for the file in which the word is contained in. This will be a .txt file.
...
def main():
  parser = argparse.ArgumentParser()
  parser.add_argument(
      "word",
      help="the word to be searched for in the text file."
  )
  parser.add_argument(
      "filename",
      help="the path to the text file to be searched through"
  )

if __name__ == "__main__":
  main()
For now, the first argument in the method is the title of what we expect in the command-line. The second argument help= "..." is used to provide the user with some information about what the command-line argument should be.
Next, we’ll save the given arguments into another variable we will call args.
...
def main():
  parser = argparse.ArgumentParser()
  parser.add_argument(
      "word",
      help="the word to be searched for in the text file."
  )
  parser.add_argument(
      "filename",
      help="the path to the text file to be searched through"
  )

  args = parser.parse_args()

if __name__ == "__main__":
  main()
For good measure, we should always check our inputs in case there is a typo in the command-line arguments. This is also to prevent our script from abruptly crashing. Let’s therefore handle errors through using a try statement.
...
def main():
	...
	args = parser.parser_args()

	try:
		open(args.filename)

	except FileNotFoundError:
		sys.stderr.write("Error: " + args.filename + " does not exist!")
		sys.exit(1)

if __name__ == "__main__":
  main()
We are using sys.exit(1) to indicate to the user that there was an issue with the code and it could not complete successfully.
Our project will now be able to take in command-line arguments. The next step is to parse our input file.
Step 3 — Parsing the File
In this step, we will be taking in a file, reading each word, logging how often they appear, and saving it all to a dictionary data type.
Let’s create a function named word_freq() that takes two command-line arguments (the word and the filename), and then call that function in main().
...
def main():
	...
	word_freq(args.word, args.filename)

def word_freq(word, filename):

if __name__ == "__main__":
  main()
The first step to parsing the file is to create a dictionary data type we will call doc. This will hold every word found in the file and keep track of how many times it has appeared.
...
def word_freq( word, filename ):
	doc = {}

if __name__ == "__main__":
  main()
The next step would be to iterate through the given file. This is done using a nested for loop.
The first for loop is designed to open the file and take the first line from it. Then it takes what is in each line and splits it based on a string of a whitespace character between words while storing words into an array.
The second for loop takes this array, and loops through it checking if it’s either in the dictionary or not. If it is, we add one count to it. If it isn’t, then we create a new entry and initialize it as 1.
...
def word_freq(word, filename):
	doc = {}

	for line in open(filename):
		split = line.split(' ')
		for entry in split:
			if (doc.__contains__(entry)):
				doc[entry] = int(doc.get(entry)) + 1
			else:
				doc[entry] = 1

if __name__ == "__main__":
  main()
Now we are halfway through with the project.
To recap, our main() method should set up our command-line inputs and pass them to the word_freq() function. word_freq() should take the word and filename from the command-line and save each unique word found in the text file.
Next, we will take this data and organize it for use in our graph.
Step 4 — Storing and Sorting Data
Before we make the graph, we have to make sure the word is actually in the file we opened. We can do this with an if conditional statement.
...
def word_freq(word, filename):
	...
      else:
          doc[entry] = 1
	if (not word in doc):
		sys.stderr.write("Error: " + word + " does not appear in " + filename)
		sys.exit(1)

if __name__ == "__main__":
  main()
Now that we know the word is in the file, we can begin to set up the data for our graph.
First we have to start with sorting our dictionary data type from highest to least in occurrence and initializing variables for later use. We have to sort our dictionary so that it is appropriately visualized on the graph.
...
def word_freq(word, filename):
	...
	if (not word in doc):
		sys.stderr.write("Error: " + word + " does not appear in " + filename)
		sys.exit(1)

	sorted_doc = (sorted(doc.items(), key = operator.itemgetter(1)))[::-1]
	just_the_occur = []
	just_the_rank = []
	word_rank = 0
	word_frequency = 0

if __name__ == "__main__":
  main()
The two variables to note are just_the_occur which is the data that will hold how many times a word has appeared. The other variable is just_the_rank which is the variable that will hold the data regarding the rank of the word.
Now that we have the sorted dictionary, we’ll loop through it to both find our word and its rank as well as populate our graph with this data.
...
def word_freq( word, filename ):
	...

  sortedDoc = (sorted(doc.items(), key = operator.itemgetter(1)))[::-1]
  just_the_occur = []
  just_the_rank = []
  word_rank = 0
  word_frequency = 0

	entry_num = 1
	for entry in sorted_doc:
		if (entry[0] == word):
			word_rank = entryNum
			word_frequency = entry[1]

		just_the_rank.append(entry_num)
		entry_num += 1
		just_the_occur.append(entry[1])

if __name__ == "__main__":
  main()
Here we have to make sure that both variables just_the_occur and just_the_rank are the same length otherwise matplotlib will not let us create the graph.
We also added an if statement in the loop to find our word (which we already know is there) and pull out its rank and frequency.
Now we have everything we need to create our graph. Our next step is to finally create it.
Step 5 — Creating the Graph
At this point we can plug in the plt variable we created in the beginning. To create our graph, we need a title, y axis label, x axis label, a scale, and a graph type.
In our case, we will be creating a log base 10 graph to organize our data. The title and axes labels can be anything you want them to be but the more descriptive the better it will be for people who are looking at your graph.
...
def word_freq( word, filename ):
	...
  just_the_rank.append(entry_num)
  entry_num += 1
  just_the_occur.append(entry[1])

  plt.title("Word Frequencies in " + filename)
  plt.ylabel("Total Number of Occurrences")
  plt.xlabel("Rank of word(\"" + word + "\" is rank " + str(word_rank) + ")")
  plt.loglog(
    just_the_rank,
    just_the_occur,
    basex=10
  )
  plt.scatter(
    [word_rank],
    [word_frequency],
    color="orange",
    marker="*",
    s=100,
    label=word
  )
  plt.show()

if __name__ == "__main__":
  main()
The title, plt.ylabel(), and plt.xlabel() functions are labels for each axis.
The plt.loglog() function takes just_the_rank and just_the_occur for the x and y axis respectively.
We change the log base and set it to 10.
Then, we set the plot to scatter and highlight our point. We made it an orange star, with size 100 so it’s pronounced. Finally, we labeled it with our word.
Once everything is completed for our graph, we tell it to be displayed with plt.show().
Now that our code is finally complete, we can test run it.
Step 6 — Running the Program
For our text sample, we’ll need a text file to read from, so let’s download one from Project Gutenberg, a volunteer project that provides free eBooks (mostly in the public domain) to readers.
Let’s save the text of the novel A Tale of Two Cities by Charles Dickens as a file called cities.txt with curl into our current directory that holds our Python script:
- curl http://www.gutenberg.org/files/98/98-0.txt --output cities.txt
Next, let’s run our code passing the parameters of the word of our choice (we’ll use “fish”) and the name of the text file:
- python word_freq.py fish cities.txt
If everything worked correctly, you should see this:
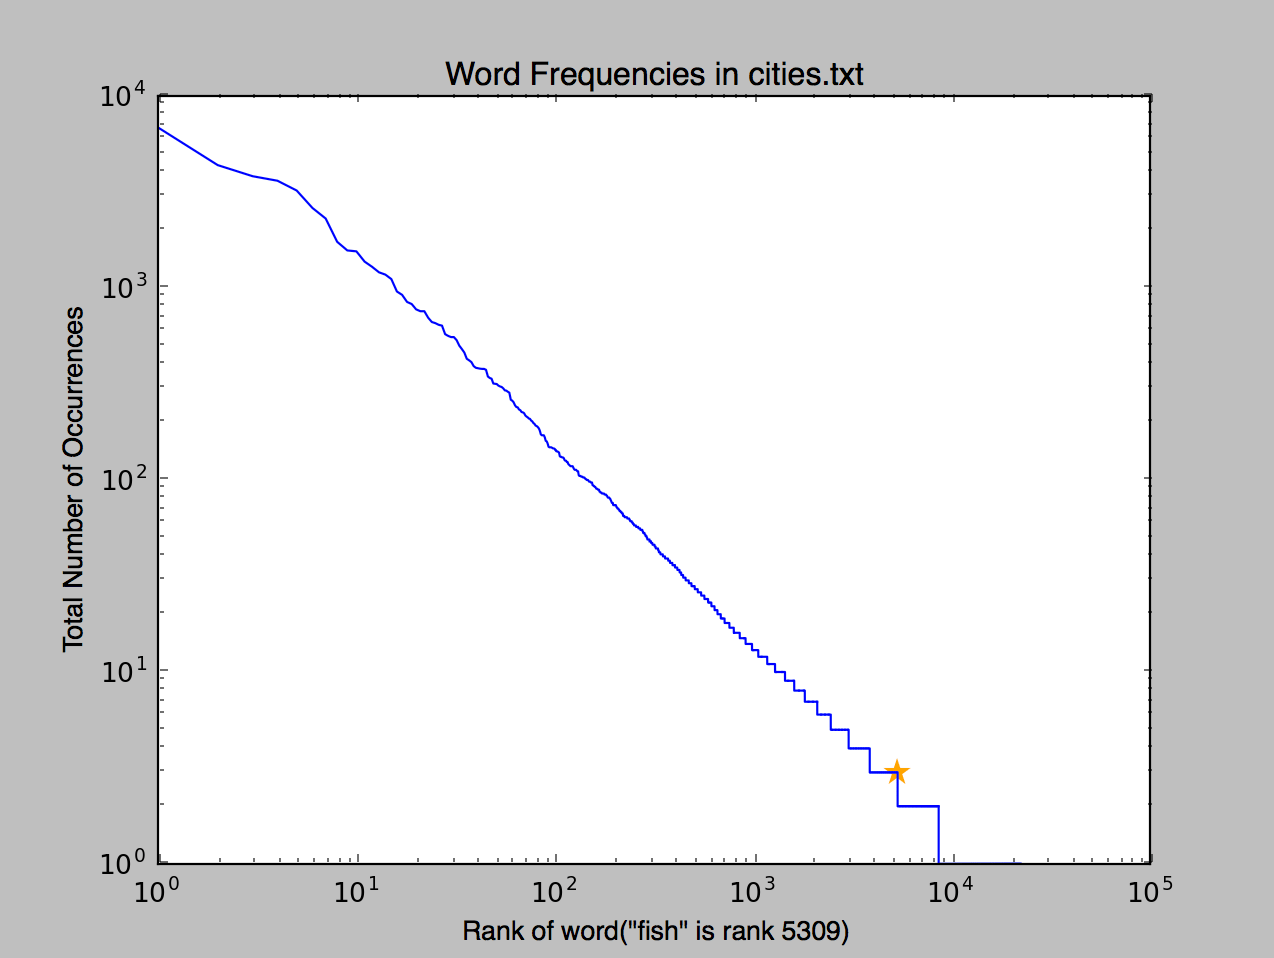
We see the ranking of the word “fish” is 5309, and a visualization of the occurrences.
Now, you can continue to experiment with different words and different text files. You can learn more about working with text files by reading our How To Handle Plain Text Files in Python 3 tutorial.
Finished Code and Code Improvements
At this point you should have a fully functioning program that will determine word frequency of a given word within a .txt file.
Below is our completed code for this project.
import matplotlib.pyplot as plt
import sys
import operator
import argparse


def main():
    parser = argparse.ArgumentParser()
    parser.add_argument(
        "word",
        help="the word to be searched for in the text file."
    )
    parser.add_argument(
        "filename",
        help="the path to the text file to be searched through"
    )

    args = parser.parse_args()

    try:
        open(args.filename)
    except FileNotFoundError:

        # Custom error print
        sys.stderr.write("Error: " + args.filename + " does not exist!")
        sys.exit(1)

    word_freq(args.word, args.filename)


def word_freq(word, filename):
    doc = {}

    for line in open(filename):

        # Assume each word is separated by a space
        split = line.split(' ')
        for entry in split:
            if (doc.__contains__(entry)):
                doc[entry] = int(doc.get(entry)) + 1
            else:
                doc[entry] = 1

    if (word not in doc):
        sys.stderr.write("Error: " + word + " does not appear in " + filename)
        sys.exit(1)

    sorted_doc = (sorted(doc.items(), key=operator.itemgetter(1)))[::-1]
    just_the_occur = []
    just_the_rank = []
    word_rank = 0
    word_frequency = 0

    entry_num = 1
    for entry in sorted_doc:

        if (entry[0] == word):
            word_rank = entry_num
            word_frequency = entry[1]

        just_the_rank.append(entry_num)
        entry_num += 1
        just_the_occur.append(entry[1])

    plt.title("Word Frequencies in " + filename)
    plt.ylabel("Total Number of Occurrences")
    plt.xlabel("Rank of word(\"" + word + "\" is rank " + str(word_rank) + ")")
    plt.loglog(just_the_rank, just_the_occur, basex=10)
    plt.scatter(
        [word_rank],
        [word_frequency],
        color="orange",
        marker="*",
        s=100,
        label=word
    )
    plt.show()

if __name__ == "__main__":
    main()
Now that everything is done, there are some potential improvements and modifications we can do to this code.
If we wanted to compare the frequency of two words, then we would add an additional word position in our command-line arguments. To accomplish this, we would have to add another checker for the word and more variables for the words.
We can also modify the program so that it compares how long each word is to another. To do this, we would compare the words by length and save each unique length into the dictionary.
Conclusion
We just created a program to read through a text file and organize the data to see the frequency of a specific word compared to the others within a text.
If you are interested in data visualization, you can also look at our How To Make a Bar Chart with JavaScript and the D3 Library tutorial.
Thanks for learning with the DigitalOcean Community. Check out our offerings for compute, storage, networking, and managed databases.
About the author(s)
Community and Developer Education expert. Former Senior Manager, Community at DigitalOcean. Focused on topics including Ubuntu 22.04, Ubuntu 20.04, Python, Django, and more.
Still looking for an answer?
This textbox defaults to using Markdown to format your answer.
You can type !ref in this text area to quickly search our full set of tutorials, documentation & marketplace offerings and insert the link!
Thanks Lisa for a great tutorial. I learnt a lot.
entryNum in your tutorial code is corrected to entry_num in your complete code.
And because I didn’t understand how ArgumentParser works, and I wanted to use my own file, it took me a while to figure out I needed to pass the arguments in my command line. It fails in the Eclipse IDE.
Maybe an explanation of: sorted_doc = (sorted(doc.items(), key=operator.itemgetter(1)))[::-1] would help others too. But I’m sure there is plenty of information on the sorted() function available.
This is a really great idea but I couldn’t get it to work.
Kept getting error : the following arguments are required: word, filename
Tried reading in the file other ways but still no joy. Perhaps you could have some better explanation as to how the Argument Parser works and how the file is being read? Otherwise your instructions were pretty clear.
 This work is licensed under a Creative Commons Attribution-NonCommercial- ShareAlike 4.0 International License.
Become a contributor for community
Get paid to write technical tutorials and select a tech-focused charity to receive a matching donation.

DigitalOcean Documentation
Full documentation for every DigitalOcean product.

Resources for startups and AI-native businesses
The Wave has everything you need to know about building a business, from raising funding to marketing your product.
The developer cloud
Scale up as you grow — whether you're running one virtual machine or ten thousand.

Start building today
From GPU-powered inference and Kubernetes to managed databases and storage, get everything you need to build, scale, and deploy intelligent applications.
