By Piotr Gaczkowski and Matt Abrams

The author selected the COVID-19 Relief Fund to receive a donation as part of the Write for DOnations program.
Introduction
Kubernetes and the microservice architectures that it enables can create very efficient and scalable systems. But problems arise when one of these microservices develops performance problems. Typically, we first notice that response times from our customer-facing services are getting longer and longer. The problem might be with one of the backend services, or perhaps a database that is beyond its optimal capacity. To discover the root of our problem, we need to implement distributed tracing.
Jaeger is a distributed tracing solution and a graduate of the Cloud Native Computing Foundation’s Incubation Project. It features a pleasant UI for visualizing traces, Jaeger sidecars for collecting traces, and several other components. Distributed tracing systems like Jaeger let us trace the lifecycle of each customer-generated event and see how each service processes that event.
In this tutorial, we will deploy a very small distributed application to a Kubernetes cluster and simulate a performance lag using a sleep function in our code. To find the root cause of this issue and to trace each event, we will use Jaeger. With tracing enabled, we’ll see how effective it is at observing the behavior of Services and pinpointing issues.
If you’re looking for a managed Kubernetes hosting service, check out our simple, managed Kubernetes service built for growth.
Prerequisites
Before you begin, you will need the following tools and accounts:
- A Kubernetes 1.15+ cluster with your connection configuration set as the
kubectldefault. To create a Kubernetes cluster on DigitalOcean, read our Kubernetes Quickstart. To connect to the cluster, read How to Connect to a DigitalOcean Kubernetes Cluster. - Docker installed. Follow our tutorial on How To Install and Use Docker for instructions. Docker’s website provides installation instructions for other operating systems like macOS and Windows.
- An account at Docker Hub for storing your Docker image.
- The
kubectlcommand-line tool installed on your local machine and configured to connect to your cluster. You can read more about installingkubectlin the official documentation, or follow this tutorial on getting started with Kubernetes: AkubectlCheat Sheet. - The
curlcommand-line utility installed on your local machine. You can installcurlusing the package manager built into your operating system.
Step 1 — Building the Sample Application
In order to test Jaeger’s tracing abilities, we will build and deploy a sample application, sammy-jaeger, which uses two services: one for the frontend and one for the backend. We will build both using Python and the Flask microframework.
Our application will be a hit counter whose value increases every time we call the frontend. To simulate performance issues, we will code a randomized sleep function that executes whenever the frontend sends a GET request to the backend. In this step, we will build and deploy that application. In the following steps, we will deploy the app to Kubernetes, install Jaeger, and then use it to trace our service issue.
First, let’s create a project directory structure and navigate inside:
- mkdir -p ./sammy-jaeger/frontend ./sammy-jaeger/backend && cd ./sammy-jaeger
We now have a root directory, sammy-jaeger, and two subdirectories:
output.
├── backend
└── frontend
We also changed into the root directory, /sammy-jaeger. We will run all remaining commands from here.
Let’s start building the frontend application.
Building the Frontend Application
Using your preferred text editor, create and open a new file called frontend.py in ./frontend:
nano ./frontend/frontend.py
Add the following code. This will import Flask, build our counter functions, and define one route for HTTP requests:
import os
import requests
from flask import Flask
app = Flask(__name__)

def get_counter(counter_endpoint):
    counter_response = requests.get(counter_endpoint)
    return counter_response.text

def increase_counter(counter_endpoint):
    counter_response = requests.post(counter_endpoint)
    return counter_response.text

@app.route('/')
def hello_world():
    counter_service = os.environ.get('COUNTER_ENDPOINT', default="https://localhost:5000")
    counter_endpoint = f'{counter_service}/api/counter'
    counter = get_counter(counter_endpoint)

    increase_counter(counter_endpoint)

    return f"""Hello, World!

You're visitor number {counter} in here!\n\n"""
We are importing three modules. The os module will communicate with our operating system. The requests module is a library for sending HTTP requests. Flask is a microframework that will host our app.
We are then defining our get_counter() and increase_counter() functions, which both accept the parameter counter_endpoint. get_counter() will call the backend using the GET method to find the current counter state. increase_counter() will call the backend with the POST method to increment the counter.
We then define our route /, which will call another function called hello_world(). This function will retrieve a URL and a port for our backend pod, assign it to a variable, and then pass that variable to our first two functions, get_counter() and increase_counter(), which will send the GET and POST requests to the backend. The backend will then pause for a random period of time (our simulated lag) before incrementing the current counter number and then returning that number. Lastly, hello_world() will take this value and print a “Hello World!” string to our console that includes our new visitor count.
You might have noticed that we did not create a Python environment, nor did we install pip on our local machine. We will complete these steps when we containerize our application using Docker.
Save and close frontend.py.
Now we will build a Dockerfile for the frontend application. This Dockerfile will include all the necessary commands to build our containerized environment.
Create and open a new Dockerfile in ./frontend:
- nano ./frontend/Dockerfile
Add the following content:
FROM alpine:3.8

RUN apk add --no-cache py3-pip python3 && \
    pip3 install flask requests

COPY . /usr/src/frontend

ENV FLASK_APP frontend.py

WORKDIR /usr/src/frontend

CMD flask run --host=0.0.0.0 --port=8000
In this Dockerfile, we instruct our image to build from the base Alpine Linux image. We then install Python3, pip, and several additional dependencies. Next, we copy the application source code, set an environment variable pointing to the main application code, set the working directory, and write a command to run Flask whenever we create a container from the image.
Save and close the file.
Now let’s build the Docker image for our frontend application and push it to a repository in Docker Hub.
First, check that you are signed in to Docker Hub:
- docker login --username=your_username --password=your_password
Build the image:
- docker build -t your_username/do-visit-counter-frontend:v1 ./frontend
Now push the image to Docker Hub:
- docker push your_username/do-visit-counter-frontend:v1
Our frontend application is now built and available in Docker Hub. Before we deploy it to Kubernetes, however, let’s code and build our backend application.
Building the Backend Application
The backend application requires the same steps that the frontend required.
First, create and open a file called backend.py in ./backend:
- nano ./backend/backend.py
Add the following content, which will define two functions and another route:
from random import randint
from time import sleep

from flask import request
from flask import Flask
app = Flask(__name__)

counter_value = 1

def get_counter():
    return str(counter_value)

def increase_counter():
    global counter_value
    int(counter_value)
    sleep(randint(1,10))
    counter_value += 1
    return str(counter_value)

@app.route('/api/counter', methods=['GET', 'POST'])
def counter():
    if request.method == 'GET':
        return get_counter()
    elif request.method == 'POST':
        return increase_counter()
We are importing several modules, including random and sleep. We are then setting our counter value to 1 and defining two functions. The first, get_counter, returns the current counter value, which is stored as counter_value. The second function, increase_counter, performs two actions. It increments our counter value by 1 and it uses the sleep module to delay the function’s completion by a random amount of time.
The backend also has one route (/api/counter) that accepts two methods: POST and GET.
When we call this route using the GET method, it calls get_counter() and returns our counter value. When we call this route using the POST method, it calls increase_counter() and increases the value of the counter while waiting a random amount of time.
Save and close the file.
Our backend application will also require its own Dockerfile, which is almost identical to the frontend’s version.
Create and open a second Dockerfile in ./backend:
- nano ./backend/Dockerfile
Add the following content. The one major difference here, besides filepaths, will be the port:
FROM alpine:3.8

RUN apk add --no-cache py3-pip python3 && \
    pip3 install flask

COPY . /usr/src/backend

ENV FLASK_APP backend.py

WORKDIR /usr/src/backend

CMD flask run --host=0.0.0.0 --port=5000
Save and close the file.
Now build the image:
- docker build -t your_username/do-visit-counter-backend:v1 ./backend
Push it to Docker Hub:
- docker push your_username/do-visit-counter-backend:v1
With our application available on Docker Hub, we are now ready to deploy it to our cluster and test it in the next step.
Step 2 — Deploying and Testing the Application
Writing our code and publishing our containers was our first major step. Now we need to deploy to Kubernetes and test the basic application. After that, we can add Jaeger and explore the potential of distributed tracing.
Let’s get started with deployment and testing.
At this point, our directory tree looks like this:
.
├── backend
│   ├── Dockerfile
│   └── backend.py
└── frontend
    ├── Dockerfile
    └── frontend.py
To deploy this application to our cluster, we will also need two Kubernetes manifests; one for each half of the application.
Create and open a new manifest file in ./frontend:
- nano ./frontend/deploy_frontend.yaml
Add the following content. This manifest will specify how Kubernetes builds our Deployment (remember to replace the highlighted section with your Docker Hub username):
apiVersion: apps/v1
kind: Deployment
metadata:
  name: do-visit-counter-frontend
  labels:
    name: do-visit-counter-frontend
spec:
  replicas: 1
  selector:
    matchLabels:
      app: do-visit-counter-frontend
  template:
    metadata:
      labels:
        app: do-visit-counter-frontend
    spec:
      containers:
        - name: do-visit-counter-frontend
          image: your_dockerhub_username/do-visit-counter-frontend:v1
          imagePullPolicy: Always
          env:
            - name: COUNTER_ENDPOINT
              value: "http://do-visit-counter-backend.default.svc.cluster.local:5000"
          ports:
            - name: frontend-port
              containerPort: 8000
              protocol: TCP
We have specified Kubernetes to build a Deployment, to name it do-visit-counter-frontend, and to deploy one replica using our frontend image on Docker Hub. We have also configured an environment variable named COUNTER_ENDPOINT to link the two halves of our application.
Save and close the file.
Now create the manifest for our backend application in ./backend:
- nano ./backend/deploy_backend.yaml
Add the following content, again replacing the highlighted section with your Docker Hub username:
apiVersion: apps/v1
kind: Deployment
metadata:
  name: do-visit-counter-backend
  labels:
    name: do-visit-counter-backend
spec:
  replicas: 1
  selector:
    matchLabels:
      app: do-visit-counter-backend
  template:
    metadata:
      labels:
        app: do-visit-counter-backend
    spec:
      containers:
        - name: do-visit-counter-backend
          image: your_dockerhub_username/do-visit-counter-backend:v1
          imagePullPolicy: Always
          ports:
            - name: backend-port
              containerPort: 5000
              protocol: TCP
---
apiVersion: v1
kind: Service
metadata:
    name: do-visit-counter-backend
spec:
    selector:
        app: do-visit-counter-backend
    ports:
        - protocol: TCP
          port: 5000
          targetPort: 5000
In this manifest you are defining a Deployment and a Service for our backend. The Deployment describes how and what the container will run. Note that our port has changed from 8000 on the frontend to 5000 on the backend. The Service allows inter-cluster connections from the frontend to the backend.
Save and close the file.
Now let’s deploy our counter to the cluster using kubectl. Start with the frontend:
- kubectl apply -f ./frontend/deploy_frontend.yaml
And then deploy the backend:
- kubectl apply -f ./backend/deploy_backend.yaml
To verify that everything is working, call kubectl get pods:
- kubectl get pods
You will see an output like this:
OutputNAME                                         READY   STATUS    RESTARTS   AGE
do-visit-counter-backend-79f6964-prqpb       1/1     Running   0          3m
do-visit-counter-frontend-6985bdc8fd-92clz   1/1     Running   0          3m
We want all the pods in the READY state. If they are not yet ready, wait a few minutes and rerun the previous command.
Finally, we want to use our application. To do that, we will forward ports from the cluster and then communicate with the frontend using the curl command. Make sure to open a second terminal window because forwarding ports will block one window.
Use kubectl to forward the port:
- kubectl port-forward $(kubectl get pods -l=app="do-visit-counter-frontend" -o name) 8000:8000
Now, in a second terminal window, send three requests to your frontend application:
for i in 1 2 3; do curl localhost:8000; done
Each curl call will increment the visit number. You will see an output like this:
OutputHello, World!

You're visitor number 1 in here!

Hello, World!

You're visitor number 2 in here!

Hello, World!

You're visitor number 3 in here!
Our visitor counter is working properly, but you likely noticed a delay between each response. This is the result of our sleep function, which is simulating a performance lag.
With our distributed application ready, it’s time to install Jaeger and trace these events.
Step 3 — Deploying Jaeger
Collecting traces and visualizing them is Jaeger’s specialty. In this step, we will deploy Jaeger to our cluster so it can find our performance lags.
Jaeger’s official documentation includes commands for installing the Jaeger Operator. It also includes four additional manifests that you must deploy for the tool to work. Let’s do that now:
First, create the Custom Resource Definition required by the Jaeger Operator. We will use the recommended templates available on Jaeger’s official documentation:
- kubectl create -f https://raw.githubusercontent.com/jaegertracing/jaeger-operator/master/deploy/crds/jaegertracing.io_jaegers_crd.yaml
Next, create a Service Account, a Role, and Role Binding for Role-Based Access Control:
- kubectl create -f https://raw.githubusercontent.com/jaegertracing/jaeger-operator/master/deploy/service_account.yaml
- kubectl create -f https://raw.githubusercontent.com/jaegertracing/jaeger-operator/master/deploy/role.yaml
- kubectl create -f https://raw.githubusercontent.com/jaegertracing/jaeger-operator/master/deploy/role_binding.yaml
Finally, deploy the Jaeger Operator:
- kubectl create -f https://raw.githubusercontent.com/jaegertracing/jaeger-operator/master/deploy/operator.yaml
The Operator itself doesn’t mean we have Jaeger working. This is where the Custom Resource Definitions come into play. We need to create a resource describing the Jaeger instance we want the Operator to manage. Once again, we will follow the steps listed in Jaeger’s official documentation:
Use a heredoc to create this resource from the command line:
- kubectl apply -f - <<EOF
- apiVersion: jaegertracing.io/v1
- kind: Jaeger
- metadata:
- name: simplest
- EOF
Press ENTER to create the resource.
Now check your deployments again:
- kubectl get pods
You will see an output with your Jaeger operator and the simplest deployment:
OutputNAME                                                   READY   STATUS    RESTARTS   AGE
do-visit-counter-backend-79f6964-prqpb                 1/1     Running   0          3m
do-visit-counter-frontend-6985bdc8fd-92clz             1/1     Running   0          3m
jaeger-operator-547567dddb-rxsd2                       1/1     Running   0          73s
simplest-759cb7d586-q6x28                              1/1     Running   0          42s
To validate that Jaeger is working correctly, let’s forward its port and see if we can access the UI:
- kubectl port-forward $(kubectl get pods -l=app="jaeger" -o name) 16686:16686
Open a browser and navigate to http://localhost:16686. The Jaeger UI will load.
Both our application and Jaeger are working. In the next step, we will add instrumentation to let Jaeger collect data and find our performance lag.
Step 4 — Adding Instrumentation
Although Jaeger automates many tasks when used with Kubernetes, we still need to add instrumentation manually to our application. Fortunately, we have the Flask-OpenTracing module to handle that task.
OpenTracing is one of the standards of distributed tracing. It has been proposed by the authors of Jaeger with the aim to also support other tracing tools. It is vendor-neutral and supports many different programming languages and popular frameworks.
As is the case with all OpenTracing implementations, we need to modify our original applications by adding the Jaeger configuration and appending the tracing decorators to the endpoints that we want to trace.
Let’s add Flask-OpenTracing to our frontend code.
Reopen .frontend.py:
- nano ./frontend/frontend.py
Now add the following highlighted code, which will embed OpenTracing:
import os
import requests
from flask import Flask
from jaeger_client import Config
from flask_opentracing import FlaskTracing

app = Flask(__name__)
config = Config(
    config={
        'sampler':
        {'type': 'const',
         'param': 1},
                        'logging': True,
                        'reporter_batch_size': 1,},
                        service_name="service")
jaeger_tracer = config.initialize_tracer()
tracing = FlaskTracing(jaeger_tracer, True, app)

def get_counter(counter_endpoint):
    counter_response = requests.get(counter_endpoint)
    return counter_response.text

def increase_counter(counter_endpoint):
    counter_response = requests.post(counter_endpoint)
    return counter_response.text

@app.route('/')
def hello_world():
    counter_service = os.environ.get('COUNTER_ENDPOINT', default="https://localhost:5000")
    counter_endpoint = f'{counter_service}/api/counter'
    counter = get_counter(counter_endpoint)

    increase_counter(counter_endpoint)

    return f"""Hello, World!

You're visitor number {counter} in here!\n\n"""
Save and close the file. You can learn more about the Flask OpenTracing configurations on their GitHub page.
Now open your backend application code:
- nano ./backend/backend.py
Add the highlighted code. This is the same code that we placed in frontend.py:
from random import randint
from time import sleep

from flask import Flask
from flask import request
from jaeger_client import Config
from flask_opentracing import FlaskTracing


app = Flask(__name__)
config = Config(
    config={
        'sampler':
        {'type': 'const',
         'param': 1},
                        'logging': True,
                        'reporter_batch_size': 1,},
                        service_name="service")
jaeger_tracer = config.initialize_tracer()
tracing = FlaskTracing(jaeger_tracer, True, app)

counter_value = 1

def get_counter():
    return str(counter_value)

def increase_counter():
    global counter_value
    int(counter_value)
    sleep(randint(1,10))
    counter_value += 1
    return str(counter_value)

@app.route('/api/counter', methods=['GET', 'POST'])
def counter():
    if request.method == 'GET':
        return get_counter()
    elif request.method == 'POST':
        return increase_counter()
Save and close the file.
Since we’re adding additional libraries, we also have to modify our Dockerfiles for both services.
Open the Dockerfile for the frontend:
nano ./frontend/Dockerfile
Add the highlighted code:
FROM alpine:3.8

RUN apk add --no-cache py3-pip python3 && \
    pip3 install flask requests Flask-Opentracing jaeger-client

COPY . /usr/src/frontend

ENV FLASK_APP frontend.py

WORKDIR /usr/src/frontend

CMD flask run --host=0.0.0.0 --port=8000
Save and close the file.
Now open the backend’s Dockerfile:
- nano ./backend/Dockerfile
Add the highlighted code:
FROM alpine:3.8

RUN apk add --no-cache py3-pip python3 && \
    pip3 install flask Flask-Opentracing jaeger-client

COPY . /usr/src/backend

ENV FLASK_APP backend.py

WORKDIR /usr/src/backend

CMD flask run --host=0.0.0.0 --port=5000
With these changes, we want to rebuild and push the new versions of our containers.
Build and push the frontend application. Note the v2 tag at the end:
- docker build -t your_username/do-visit-counter-frontend:v2 ./frontend
- docker push your_username/do-visit-counter-frontend:v2
Now build and push the backend application:
- docker build -t your_username/do-visit-counter-backend:v2 ./backend
- docker push your_username/do-visit-counter-backend:v2
Our distributed tracing system requires one final piece: We want to inject Jaeger sidecars into our application pods to listen to traces from the pod and forward them to the Jaeger server. For that, we need to add an annotation to our manifests.
Open the manifest for the frontend:
- nano ./frontend/deploy_frontend.yaml
Add the highlighted code. Note that we are also replacing our image with the v2 version. Make sure to revise that line and add your Docker Hub username:
apiVersion: apps/v1
kind: Deployment
metadata:
  name: do-visit-counter-frontend
  labels:
    name: do-visit-counter-frontend
  annotations:
    "sidecar.jaegertracing.io/inject": "true"
spec:
  replicas: 1
  selector:
    matchLabels:
      app: do-visit-counter-frontend
  template:
    metadata:
      labels:
        app: do-visit-counter-frontend
    spec:
      containers:
        - name: do-visit-counter-frontend
             image: your_dockerhub_username/do-visit-counter-frontend:v2
          imagePullPolicy: Always
          env:
            - name: COUNTER_ENDPOINT
              value: "http://do-visit-counter-backend.default.svc.cluster.local:5000"
          ports:
            - name: frontend-port
              containerPort: 8000
              protocol: TCP
This annotation will inject a Jaeger sidecar into our pod.
Save and close the file.
Now open the manifest for the backend:
- nano ./backend/deploy_backend.yaml
Repeat the process, adding the highlighted lines to inject the Jaeger sidecar and updating your image tag:
apiVersion: apps/v1
kind: Deployment
metadata:
  name: do-visit-counter-backend
  labels:
    name: do-visit-counter-backend
  annotations:
    "sidecar.jaegertracing.io/inject": "true"
spec:
  replicas: 1
  selector:
    matchLabels:
      app: do-visit-counter-backend
  template:
    metadata:
      labels:
        app: do-visit-counter-backend
    spec:
      containers:
        - name: do-visit-counter-backend
             image: your_dockerhub_username/do-visit-counter-backend:v2
          imagePullPolicy: Always
          ports:
            - name: backend-port
              containerPort: 5000
              protocol: TCP
---
apiVersion: v1
kind: Service
metadata:
    name: do-visit-counter-backend
spec:
    selector:
        app: do-visit-counter-backend
    ports:
        - protocol: TCP
          port: 5000
          targetPort: 5000
With our new manifests in place, we need to apply them to the cluster and wait for the pods to create.
Let’s delete our old resources:
- kubectl delete -f ./frontend/deploy_frontend.yaml
- kubectl delete -f ./backend/deploy_backend.yaml
And then replace them:
- kubectl apply -f ./frontend/deploy_frontend.yaml
- kubectl apply -f ./backend/deploy_backend.yaml
This time the pods for our applications will consist of two containers: one for the application and a second for the Jaeger sidecar.
Use kubectl to check this:
- kubectl get pods
Our application pods now appear with 2/2 in the READY column:
OutputNAME                                                   READY   STATUS    RESTARTS   AGE
jaeger-operator-547567dddb-rxsd2                       1/1     Running   0          23m
simplest-759cb7d586-q6x28                              1/1     Running   0          22m
do-visit-counter-backend-694c7db576-jcsmv              2/2     Running   0          73s
do-visit-counter-frontend-6d7d47f955-lwdnf             2/2     Running   0          42s
With our sidecars and instrumentation in place, now we can rerun our program and investigate the traces in the Jaeger UI.
Step 5 — Investigating Traces in Jaeger
Now we can reap the benefits of tracing. The goal here is to see what call might be a performance issue by looking at the Jaeger UI. Of course, if we want to see some traces in the UI, we first have to generate some data by using our application.
Let’s set this up by opening a second and third terminal window. We will use two windows to port-forward Jaeger and our application and the third to send HTTP requests to the frontend from our machine via curl.
In the first window, forward the port for the frontend service:
- kubectl port-forward $(kubectl get pods -l=app="do-visit-counter-frontend" -o name) 8000:8000
In the second window, forward the port for Jaeger:
- kubectl port-forward $(kubectl get pods -l=app="jaeger" -o name) 16686:16686
In the third window, use curl in a loop to generate 10 HTTP requests:
for i in 0 1 2 3 4 5 6 7 8 9; do curl localhost:8000; done
You will receive an output like before:
OutputHello, World!

You're visitor number 1 in here!

Hello, World!

You're visitor number 2 in here!

. . .

Hello, World!

You're visitor number 10 in here!
This will give us enough different data points to compare them in the visualization.
Open a browser and navigate to http://localhost:16686. Set the Service dropdown menu to service and change limit results to 30. Press Find Traces.
The traces from our application will appear in the graph:
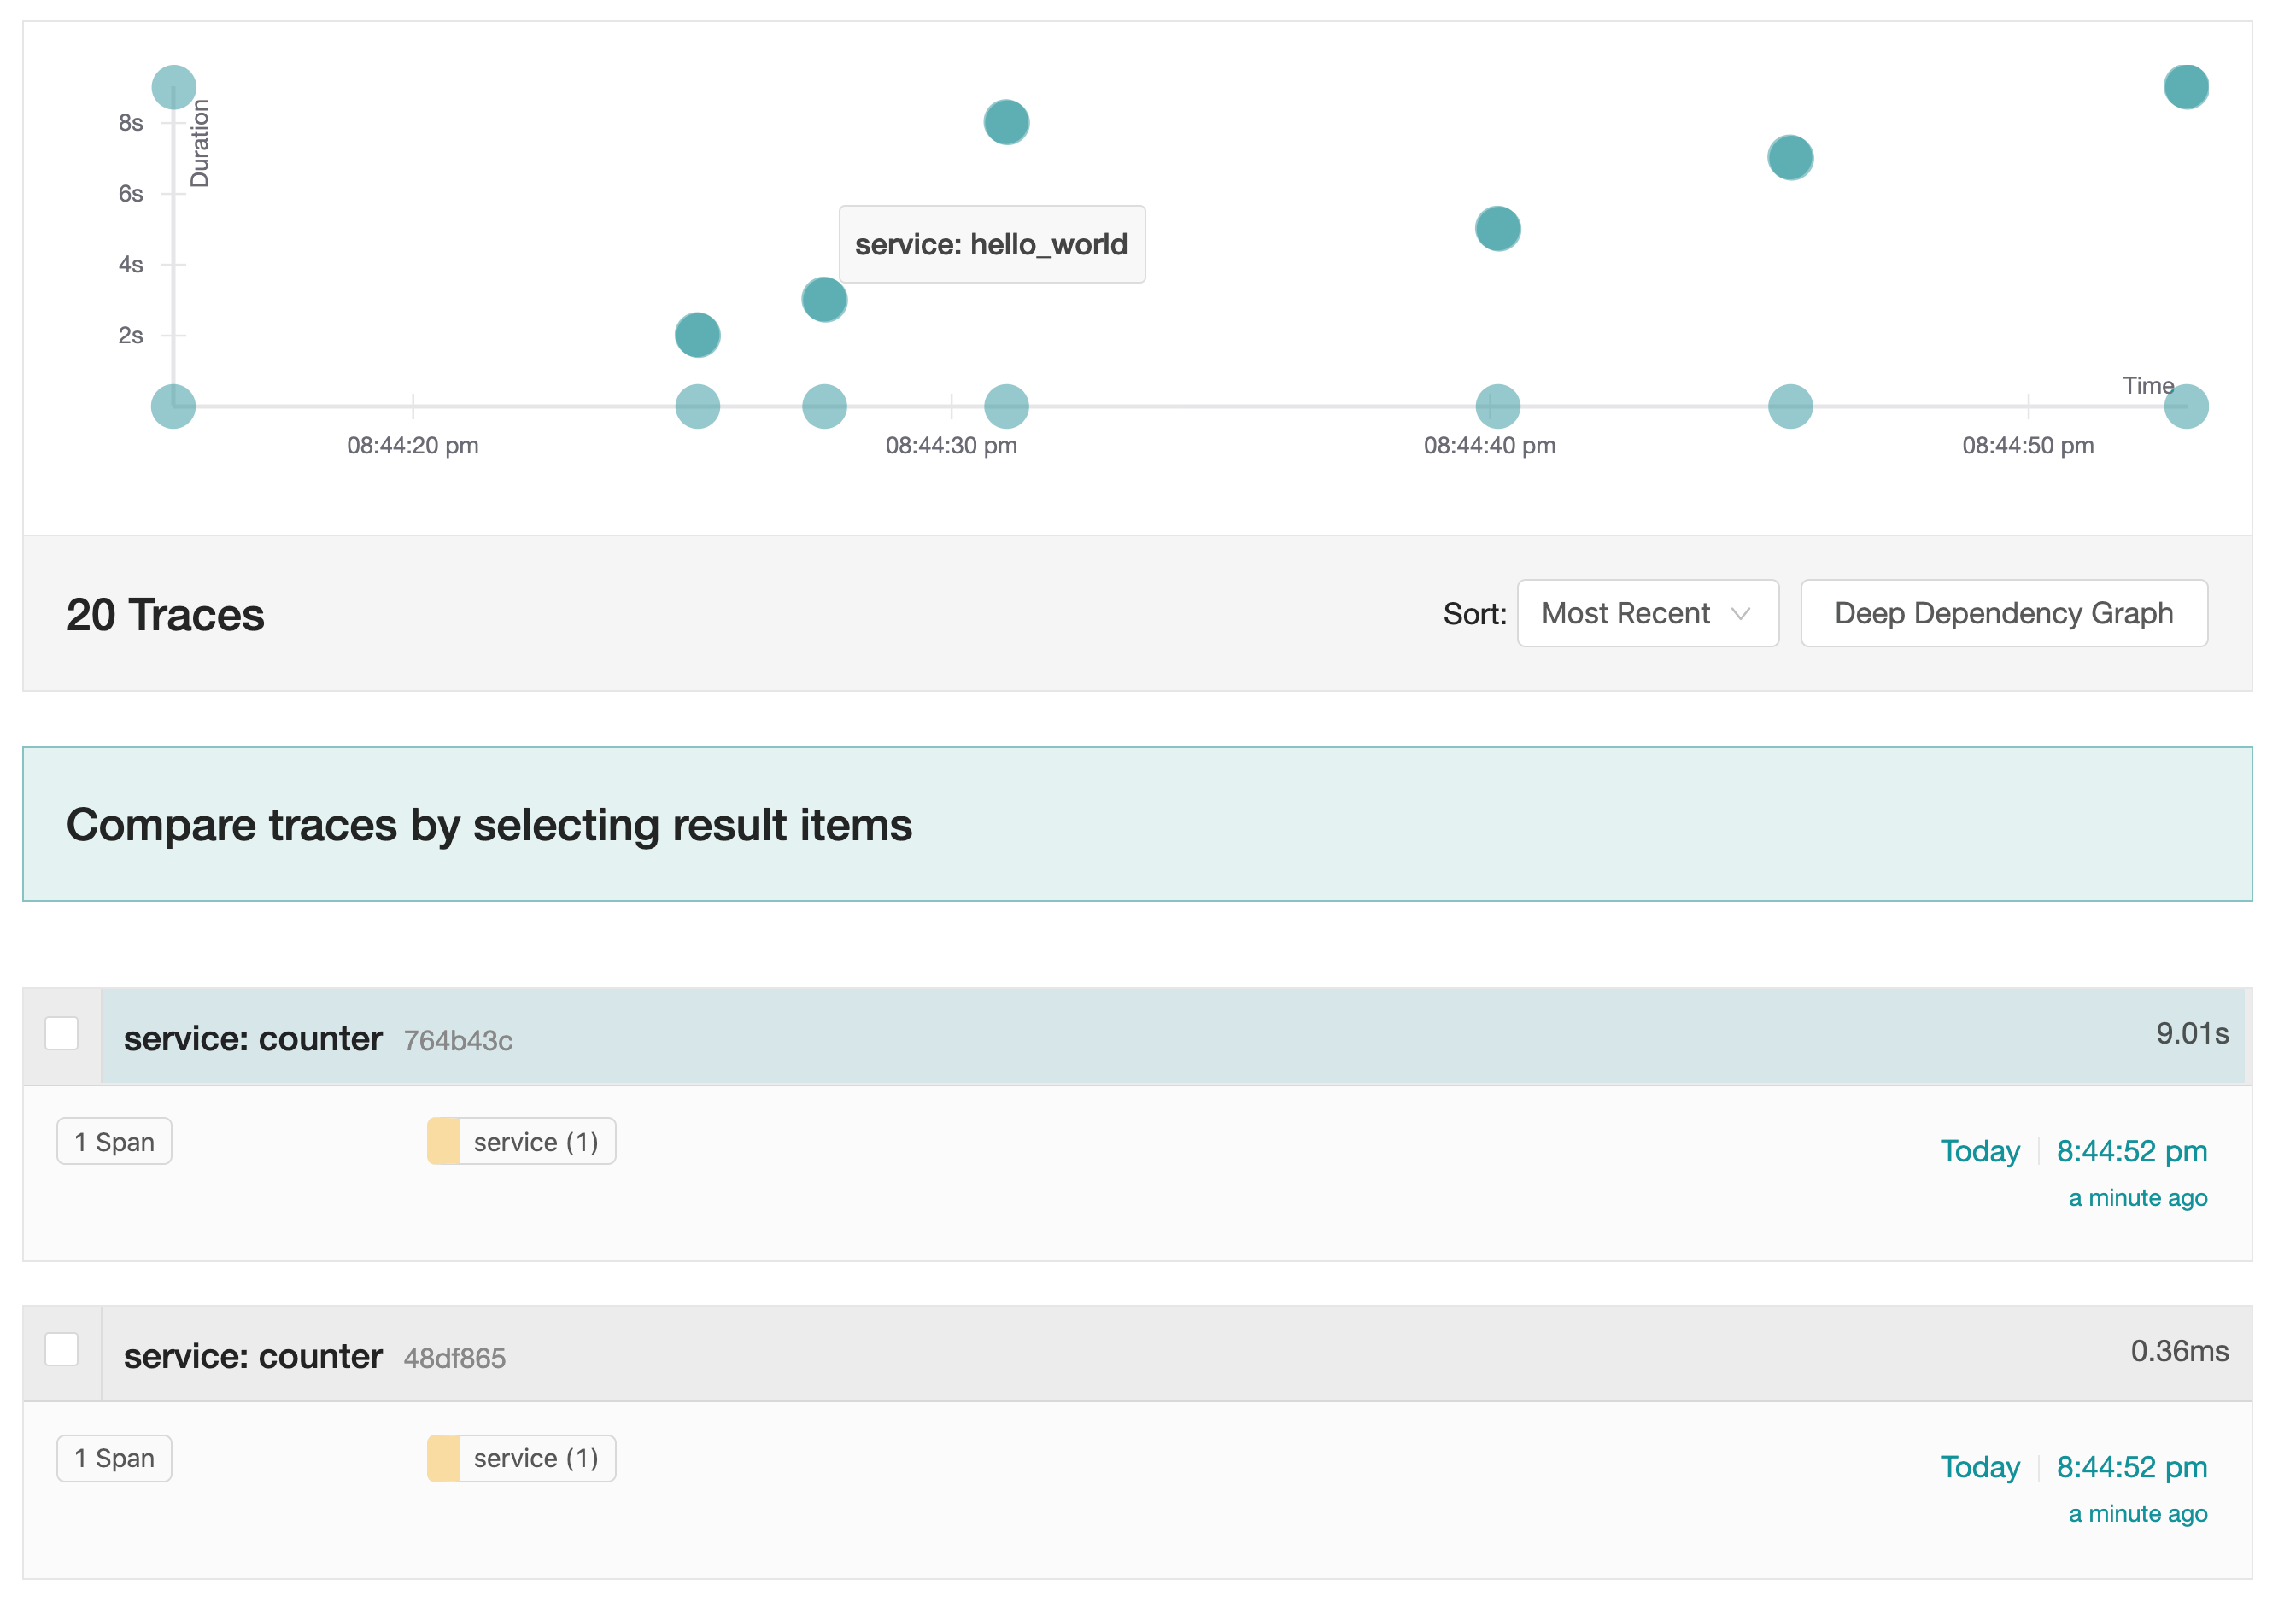
Here, we see that different calls to the service have different execution times. Jaeger has traced how long our applications take to process information and which functions contribute the most time. Notice how, as a result of our sleep function, the time it takes for our hello_world() function to complete is highly variable. This is very suspicious, and it gives us a place to focus our investigation. Jaeger has effectively visualized the performance leak inside our distributed application.
By implementing tracing and using the Jaeger UI, we were able to find the cause of our irregular response time.
Conclusion
In this article, we set up a distributed tracing system using Jaeger and added instrumentation to a small application. Now we can deploy other workloads to the cluster, inject Jaeger sidecars, and see how our various services interact and what operations are taking the most time.
Finding performance bottlenecks in applications using multiple services is much faster with distributed tracing. This example, however, demonstrates only a fraction of Jaeger’s potential. In a more complex production environment, you can use Jaeger to compare different traces and really drill down on performance leaks. The complex visualizations that Jaeger can produce are quite impressive and very useful. To learn more about how Jaeger can help you monitor and resolve performance issues in your cluster, visit their official documentation.
Thanks for learning with the DigitalOcean Community. Check out our offerings for compute, storage, networking, and managed databases.
About the author(s)
Supporting the open-source community one tutorial at a time. Former Technical Editor at DigitalOcean. Expertise in topics including Ubuntu 22.04, Ubuntu 20.04, CentOS, and more.
Still looking for an answer?
This textbox defaults to using Markdown to format your answer.
You can type !ref in this text area to quickly search our full set of tutorials, documentation & marketplace offerings and insert the link!
Hi, Dockerfiles are outdated. When I try to use Dockerfile, I receive this error:
> [2/4] RUN apk add --no-cache py3-pip python3 &&     pip3 install flask requests:
#6 0.221 fetch http://dl-cdn.alpinelinux.org/alpine/v3.8/main/x86_64/APKINDEX.tar.gz
#6 0.647 WARNING: Ignoring http://dl-cdn.alpinelinux.org/alpine/v3.8/main/x86_64/APKINDEX.tar.gz: IO ERROR
#6 0.647 fetch http://dl-cdn.alpinelinux.org/alpine/v3.8/community/x86_64/APKINDEX.tar.gz
#6 0.915 WARNING: Ignoring http://dl-cdn.alpinelinux.org/alpine/v3.8/community/x86_64/APKINDEX.tar.gz: IO ERROR
#6 0.915 ERROR: unsatisfiable constraints:
#6 0.916   py3-pip (missing):
#6 0.916     required by: world[py3-pip]
#6 0.916   python3 (missing):
#6 0.916     required by: world[python3]
------
executor failed running [/bin/sh -c apk add --no-cache py3-pip python3 &&     pip3 install flask requests]: exit code: 2
Dockerfile first line should be update to “FROM alpine:latest”
Nice article. But I think that code example isn’t best because your trace consists only from 1 span.
 This work is licensed under a Creative Commons Attribution-NonCommercial- ShareAlike 4.0 International License.
Become a contributor for community
Get paid to write technical tutorials and select a tech-focused charity to receive a matching donation.

DigitalOcean Documentation
Full documentation for every DigitalOcean product.

Resources for startups and AI-native businesses
The Wave has everything you need to know about building a business, from raising funding to marketing your product.
The developer cloud
Scale up as you grow — whether you're running one virtual machine or ten thousand.

Start building today
From GPU-powered inference and Kubernetes to managed databases and storage, get everything you need to build, scale, and deploy intelligent applications.
