
Introduction
In this tutorial, we will cover how to install Graylog v1.3.x (sometimes referred to as Graylog2) on CentOS 7, and configure it to gather the syslogs of your systems in a centralized location. Graylog is a powerful log management and analysis tool that has many use cases, from monitoring SSH logins and unusual activity to debugging applications. It is based on Elasticsearch, Java, and MongoDB.
It is possible to use Graylog to gather and monitor a large variety of logs, but we will limit the scope of this tutorial to syslog gathering. Also, because we are demonstrating the basics of Graylog, we will be installing all of the components on a single server.
About Graylog Components
Graylog has four main components:
- Graylog Server nodes: Serves as a worker that receives and processes messages, and communicates with all other non-server components. Its performance is CPU dependent
- Elasticsearch nodes: Stores all of the logs/messages. Its performance is RAM and disk I/O dependent
- MongoDB: Stores metadata and does not experience much load
- Web Interface: The user interface
Here is a diagram of the Graylog components (note that the messages are sent from your other servers):
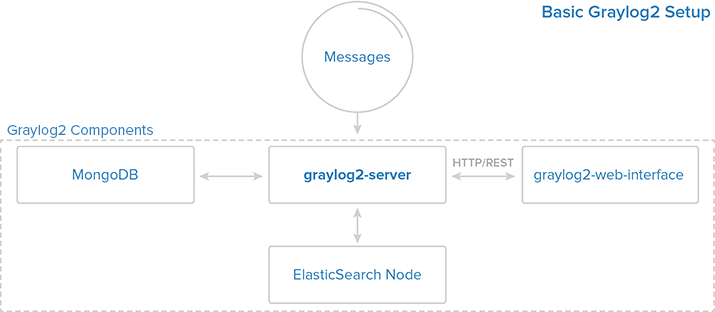
This tutorial will implement a very basic Graylog setup, with all of the components installed on the same server. For a larger, production setup, it is advisable to set up install the components on separate servers for performance reasons.
Prerequisites
The setup described in this tutorial requires an CentOS 7 server with at least 2GB of RAM. You also need root or superuser access (Steps 1-4 of Initial Server Setup with CentOS 7).
If you use a VPS with less than 2GB of RAM you will not be able to start all of the Graylog components.
Let’s start installing software!
Install MongoDB
The MongoDB installation is simple and quick. Run the following command to import the MongoDB public GPG key into rpm:
- sudo rpm --import https://www.mongodb.org/static/pgp/server-3.2.asc
Create the MongoDB source list:
- echo '[mongodb-org-3.2]
- name=MongoDB Repository
- baseurl=https://repo.mongodb.org/yum/redhat/$releasever/mongodb-org/3.2/x86_64/
- gpgcheck=1
- enabled=1' | sudo tee /etc/yum.repos.d/mongodb-org-3.2.repo
Install the latest stable version of MongoDB with this command:
- sudo yum install -y mongodb-org
Now start MongoDB:
- sudo systemctl restart mongod
MongoDB should be up and running now. Let’s move on to installing Java.
Install Java
Elasticsearch and Logstash require Java, so we will install that now. We will install a recent version of Oracle Java 8 because that is what Elasticsearch recommends. It should, however, work fine with OpenJDK, if you decide to go that route. Following the steps in this section means that you accept the Oracle Binary License Agreement for Java SE.
Change to your home directory and download the Oracle Java 8 (Update 73, the latest at the time of this writing) JDK RPM with these commands:
- wget --no-cookies --no-check-certificate --header "Cookie: gpw_e24=http%3A%2F%2Fwww.oracle.com%2F; oraclelicense=accept-securebackup-cookie" "http://download.oracle.com/otn-pub/java/jdk/8u73-b02/jdk-8u73-linux-x64.rpm"
Then install the RPM with this yum command (if you downloaded a different release, substitute the filename here):
- sudo yum -y localinstall jdk-8u73-linux-x64.rpm
Now Java should be installed at /usr/java/jdk1.8.0_73/jre/bin/java, and linked from /usr/bin/java.
You may delete the archive file that you downloaded earlier:
- rm ~/jdk-8u*-linux-x64.rpm
Now that Java is installed, let’s install Elasticsearch.
Install Elasticsearch
Graylog 1.x only works with pre-2.0 versions of Elasticsearch, so we will install Elasticsearch 1.7.x. Elasticsearch can be installed with a package manager by adding Elastic’s package source list.
Run the following command to import the Elasticsearch public GPG key into rpm:
- sudo rpm --import http://packages.elastic.co/GPG-KEY-elasticsearch
Create a new yum repository file for Elasticsearch by running this command:
- echo '[elasticsearch-1.7]
- name=Elasticsearch repository for 1.7.x packages
- baseurl=http://packages.elastic.co/elasticsearch/1.7/centos
- gpgcheck=1
- gpgkey=http://packages.elastic.co/GPG-KEY-elasticsearch
- enabled=1' | sudo tee /etc/yum.repos.d/elasticsearch.repo
Install Elasticsearch with this command:
- sudo yum -y install elasticsearch
Elasticsearch is now installed. Let’s edit the configuration:
- sudo vi /etc/elasticsearch/elasticsearch.yml
Find the section that specifies cluster.name. Uncomment it, and replace the default value with “graylog-development”, so it looks like the following:
cluster.name: graylog-development
You will want to restrict outside access to your Elasticsearch instance (port 9200), so outsiders can’t read your data or shutdown your Elasticsearch cluster through the HTTP API. Find the line that specifies network.host, uncomment it, and replace its value with “localhost” so it looks like this:
network.host: localhost
Save and exit elasticsearch.yml.
Now start Elasticsearch:
- sudo systemctl restart elasticsearch
Then run the following command to start Elasticsearch on boot up:
- sudo systemctl enable elasticsearch
After a few moments, run the following to test that Elasticsearch is running properly:
curl -XGET 'http://localhost:9200/_cluster/health?pretty=true'
Now that Elasticsearch is up and running, let’s install the Graylog server.
Install Graylog Server
Now that we have installed the other required software, let’s install the server component of Graylog, graylog-server.
First, download the Graylog RPM package to your system with this command:
- sudo rpm -Uvh https://packages.graylog2.org/repo/packages/graylog-1.3-repository-el7_latest.rpm
Then install the graylog-server package with these commands:
- sudo yum -y install graylog-server
Install pwgen, which we will use to generate password secret keys:
- sudo yum -y install epel-release
- sudo yum -y install pwgen
Now we must configure the admin password and secret key. The password secret key is configured in server.conf, by the password_secret parameter. We can generate a random key and insert it into the Graylog configuration with the following two commands:
- SECRET=$(pwgen -s 96 1)
- sudo -E sed -i -e 's/password_secret =.*/password_secret = '$SECRET'/' /etc/graylog/server/server.conf
The admin password is assigned by creating an shasum of the desired password, and assigning it to the root_password_sha2 parameter in the Graylog configuration file. Create shasum of your desired password with the following command, substituting the highlighted “password” with your own. The sed command inserts it into the Graylog configuration for you:
- PASSWORD=$(echo -n password | sha256sum | awk '{print $1}')
- sudo -E sed -i -e 's/root_password_sha2 =.*/root_password_sha2 = '$PASSWORD'/' /etc/graylog/server/server.conf
Now that the admin password is setup, let’s open the Graylog configuration to make a few changes:
- sudo vi /etc/graylog/server/server.conf
You should see that password_secret and root_password_sha2 have random strings to them because of the commands that you ran in the steps above.
Now we will configure the rest_transport_uri, which is how the Graylog web interface will communicate with the server. Because we are installing all of the components on a single server, let’s set the value to 127.0.0.1, or localhost. Find and uncomment rest_transport_uri, and change it’s value so it looks like the following:
rest_transport_uri = http://127.0.0.1:12900/
Next, because we only have one Elasticsearch shard (which is running on this server), we will change the value of elasticsearch_shards to 1:
elasticsearch_shards = 1
Next, change the value of elasticsearch_cluster_name to “graylog-development” (the same as the Elasticsearch cluster.name):
elasticsearch_cluster_name = graylog-development
Uncomment these two lines to discover the Elasticsearch instance using unicast instead of multicast:
elasticsearch_discovery_zen_ping_multicast_enabled = false
elasticsearch_discovery_zen_ping_unicast_hosts = 127.0.0.1:9300
Save and quit. Now graylog-server is configured and ready to be started.
Start the Graylog server with the service command:
- sudo systemctl start graylog-server
The next step is to install the Graylog web interface. Let’s do that now!
Install Graylog Web
Install Graylog Web with this command:
sudo yum -y install graylog-web
Next, we want to configure the web interface’s secret key, the application.secret parameter in web.conf. We will generate another key, as we did with the Graylog server configuration, and insert it with sed, like so:
- SECRET=$(pwgen -s 96 1)
- sudo -E sed -i -e 's/application\.secret=""/application\.secret="'$SECRET'"/' /etc/graylog/web/web.conf
Now open the web interface configuration file, with this command:
- sudo vi /etc/graylog/web/web.conf
Now we need to update the web interface’s configuration to specify the graylog2-server.uris parameter. This is a comma delimited list of the server REST URIs. Since we only have one Graylog server node, the value should match that of rest_listen_uri in the Graylog server configuration (i.e. “http://127.0.0.1:12900/”).
graylog2-server.uris="http://127.0.0.1:12900/"
The Graylog web interface is now configured. Start the Graylog web interface:
- sudo systemctl restart graylog-web
Now we can use the Graylog web interface. Let’s do that now.
Configure Graylog to Receive syslog messages
Log into Graylog Web Interface
In your favorite web browser, go to the port 9000 of your server’s public IP address:
In a web browser:http://graylog_public_IP:9000/
You should see a login screen. Enter admin as your username and the admin password that you set earlier.
Once logged in, you will see something like the following:
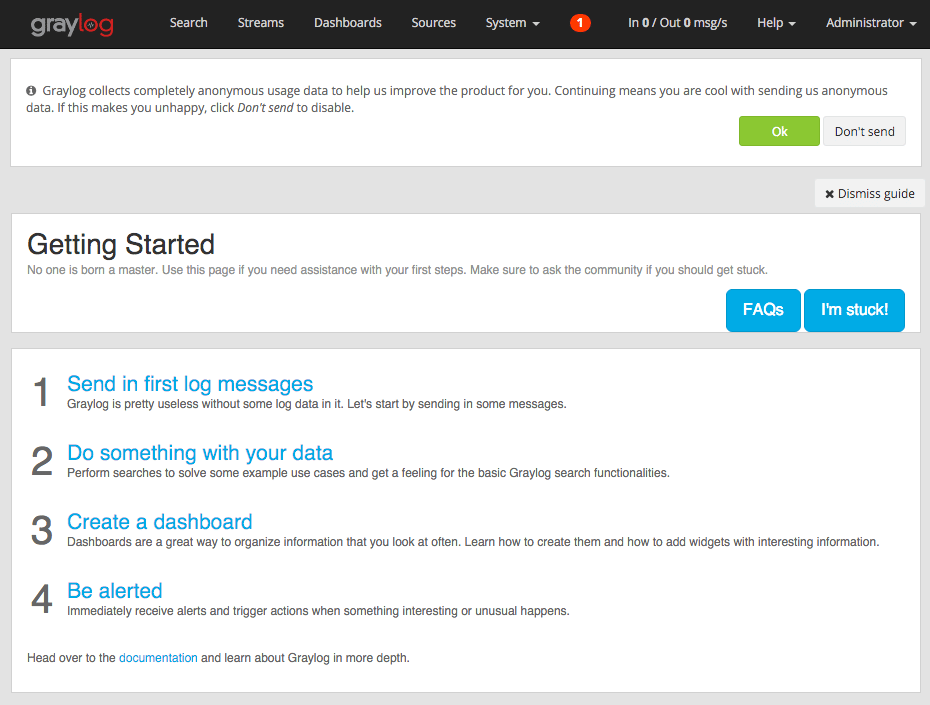
The red number at the top is a notification. If you click on it, you will see a message that says you have a node without any running inputs. Let’s add an input to receive syslog messages over UDP now.
Create Syslog UDP Input
To add an input to receive syslog messages, click on the System drop-down in the top menu.
Now, from the drop-down menu, select Inputs.
Select Syslog UDP from the drop-down menu and click the Launch new input button.
A “Launch a new input: Syslog UDP” modal window will pop up. Enter the following information (substitute in your server’s private IP address for the bind address):
- Title:
syslog - Port:
8514 - Bind address:
graylog_private_IP
Then click Launch.
You should now see an input named “syslog” in the Local inputs section (and it should have a green box that says “running” next to it), like so:
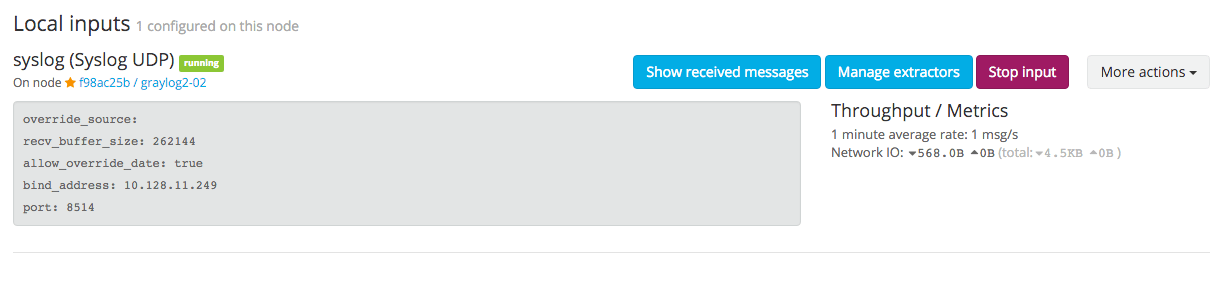
Now our Graylog server is ready to receive syslog messages on port 8514 from your servers. Let’s configure your servers to send their syslog messages to Graylog now.
Configure Rsyslog to Send Syslogs to Graylog Server
On all of your client servers, the servers that you want to send syslog messages to Graylog, do the following steps.
Create an rsyslog configuration file in /etc/rsyslog.d. We will call ours 90-graylog.conf:
- sudo vi /etc/rsyslog.d/90-graylog.conf
In this file, add the following lines to configure rsyslog to send syslog messages to your Graylog server (replace graylog_private_IP with your Graylog server’s private IP address):
$template GRAYLOGRFC5424,"<%pri%>%protocol-version% %timestamp:::date-rfc3339% %HOSTNAME% %app-name% %procid% %msg%\n"
*.* @graylog_private_IP:8514;GRAYLOGRFC5424
Save and quit. This file will be loaded as part of your rsyslog configuration from now on. Now you need to restart rsyslog to put your change into effect.
- sudo systemctl restart rsyslog
After you are finished configuring rsyslog on all of the servers you want to monitor, go back to the Graylog web interface.
Viewing Your Graylog Sources
In your favorite web browser, go to the port 9000 of your server’s public IP address:
In a web browser:http://graylog_public_IP:9000/
Click on Sources in the top bar. You will see a list of all of the servers that you configured rsyslog on.
The hostname of the sources is on the left, with the number of messages received by Graylog on the right.
Searching Your Graylog Data
After letting your Graylog collect messages for some time, you will be able to search through the messages. As an example, let’s search for “sshd” to see what kind of SSH activity is happening on our servers. Here is a snippet of our results:
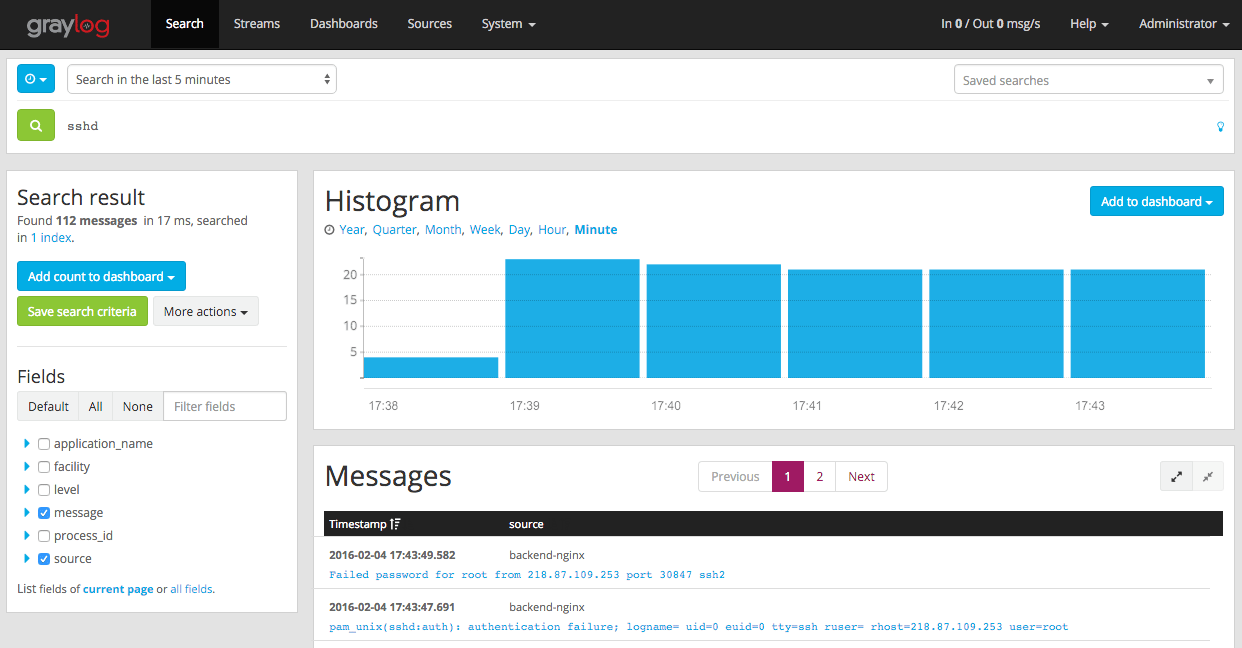
As you can see, our example search results revealed sshd logs for various servers, and a lot of failed root login attempts. Your results may vary, but it can help you to identify many issues, including how unauthorized users are attempting to access your servers.
In addition to the basic search functionality on all of your sources, you can search the logs of a specific host, or in a specific time frame.
Searching through data in Graylog is useful, for example, if you would like to review the logs of a server or several servers after an incident has occurred. Centralized logging makes it easier to correlate related incidents because you do not need to log into multiple servers to see all the events that have happened.
For more information on how the search bar works, check out the official documentation: Graylog Searching
Conclusion
Now that you have Graylog set up, feel free to explore the other functionality that it offers. You can send other types of logs into Graylog, and set up extractors (or reformat logs with software like logstash) to make the logs more structured and searchable. You can also look into expanding your Graylog environment by separating the components and adding redundancy to increase performance and availability.
Good luck!
Thanks for learning with the DigitalOcean Community. Check out our offerings for compute, storage, networking, and managed databases.
About the author
Software Engineer @ DigitalOcean. Former Señor Technical Writer (I no longer update articles or respond to comments). Expertise in areas including Ubuntu, PostgreSQL, MySQL, and more.
Still looking for an answer?
This textbox defaults to using Markdown to format your answer.
You can type !ref in this text area to quickly search our full set of tutorials, documentation & marketplace offerings and insert the link!
I did what you said above but when I try to go to the graylog server page to login for the first time I get. No Graylog servers available. Cannot log in. I check services and mongodb does not start and I cannot get it to start.
Hi Mitchell,
Just want to thank you from bottom of my heart. Your articles are simple & straight forward to understand. Thanks for this excellent work and please keep it going always…thanks.
 This work is licensed under a Creative Commons Attribution-NonCommercial- ShareAlike 4.0 International License.
Become a contributor for community
Get paid to write technical tutorials and select a tech-focused charity to receive a matching donation.

DigitalOcean Documentation
Full documentation for every DigitalOcean product.

Resources for startups and AI-native businesses
The Wave has everything you need to know about building a business, from raising funding to marketing your product.
The developer cloud
Scale up as you grow — whether you're running one virtual machine or ten thousand.

Start building today
From GPU-powered inference and Kubernetes to managed databases and storage, get everything you need to build, scale, and deploy intelligent applications.
