By Melissa Anderson and Kent Shultz

Introduction
Suppose your website or application is more sluggish than usual. How do you begin to investigate the problem? There are so many causes for a slow application, but sometimes it’s because your server’s CPUs are maxed out. This guide will help you find out whether that is the case for you.
We’ll start by understanding two of the most commonly referenced metrics of resource usage on any Linux server: CPU utilization and load average. We’ll explore the difference between these two metrics and then see how to check their values using two command-line utilities, uptime and top. Finally, we’ll look at how to track these metrics over time with DigitalOcean Monitoring and set an alerting policy so you can get notified by email or Slack when the metrics rise above their usual values.
Prerequisites
To follow along with this guide, you need:
- A two-core DigitalOcean Droplet with Monitoring enabled. Read our documentation if you don’t know how to create a Droplet. Also read the guide How To Install the DigitalOcean Metrics Agent to learn how to enable Monitoring on your new Droplet or add the Monitoring Agent to an existing Droplet.
- The
stressutility installed on your Droplet. Useaptordnfto installstressfrom your distribution’s repositories.
The two command-line utilities featured in this guide, uptime and top, are available by default on most Linux distributions.
Background
Before we look at how to check and track CPU utilization and load average, let’s consider them conceptually. What do they measure?
CPU Utilization vs. Load Average
These two often-checked metrics are sometimes conflated because both have to do with the CPUs and both may be high when a server is apparently overburdened. But they do not measure the same thing, and they do not always directly correlate to one another. CPU utilization tells you how busy the CPUs are right now, and load average tells you how many tasks are waiting for or running on the CPUs, on average, over the recent past.
Note: Because CPU task queues can shrink and swell dramatically from one millisecond to the next, an instantaneous snapshot of CPU load is not very helpful. That is why the common command-line utilities report load average: an average of the CPU load taken over some time interval.
Imagine a server’s CPUs as cashiers in a grocery store and tasks as the customers. CPU load is a count of the total number of people in line, including those currently being served at the cash registers. CPU utilization is how intensely the cashiers are working.
Of course, these two metrics are related: one obvious reason the checkout lines could be chronically long is if the store has too slow (or too few) cashiers. But the lines may get backed up for other reasons as well. If a customer asks for a price check on an item, the cashier asks another employee to do that. The cashier may continue scanning other items while waiting for the price check, but if the check has not come back by the time the other items have been scanned—maybe the price checker stepped away for a moment—the cashier and the customer will be waiting idly while the line grows. This is like a task waiting on some slow or unavailable I/O device (i.e., a disk), and indeed, I/O-heavy workloads may lead to high load averages but low CPU utilization.
Now imagine that the price checker is gone for 30 minutes on lunch break. In the meantime, a few more customers need price checks. (Assume that an idle cashier cannot do price checks herself, just as a CPU cannot perform the functions of a disk.) The cashier sets all these customers aside and works through the remaining customers, emptying the checkout line. The cashier is now idle (~0% utilization) but there remain several customers standing around (non-zero load) who still need her time, even though she cannot complete their checkouts yet because everyone is waiting on the price checker to return. There is demand for the cashier, yet she is not busy, so if any new customer approaches the cash register, he will be served immediately.
You can probably imagine other grocery store problems that would cause wait times to grow through no fault of the cashiers, but considering those would lead us into a more thorough discussion of CPU utilization, load average, I/O wait, and CPU scheduling. Such a discussion is out of scope for this guide, and so for now, just remember:
- Load average is not a proxy for CPU utilization. They are not the same thing.
- CPU load means CPU demand. Underpowered CPUs can inflate that demand, but so can other things, namely, I/O wait. Load average is usually considered a CPU-related metric, but it is not only about the CPUs. And so,
- A high load average cannot always be alleviated by adding more or faster CPUs.
So how does a server represent these metrics?
Units of Measure
CPU utilization is given as a percentage of the total CPU capacity on the system. On a single-processor system, the total CPU capacity is always 100%. On a multiprocessor system, the capacity can be represented in two different ways: normalized, or non-normalized.
Normalized capacity means the combined capacity of all the processors is considered as 100%, regardless of the number of processors. If both CPUs in a two-processor system are at 50% utilization, the normalized total utilization is 50%.
Non-normalized capacity counts each processor as a unit with 100% capacity, so that a two-processor system has 200% capacity, a four-processor system has 400% capacity, and so on. If both CPUs in a two-processor system are at 50% utilization, the non-normalized total utilization is 100% (half of the 200% maximum), which could be confusing if you don’t understand that you’re looking at a non-normalized figure on a two-processor system.
Load average is given as a decimal number that, again, represents the average number of tasks waiting for—or currently being served by—all CPUs. On a four-processor system, there are four processor queues, and if, on average, the four CPUs are each serving one task with no tasks waiting in their queues, the load average will be 4.0. No problem. On the other hand, a load average of 4.0 on a single-processor system would be more worrisome. That would mean that on average, the lone processor is serving one task with three more waiting in its queue.
The values for load average are never normalized. No tool will report the four-processor-four-tasks case as having a load average of 1.0. If on average there are four total tasks running or waiting for the CPUs, the load average will always be 4.0, however many CPUs there are.
So, to make sense of the metrics you’re about to explore, you first need to know how many CPUs your server has.
How Many CPUs Do You Have?
You already know you have a two-core Droplet, but you can use the nproc command with the --all option to display the number of processors on any server. Without the --all flag, nproc will display the number of processing units available to the current process, which will be less than the total number of processors if any are in use.
- nproc --all
Output of nproc2
On most modern Linux distributions, you can also use the lscpu command, which displays not only the number of processors but also the architecture, model name, speed, and much more:
- lscpu
Output of lscpuArchitecture:          x86_64
CPU op-mode(s):        32-bit, 64-bit
Byte Order:            Little Endian
CPU(s):                2
On-line CPU(s) list:   0,1
Thread(s) per core:    1
Core(s) per socket:    1
Socket(s):             2
NUMA node(s):          1
Vendor ID:             GenuineIntel
CPU family:            6
Model:                 63
Model name:            Intel(R) Xeon(R) CPU E5-2650L v3 @ 1.80GHz
Stepping:              2
CPU MHz:               1797.917
BogoMIPS:              3595.83
Virtualization:        VT-x
Hypervisor vendor:     KVM
Virtualization type:   full
L1d cache:             32K
L1i cache:             32K
L2 cache:              256K
L3 cache:              30720K
NUMA node0 CPU(s):     0,1
Flags:                 fpu vme de pse tsc msr pae mce cx8 apic sep mtrr pge mca cmov pat pse36 clflush mmx fxsr sse sse2 ss syscall nx pdpe1gb rdtscp lm constant_tsc arch_perfmon rep_good nopl eagerfpu pni pclmulqdq vmx ssse3 fma cx16 pcid sse4_1 sse4_2 x2apic movbe popcnt tsc_deadline_timer aes xsave avx f16c rdrand hypervisor lahf_lm abm vnmi ept fsgsbase tsc_adjust bmi1 avx2 smep bmi2 erms invpcid xsaveopt arat
What are Optimal Values for CPU Utilization and Load Average?
The optimal CPU utilization for a server depends on its role. Some servers are meant to make full use of the CPUs. Others are not. An application or batch job performing statistical analysis or cryptographic work may consistently tax the CPUs at or near full capacity, whereas a web server usually should not. If your web servers are maxing out their CPUs, do not unthinkingly upgrade to servers with more or faster CPUs. Rather, you should check that there is not malware or some other unruly process (legitimate or not) chewing up CPU cycles.
Although you never want to see sustained CPU utilization at 100% (normalized) on any server, it is appropriate for a computationally-intensive application to hover just under 100%. If it’s not, you may have more CPU power than you need, and perhaps a server downgrade (or using fewer servers) could save you money.
The optimal value for load average is anything at or below the number of CPUs. As long as a two-processor system’s load average remains below 2.0, you can be certain that there is rarely contention for CPU time. (Though the queues almost certainly swell for brief periods.)
Checking Load Average with uptime
uptimeThe uptime command is a quick way to check load average. It can be helpful because it is lightweight and runs quickly even when a system is otherwise responding slowly at the command line (i.e., due to high load).
The uptime command shows:
- the system time
- how long the server has been running
- how many users are currently logged in
- the load average for the past one, five, and fifteen minutes
- uptime
Output 14:08:15 up 22:54, 2 users, load average: 2.00, 1.37, 0.63
In this example, the command was run at 2:08pm on a server that had been up for almost 23 hours. Two users were logged in. The first load average figure, 2.00, is the one-minute load average. Since this server has two CPUs, the load average of 2.00 means that during the minute before uptime was run, on average, two processes were using the CPUs and no processes were waiting. The five-minute load average indicates that for that interval, there was an idle processor about 60% of the time. The 15-minute value indicates that there was even more available CPU time. The three figures together show an increase in CPU demand over the last fifteen minutes.
This utility provides a helpful glance at the load average, but to get more in-depth information, we’ll turn to top.
Checking CPU Utilization with top
topLike uptime, top is available on both Linux and Unix systems, but in addition to displaying the same load averages as uptime, it provides both total-system and per-process figures for CPU utilization, memory usage, and more. Whereas uptime runs and exits, top is interactive. It presents a dashboard of system resource usage and stays in the foreground, refreshing every few seconds until you exit by pressing q.
Before running top, give your Droplet something to work on. Run the following command to place some strain on the CPUs:
- stress -c 2
Now open another terminal to your Droplet and run top:
- top
This will bring up an interactive screen that shows a summary of resource utilization as well as a table of all system processes. Let’s look first at the summary information at the top.
The Header Block
Here are the first five lines in top:
Outputtop - 22:05:28 up  1:02,  3 users,  load average: 2.26, 2.27, 2.19
Tasks: 109 total,   3 running, 106 sleeping,   0 stopped,   0 zombie
%Cpu(s): 99.8 us,  0.0 sy,  0.0 ni,  0.0 id,  0.0 wa,  0.0 hi,  0.0 si,  0.2 st
MiB Mem :   1975.7 total,   1134.7 free,    216.4 used,    624.7 buff/cache
MiB Swap:      0.0 total,      0.0 free,      0.0 used.   1612.0 avail Mem
The first line is almost identical to the output of uptime. As with uptime, the one, five, and fifteen minute load averages are displayed. The only difference between this line and the output of uptime is that the beginning of the line shows the command name, top, and the time is updated each time top refreshes the data.
The second line summarizes the states of all system tasks: the total number of processes, followed by how many of them are running, sleeping, stopped, or zombie.
The third line tells you about the CPU utilization. These figures are normalized and displayed as percentages (without the % symbol) so that all the values on this line should add up to 100% regardless of the number of CPUs. Since you started the stress command with the -c (CPU) option just before running top, the first figure—us, or user processes—should be near 100%.
The fourth and fifth lines tell you about memory and swap usage, respectively. This guide does not explore memory and swap usage, but it’s there for you when you need it.
This header block is followed by a table with information about each individual process, which we’ll look at in a moment.
In the example header block below, the one-minute load average exceeds the number of processors by .77, indicating a short queue with a little bit of wait time. The CPUs are 100% utilized and there’s plenty of free memory.
Outputtop - 14:36:05 up 23:22,  2 users, load average: 2.77, 2.27, 1.91
Tasks: 117 total,   3 running, 114 sleeping,   0 stopped,   0 zombie
%Cpu(s): 98.3 us,  0.2 sy,  0.0 ni,  0.0 id,  0.0 wa,  0.0 hi,  0.2 si,  1.3 st
KiB Mem :  4046532 total,  3244112 free,    72372 used,   730048 buff/cache
KiB Swap:        0 total,        0 free,        0 used.  3695452 avail Mem
 . . .
Let’s look at each of the fields on the CPU line in more depth:
-
us, user: time running un-niced user processes This category refers to user processes that were started with no explicit scheduling priority. Linux systems use the
nicecommand to set a process’s scheduling priority, so “un-niced” means thatnicewasn’t used to change the default value. The user and nice values account for all the user processes. High CPU use in this category may indicate a runaway process, and you can use the output in the process table to identify any culprits. -
sy, system: time running kernel processes Most applications have both user and kernel components. When the Linux kernel is doing something like making system calls, checking permissions, or interacting with devices on behalf of an application, the kernel’s use of the CPU is displayed here. When a process is doing its own work, it will appear in either the user figure described above or, if its priority was explicitly set using the
nicecommand, in the nice figure that follows. -
ni, nice: time running niced user processes Like user, nice refers to CPU time that does not involve the kernel. But with nice, the scheduling priority for these tasks was set explicitly. The niceness (priority) of a process is indicated in the fourth column in the process table under the header NI. Processes with a niceness value between 1 and 20 that consume a lot of CPU time are generally not a problem because tasks with normal or higher priority will be able to get processing power when they need it. But if tasks with elevated niceness, between -1 and -20, are taking a disproportionate amount of CPU time, they can easily affect the responsiveness of the system and warrant further investigation. Note that many processes that run with the highest scheduling priority, -19 or -20 depending on the system, are spawned by the kernel to do important tasks that affect system stability. If you’re not sure about the processes you see, it’s prudent to investigate them rather than killing them.
-
id, idle: time spent in the kernel idle handler This figure indicates the percentage of time that the CPU was both available and idle. A system is generally in good working order with respect to CPU when the user, nice, and idle figures combined are near 100%.
-
wa, IO-wait: time waiting for I/O completion The IO-wait figure shows how much time a processor has spent waiting for I/O operations to complete. Read/write operations for network resources like NFS and LDAP will count in IO-wait as well. As with idle time, spikes here are normal, but any kind of frequent or sustained time in this state suggests an inefficient task, a slow device or network, or a potential hard disk problem.
-
hi, hardware interrupts: time spent servicing hardware interrupts This is the time spent on physical interrupts sent to the CPU from peripheral devices like disks and hardware network interfaces. When the hardware interrupt value is high, you may have a peripheral device that has gone bad.
-
si, software interrupts: time spent servicing software interrupts Software interrupts are sent by processes rather than physical devices. Unlike hardware interrupts that occur at the CPU level, software interrupts occur at the kernel level. When the software interrupt value is high, investigate the specific processes that are using the CPU.
-
st, steal: time stolen from this vm by the hypervisor The steal value shows how long a virtual CPU spends waiting for a physical CPU while the hypervisor is servicing itself or a different virtual CPU. Essentially, the amount of CPU use in this field indicates how much processing power your VM is ready to use, but which is not available to your application because it is being used by the physical host or another virtual machine. Generally, seeing a steal value of up to 10% for brief periods of time is not a cause for concern. Larger amounts of steal for longer periods of time may indicate that the physical server has more demand for CPU than it can support.
Now that we’ve looked at the summary of CPU usage supplied in top’s header, we’ll take a look at the process table that appears below it, paying attention to the CPU-specific columns.
The Process Table
Here are the first six lines of the process table in some example top output:
Output
 PID USER      PR  NI    VIRT    RES    SHR S  %CPU %MEM     TIME+ COMMAND
9966 sammy     20   0    9528     96      0 R  99.7  0.0   0:40.53 stress
9967 sammy     20   0    9528     96      0 R  99.3  0.0   0:40.38 stress
   7 root      20   0       0      0      0 S   0.3  0.0   0:01.86 rcu_sched
1431 root      10 -10    7772   4556   2448 S   0.3  0.1   0:22.45 iscsid
9968 root      20   0   42556   3604   3012 R   0.3  0.1   0:00.08 top
9977 root      20   0   96080   6556   5668 S   0.3  0.2   0:00.01 sshd
. . .
All processes on the server, in any state, are listed below the header. By default, the process table is sorted by the %CPU column, so you will see the processes that are consuming the most CPU time at the top.
The %CPU values are presented as a percent value, but unlike the CPU utilization figures in the header, those in the process table are not normalized, so on this two-core system, the total of all the values in the process table should add up to 200% when both processors are fully utilized.
Note: If you prefer to see normalized values here, press SHIFT+I to switch the display from Irix mode to Solaris mode. Now the sum of the %CPU values will not exceed 100%. When you switch to Solaris mode, you’ll get a brief message that Irix mode is off, and in this example, the values for your stress processes will switch from nearly 100% each to around 50% each.
Output  PID USER      PR  NI    VIRT    RES    SHR S %CPU %MEM     TIME+ COMMAND
10081 sammy     20   0    9528     96      0 R 50.0  0.0   0:49.18 stress
10082 sammy     20   0    9528     96      0 R 50.0  0.0   0:49.08 stress
 1439 root      20   0  223832  27012  14048 S  0.2  0.7   0:11.07 snapd
    1 root      20   0   39832   5868   4020 S  0.0  0.1   0:07.31 systemd
You can interactively control top—and the server’s processes—using different keystrokes, including:
SHIFT-Mto sort processes by memory usage.SHIFT-Pto sort processes by CPU usage.k, followed by a process ID (PID) and a signal, to kill an unruly process. After entering a PID, try a signal of 15 (SIGTERM) first, which is the default. Do not use 9 (SIGKILL) carelessly.r, followed by a process ID, to renice (reprioritize) a process.cto toggle the command descriptions between a short description (the default) and the full command string.dto change the refresh interval for the figures intop.
And many more. Read top’s man page (man top) for more details.
So far, you’ve examined two Linux commands that are commonly used to look into load average and CPU utilization. As useful as these tools are, they only provide a glimpse at the state of your server over a brief window of time. There’s only so long you can sit there and watch top. To get a better idea of long-term patterns of server resource usage, you need some kind of monitoring solution. In the next section, you’ll briefly look into the monitoring tools available at no additional cost for DigitalOcean Droplets.
Tracking Metrics Over Time with DigitalOcean Monitoring
By default, all Droplets display Bandwidth, CPU, and Disk I/O graphs when you click the Droplet name in the Control Panel. You don’t have to install the DigitalOcean Agent to get these three graphs.
These graphs help you visualize each resource’s use for the last 1 hour, 6 hours, 24 hours, 7 days, and 14 days. The CPU graph provides CPU utilization information. The dark blue line indicates CPU use by user processes. The light blue indicates CPU use by system processes. The values on the graphs and their detail are normalized so that the total capacity is 100% regardless of the number of virtual cores.
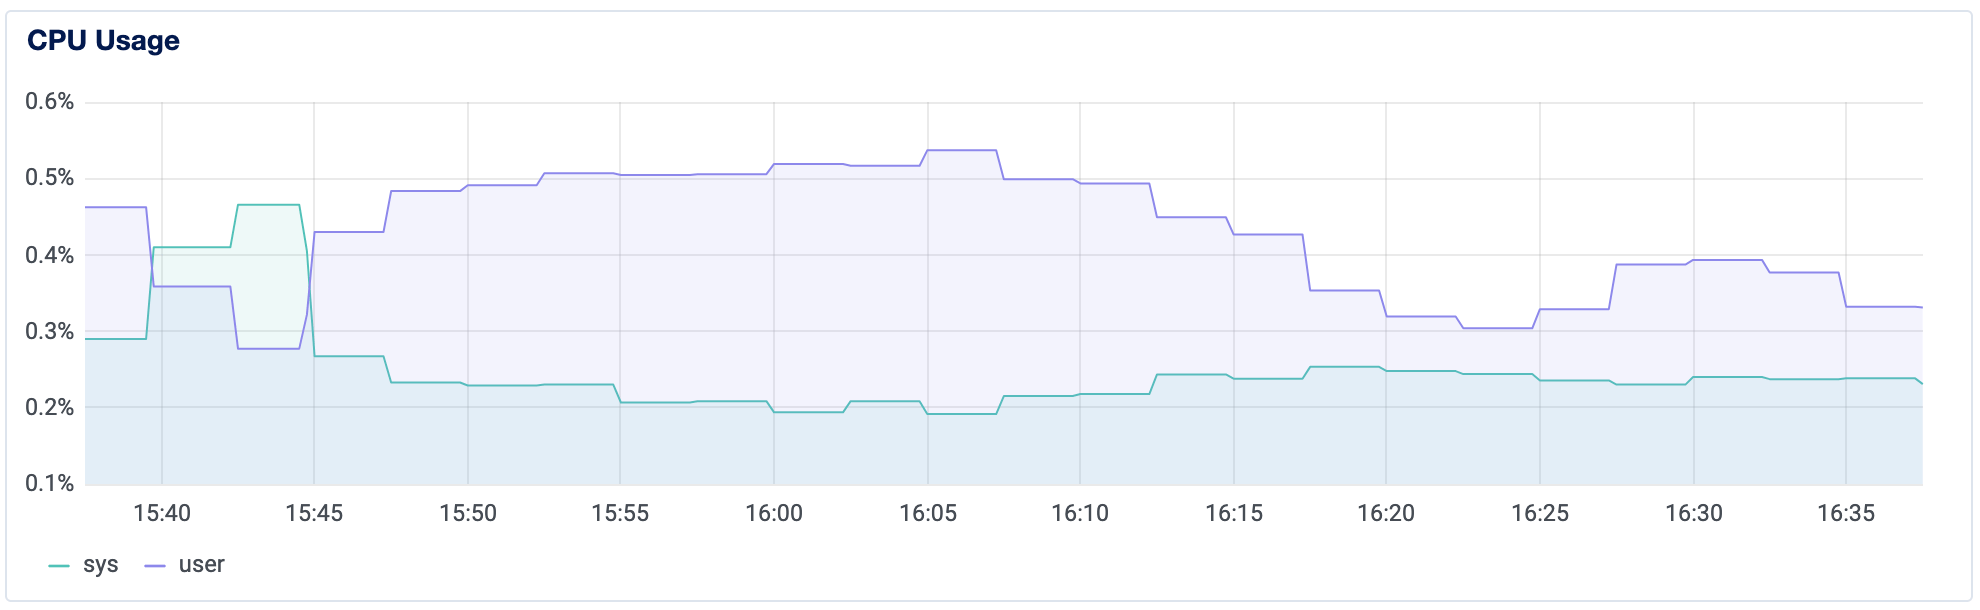
The graphs let you see whether you’re experiencing an intermittent or sustained change in usage and are helpful in spotting changes in a server’s CPU usage pattern.
To supplement these default graphs, you can install the DigitalOcean Agent on a Droplet to collect and display additional data like load average, disk usage, and memory usage. The Agent also allows you to set Alert Policies for the system. How To Install and Use the DigitalOcean Agent for Monitoring can help you get set up.
Once the Agent is installed, you can set alert policies to notify you about resource usage. The thresholds you choose will depend on the server’s typical workload.
Note: when you install the DigitalOcean Monitoring Agent:
- You will only see one value for CPU utilization. You will no longer see system vs. user space utilization.
- You will lose the history of all metrics from before you installed the Agent.
Example Alerts
Monitoring for Change: CPU above 1%
If you’re using a Droplet primarily for integrating and soak testing code, you might set an alert that’s just slightly above historical patterns to detect if new code pushed to the server has increased CPU usage. For the graph above where CPU never reaches 1%, a threshold of 1% CPU use for 5 minutes could provide early warning about code-based changes affecting CPU use.
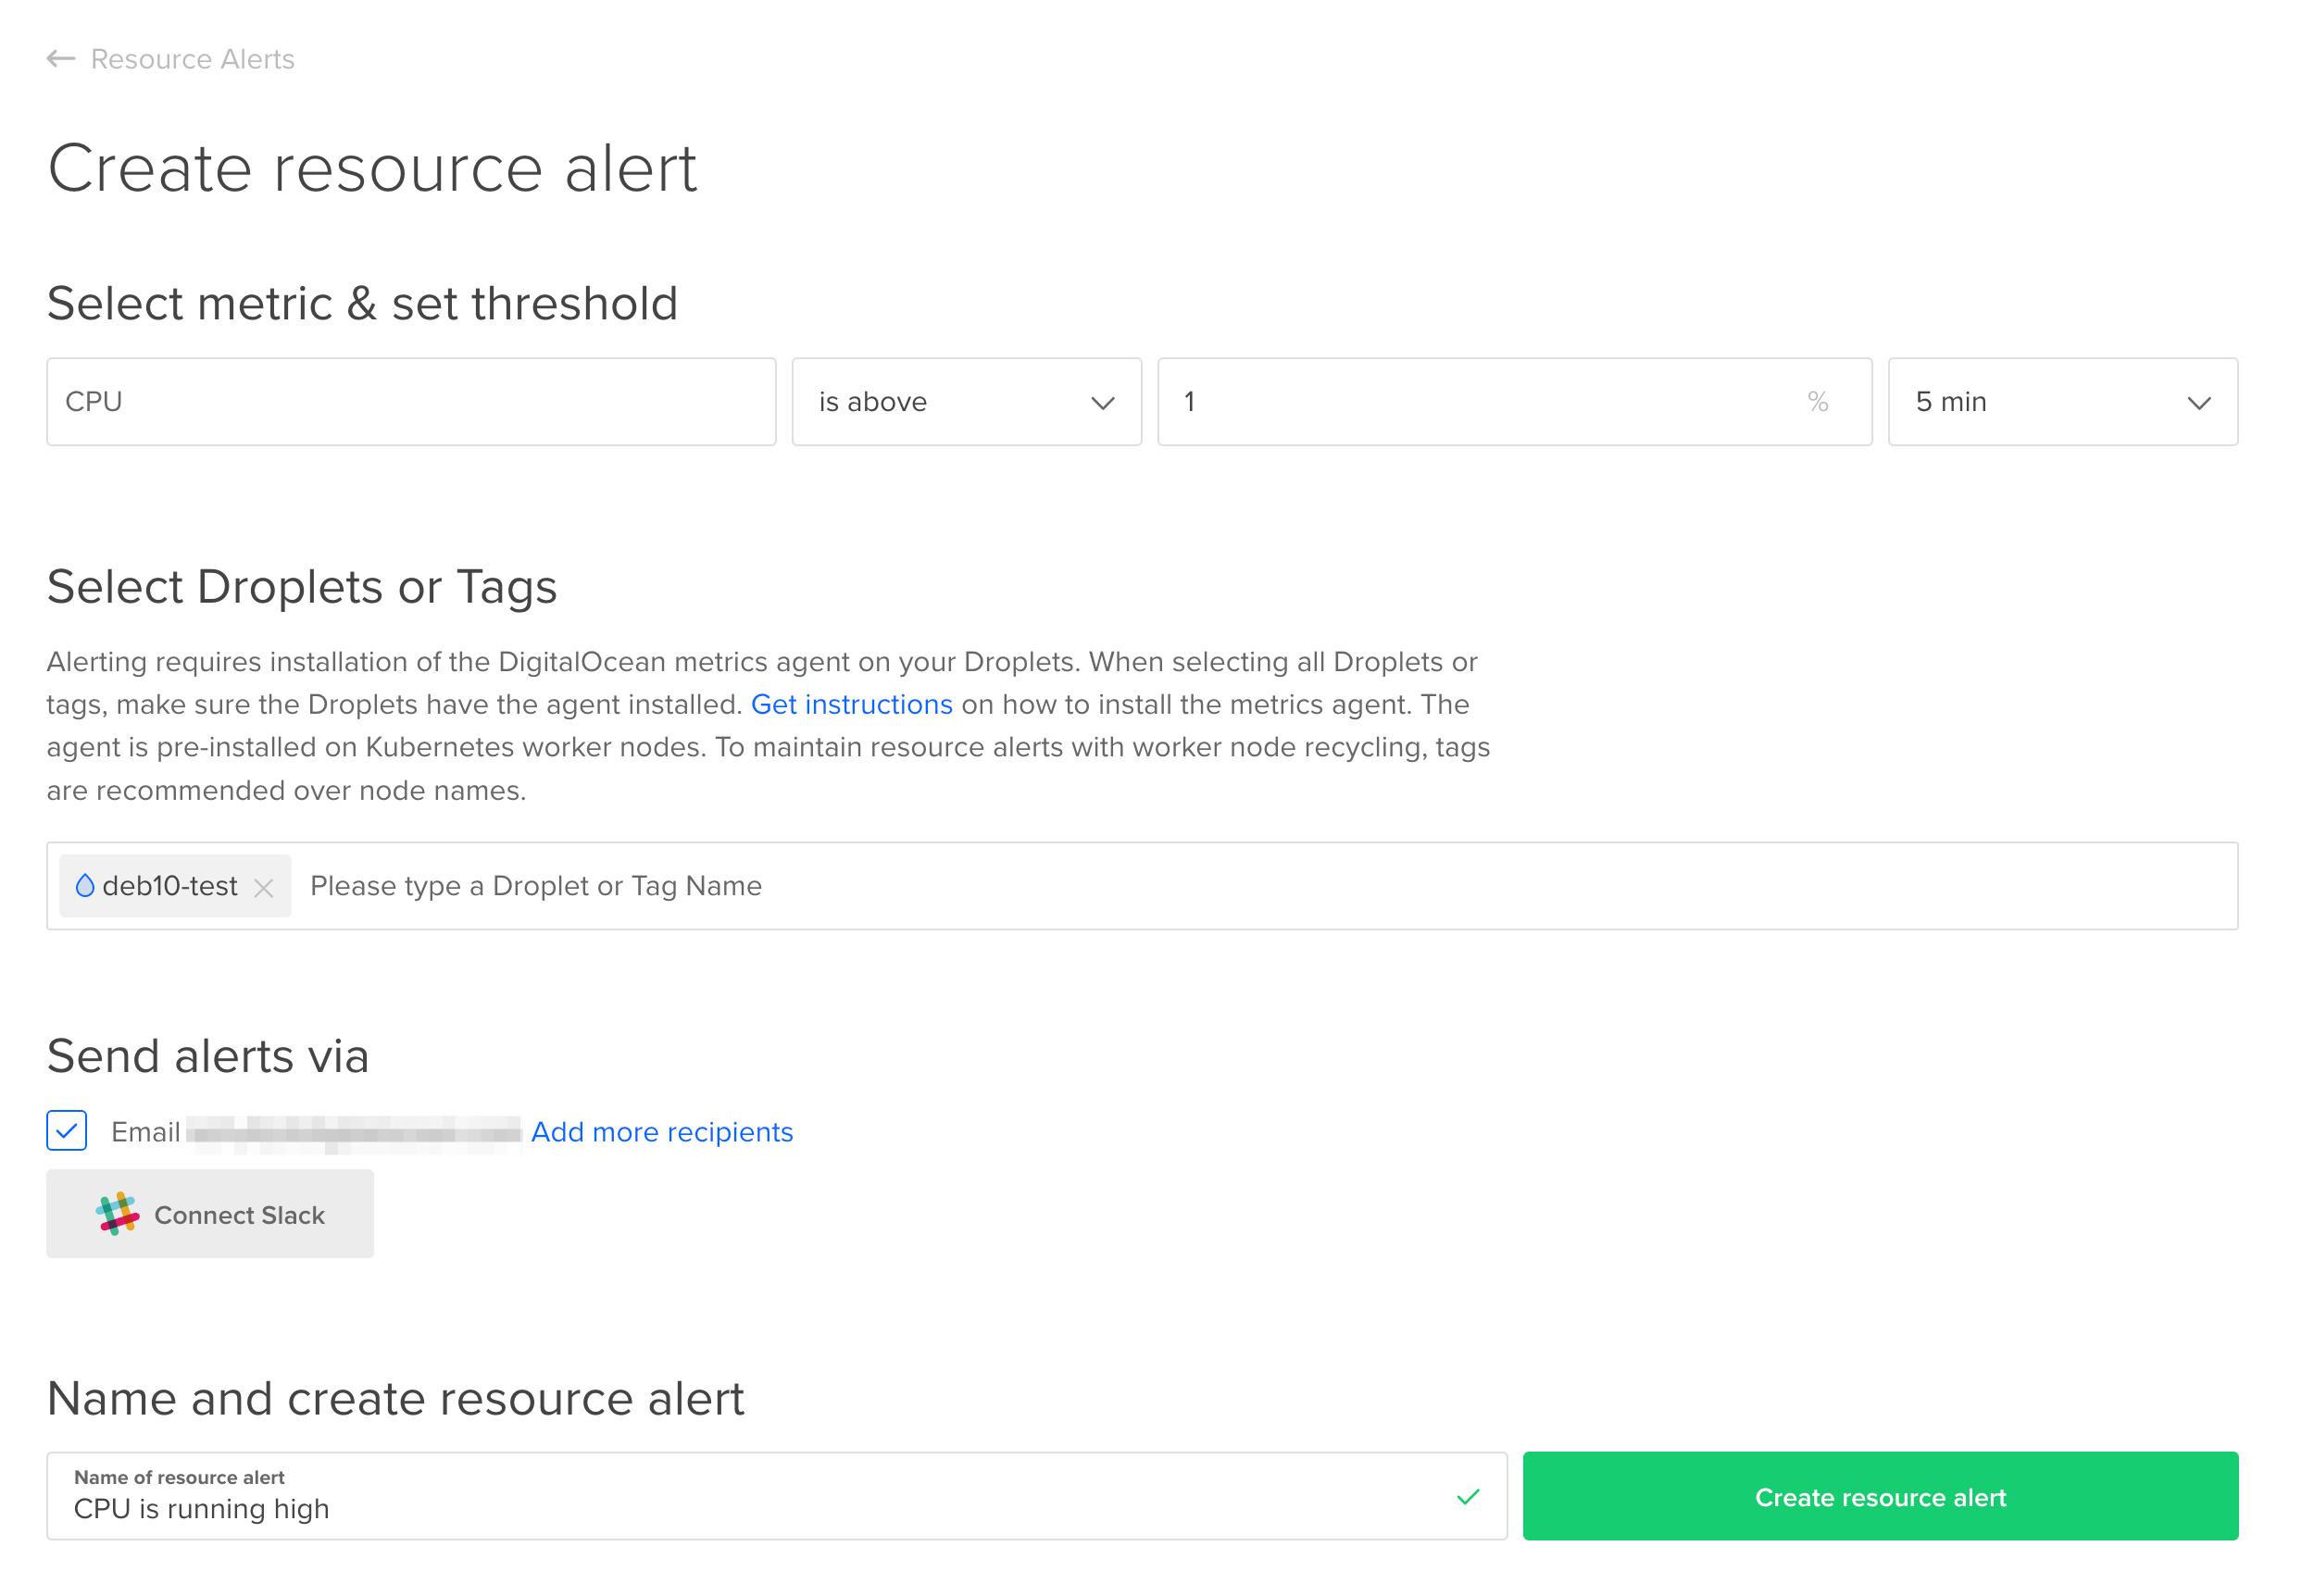
In the DigitalOcean Control Panel, under the MANAGE menu on the left, click Monitoring. Under the Resource Alerts tab (which is highlighted by default), click Create Resource Alert. Fill out the form and click Create resource alert.
On most systems, there’s a good chance this threshold would be completely inappropriate, but if you can determine typical CPU utilization during normal workloads by examining CPU graphs going back a few weeks, you can create alerts with a threshold slightly above the normal utilization and learn early on when new code or new services impact the CPU utilization.
Monitoring for an Emergency Situation: CPU Utilization above 90%
You might also want to set a threshold far above the average, one that you consider critical and which would warrant prompt investigation. For example, if a server that experienced sustained CPU use of 50% for five-minute intervals pretty regularly suddenly shot up to 90%, you might want to log in immediately to investigate the situation. Again, the thresholds are specific to the workload of the system.
Conclusion
In this article, we’ve explored uptime and top, two common Linux utilities that provide insight into CPU utilization and load average on Linux systems, as well as how to use DigitalOcean Monitoring to see the historical CPU utilization on a Droplet and alert you to changes and emergencies. To learn more about DigitalOcean Monitoring, read An Introduction to Metrics, Monitoring, and Alerting. You may also want to read our documentation.
For help in deciding what kind of Droplet you need for your workload, read Choosing the Right Droplet Plan.
Thanks for learning with the DigitalOcean Community. Check out our offerings for compute, storage, networking, and managed databases.
About the author(s)
Still looking for an answer?
This textbox defaults to using Markdown to format your answer.
You can type !ref in this text area to quickly search our full set of tutorials, documentation & marketplace offerings and insert the link!
I switched from my regular Intel droplet to an Intel Premium droplet for the databases, and I’m getting a lot of stuttering on the newer droplet with fewer databases. I’m really trying to understand the problem since the droplet has superior value and performance, it shouldn’t be crashing.
 This work is licensed under a Creative Commons Attribution-NonCommercial- ShareAlike 4.0 International License.
Become a contributor for community
Get paid to write technical tutorials and select a tech-focused charity to receive a matching donation.

DigitalOcean Documentation
Full documentation for every DigitalOcean product.

Resources for startups and AI-native businesses
The Wave has everything you need to know about building a business, from raising funding to marketing your product.
The developer cloud
Scale up as you grow — whether you're running one virtual machine or ten thousand.

Start building today
From GPU-powered inference and Kubernetes to managed databases and storage, get everything you need to build, scale, and deploy intelligent applications.
