By Vadym Kalsin and Brian Hogan

Introduction
Alerta is a web application used to consolidate and de-duplicate alerts from multiple monitoring systems and visualize them on a single screen. Alerta can integrate with many well-known monitoring tools like Nagios, Zabbix, Sensu, InfluxData Kapacitor, and many others.
In this tutorial you’ll set up Alerta and configure it to display notifications from the Zabbix monitoring system.
Prerequisites
To follow this tutorial, you will need:
- Two CentOS 7 servers set up by following the CentOS 7 initial server setup guide, including a sudo non-root user and a firewall.
- On the first CentOS server, which is where you’ll run Zabbix, install the following components:
- Apache, MySQL, and PHP, by following the tutorial How To Install Linux, Apache, MySQL, PHP (LAMP) stack On CentOS 7.
- Zabbix Server, installed by following the tutorial How To Install and Configure Zabbix to Securely Monitor Remote Servers on CentOS 7 and its prerequisites to configure it.
- On the second CentOS server, which is where we’ll install Alerta in this tutorial, install the following components:
- Nginx, installed by following the tutorial How To Install Nginx on CentOS 7.
- MongoDB, installed by following the tutorial How To Install MongoDB on CentOS 7.
- If you wish to secure the Alerta web interface as explained in Step 6, you’ll need a GitHub account that’s part of a GitHub organization. Follow this tutorial to create a GitHub organization.
Step 1 — Installing Alerta’s API Server
Alerta consists of a server and a web interface. The Alerta server is responsible for storing and processing alerts, and serving JSON through an API. The Alerta web interface lets you view the list of alerts in a browser, so you don’t have to interpret the JSON yourself. We’ll install both components on the server where we’ve installed MongoDB and Nginx. We’ll refer to this machine as the Alerta server throughout this tutorial. Log into this machine as your non-root user:
- ssh sammy@your_alerta_server_ip
Before we can install any Alerta components, we need to install pip , the Python package manager, and the Python development files. We’ll also need Git installed so we can retrieve Alerta’s source code from GitHub.
Run the following command to install these software packages:
- sudo yum install python-pip python-devel gcc git
Once these packages install, we are ready to install Alerta.
First we’ll install Alerta’s server using pip :
- sudo pip install alerta-server
Check the installation by running the Alerta server in development mode:
- sudo alertad
You should see something like:
Output * Running on http://0.0.0.0:8080/ (Press CTRL+C to quit)
Note:
If you are using FirewallD, configure it to allow connections to 8080 port:
- sudo firewall-cmd --zone=public --permanent --add-port=8080/tcp
- sudo firewall-cmd --reload
You can learn more about Firewalld in How To Set Up a Firewall Using FirewallD on CentOS 7.
Now you can open http://your_alerta_server_ip:8080 in your browser and see the Alerta API webpage, which will show you some usage examples.
Once you’ve verified the server is running, stop the server by pressing CTRL+C. We’ll configure it as a service shortly.
The Alerta API server is installed, so let’s install the web console.
Step 2 — Installing the Alerta Web UI
Alerta has a dashboard that displays messages in you browser. It displays alert messages in tables, so you can read and sort them easily. You can configure the view to meet your needs: you can filter messages or sort them by any field. In addition, you can view detailed information for each message. We’ll install this on the same server where we installed theAlerta API server.
First get the source code from Github:
- git clone https://github.com/alerta/angular-alerta-webui.git
Then copy the application files into your web server directory:
- sudo mkdir -p /var/www/html/
- sudo cp -r angular-alerta-webui/app/* /var/www/html/
By default, Alerta’s web interface is configured to communicate with the development server API, which is running on port 8080. We’ll set this up for production use by making the Alerta Server’s API available at the /api endpoint on our server, and serve the web console static content from the same domain, which lets us avoid problems with CORS, or HTTPS mixed-content errors.
Open the config.js configuration file:
- sudo vi /var/www/html/config.js
And set the endpoint to /api:
    'use strict';

    angular.module('config', [])
      .constant('config', {
        'endpoint'    : "/api",
        'provider'    : "basic", // google, github, gitlab, keycloak or basic
    ...
Leave the other options at their default values. We will change some of them later in this tutorial when we configure OAuth authorization.
Now all the necessary Alerta components have been installed. We just need to set them up to work together.
Step 3 — Running Alerta with uWSGI Behind Nginx.
We can use the alertad development server for some quick tests, but it’s not good for production use, so let’s fix that. Since Alerta is written in Python, we need to use a WSGI server to run it. In this tutorial we will run Alerta as an uWSGI application proxied behind Nginx, at http://your_alerta_server_ip/api.
First, install the uWSGI application server using the Python package manager:
- sudo pip install uwsgi
Next, create the wsgi.py file, which the application server uses to communicate with our application. Open the file in your editor:
- sudo vi /var/www/wsgi.py
Add the following line to the file, which tells uWSGI how to invoke the Alerta application:
from alerta.app import app
Next, we need to configure the uWSGI server itself. Create a directory where the uWSGI can store its socket file, and make sure the Nginx process can access it:
- sudo mkdir /var/run/alerta
- sudo chown -R nginx.nginx /var/run/alerta/
Then create the configuration file /etc/uwsgi.ini and open it in your editor:
- sudo vi /etc/uwsgi.ini
This file specifies the location of the application, along with the socket options for interacting with Nginx.
Add the following lines to the file:
[uwsgi]
chdir = /var/www
mount = /api=wsgi.py
callable = app
manage-script-name = true

master = true
processes = 5
logger = syslog:alertad

socket = /var/run/alerta/uwsgi.sock
chmod-socket = 664
uid = nginx
gid = nginx
vacuum = true

die-on-term = true
You can see the complete reference list of the uWSGI options in the documentation.
Next, we’ll create a Systemd unit for this application so we can control it using the systemctl command.
- sudo vi /etc/systemd/system/alerta-app.service
This unit file needs some configuration directives that describe the unit and define its behavior. Add the following lines to the file:
[Unit]
Description=uWSGI service for Alerta
After=syslog.target

[Service]
ExecStart=/usr/bin/uwsgi --ini /etc/uwsgi.ini
RuntimeDirectory=uwsgi
Restart=always
KillSignal=SIGQUIT
Type=notify
StandardError=syslog
NotifyAccess=all

[Install]
WantedBy=multi-user.target
You can find more information about these settings and how to work with Systemd units in this Systemd tutorial.
Now you can run the uWSGI service:
- sudo systemctl start alerta-app
You can check the status by running:
- systemctl status alerta-app
You’ll see the following output:
Output    ● alerta-app.service - uWSGI service for Alerta
       Loaded: loaded (/etc/systemd/system/alerta-app.service; disabled; vendor preset: disabled)
       Active: active (running) since Fri 2017-04-07 12:15:21 EEST; 2min 25s ago
     Main PID: 15935 (uwsgi)
       Status: "uWSGI is ready"
       CGroup: /system.slice/alerta-app.service
               ├─15935 /usr/bin/uwsgi --ini /etc/uwsgi.ini
               ├─15946 /usr/bin/uwsgi --ini /etc/uwsgi.ini
               ├─15947 /usr/bin/uwsgi --ini /etc/uwsgi.ini
               ├─15948 /usr/bin/uwsgi --ini /etc/uwsgi.ini
               ├─15949 /usr/bin/uwsgi --ini /etc/uwsgi.ini
               └─15950 /usr/bin/uwsgi --ini /etc/uwsgi.ini
As you can see, the service is disabled by default, which means it won’t start automatically. Enable it:
- sudo systemctl enable alerta-app
Finally, we have to configure Nginx to redirect all requests for your_alerta_server_ip/api to the running uWSGI server and serve the web front-end with Nginx.
Rather than modify the default Nginx config file, we’ll place the Alerta configuration in its own file.
- sudo vi /etc/nginx/conf.d/alerta.conf
Add the following contents to the file. Be sure to replace the value for server_name with your Alerta server’s IP address.
server {
    listen  80;
    server_name  your_alerta_server_ip;

    location /api { try_files $uri @api; }
    location @api {
    include uwsgi_params;
        uwsgi_pass unix:/var/run/alerta/uwsgi.sock;
        proxy_set_header Host $host:$server_port;
        proxy_set_header X-Real-IP $remote_addr;
        proxy_set_header X-Forwarded-For $proxy_add_x_forwarded_for;
    }

    location / {
        root /var/www/html;
    }

    error_page  500 502 503 504  /50x.html;
    location = /50x.html {
        root  /usr/share/nginx/html;
    }
}
You can find more information about Nginx server blocks in this tutorial.
Save the file and exit the editor.
Next, test the Nginx configuration to ensure there are not typos or misconfigurations:
- sudo nginx -t
You’ll see the following output, provided there are no errors with your configuration:
Output    nginx: the configuration file /etc/nginx/nginx.conf syntax is ok
    nginx: configuration file /etc/nginx/nginx.conf test is successful
If you see something different, address the errors and try again.
Now you can reload Nginx to apply new settings:
- sudo nginx -s reload
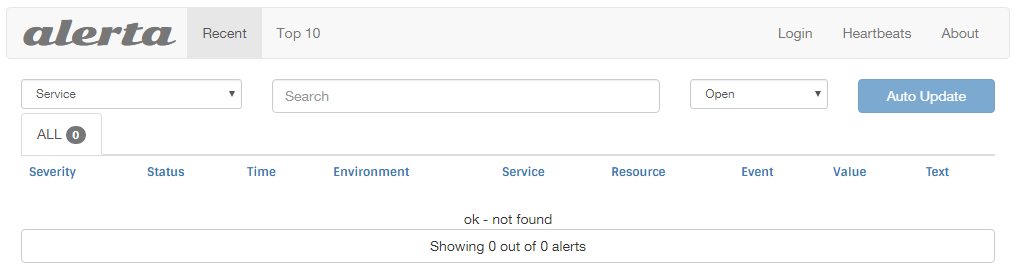
Open http://your_alerta_server_ip link in your browser and see the Alerta dashboard.
If you install Alerta on a publicly-accessible server, you should configure it to require authentication. Let’s look at a couple of methods to do that.
Step 4 — Securing Alerta with Basic Authentication
By default, anyone who knows the address of the Alerta server can view any messages. It’s acceptable for a testing environment, but not for production. To enforce authentication, open the alertad.conf configuration file:
- sudo vi /etc/alertad.conf
Add the following code to the file:
AUTH_REQUIRED = True
SECRET_KEY = 'secret_key'
Set SECRET_KEY to a random string of your choice. Save the file, exit the editor, and restart the uWSGI service:
- sudo systemctl restart alerta-app
Reload the Alerta Web UI webpage and choose the Login link in the menu. You’ll see the message ”Please login to continue”. Click the Create an account link and create a new account. Once you complete the process, you will get access to the Alerta dashboard.
Once you enable authentication, you’ll need an API key to access the Alerta API. Select the Configuration menu and choose API keys.
Enter the name of the application which requires access to the API. For this tutorial, enter zabix. Then select read-write from the dropdown, and click the Create new API Key button. The new key will be created and you will see its details. Copy this key; you will need it later.
Alternatively, you can set up OAuth authentication and use your GitHub or Google credentials to log in to the Alerta user interface. If the Basic authentication is enough, you can skip the next step.
Step 5 — Securing Alerta with OAuth (optional)
Alerta’s Web UI supports OAuth authentication for Google, GitHub, Gitlab, and Keycloak. We’ll configure logging in via a GitHub account, so you’ll need one to proceed.
First, register a new application with GitHub. Log into your GitHub account and navigate to the New Application page..
Fill in the form with the following details:
- Fill in Application name with Alerta or a suitable descriptive name.
- For the Homepage URL, use
http://your_alerta_server_ip/. - Fill in the Authorization callback URL with
http://your_alerta_server_ip/. - Click Register application to save the settings.
- Copy the Client ID and Client Secret values provided on the next screen.
Next, edit the Alerta configuration to enable OAuth authentication. Open the configuration file:
- sudo vi /etc/alertad.conf
Add the following settings at the end of the file:
OAUTH2_CLIENT_ID = 'your_github_client_id'
OAUTH2_CLIENT_SECRET = 'your_github_client_secret'
ALLOWED_GITHUB_ORGS = ['your_github_organization']
Use your GitHub Client ID, GitHub Client Secret, and GitHub Organization for these values, respectively.
Warning: If you omit the GitHub organization option from the command, any GitHub user will be able to log in to your Alerta dashboard. Create a GitHub organization and add the appropriate users to the organization to restrict access.
Save the file, exit the editor, and restart the uWSGI service:
- sudo systemctl restart alerta-app
Then change the authentication provider for the web interface. Edit its configuration file:
- sudo vi /var/www/html/config.js
Find the following section and change the provider from basic to github, and enter your GitHub Client ID:
    ...
        'provider'    : "github",
        'client_id'   : "INSERT-CLIENT-ID-HERE",
    ...
Open http://your_alerta_server_ip to access the Alerta Web UI. This time you’ll see the message ”Please login to continue”. Click the Login button to log in and you’ll be asked to allow the application to access your GitHub account. Once you allow access, you’ll be logged in.
Now we can run a simple test to check if Alerta is set up and functioning correctly.
Step 6 — Sending a Test Message
We will use Alerta’s unified command-line tool to send a test alert. First, install the command-line client:
- sudo pip install alerta
Then create a configuration file that defines the Alerta API endpoint you configured earlier, along with the API key you wish to use. Create a new file in your editor:
- vi ~/.alerta.conf
Paste the following into the file:
[DEFAULT]
endpoint = http://your_alerta_server_ip/api
key=your_alerta_api_key
Use the API key you set up in Step 4 for the key option.
Now we can send a test alert:
- alerta send --resource webserver01 --event down --environment Production --service Website01 --severity major --text "Web server 01 is down." --value ERROR
You’ll see output similar to this:
Output1015fca2-eff6-441d-8c66-6abf9368b830 (indeterminate -> major)
Visit http://your_alerta_server_ip in your browser and you’ll see a message on the dashboard that looks like the one in the following figure:
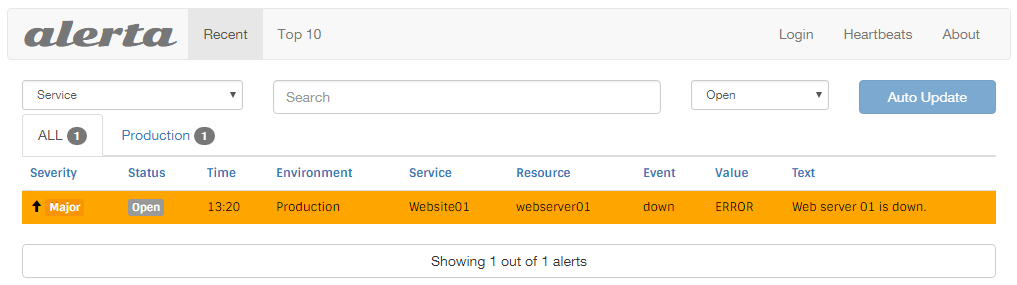
You can click on the message to see the details.
Your Alerta server is up and waiting for new messages. Let’s configure our Zabbix monitoring system to send alerts to Alerta.
Step 7 — Installing the Zabbix-Alerta Gateway
In this step, we’ll modify our Zabbix monitoring system to send notification messages to Alerta.
Log into your Zabbix server machine as your non-root user:
- ssh sammy@your_zabbix_server_ip
By default, Zabbix can send notifications by e-mail, SMS or Jabber messages, but you can add new notification handlers using scripts. The Alerta developers offer a ready-made notification script. To install it, clone the zabbix-alerta repository and install it using the installation script:
- git clone https://github.com/alerta/zabbix-alerta.git
- cd zabbix-alerta
- sudo python setup.py install
Then create a symbolic link for the zabbix-alerta script in the directory where Zabbix stores alerts scripts. You can find its path in the /etc/zabbix/zabbix_server.conf configuration file:
- sudo grep -e '^AlertScriptsPath' /etc/zabbix/zabbix_server.conf
You’ll see output that looks like the following:
OutputAlertScriptsPath=/usr/lib/zabbix/alertscripts
By default, Zabbix looks for scripts in /usr/lib/zabbix/alertscripts. Execute the following command to create the symlink:
- sudo ln -s `which zabbix-alerta` /usr/lib/zabbix/alertscripts
Let’s configure the Alerta integration. Log in into your Zabbix web interface at http://your_zabbix_server_ip/zabbix/.
In the main menu, click Administration, select Media Types, and click the Create Media Type button in the top right corner.
Fill out the form with the following details:
- For Name, enter
Alerta. - For Type, select Script from the dropdown.
- For Script name, enter
zabbix-alerta. - For Script parameters, enter the following values:
{ALERT.SENDTO}{ALERT.SUBJECT}{ALERT.MESSAGE}
- Ensure the Enabled checkbox is checked.
Click the Add button to create the new media type.
Then add new media for your user account. Select Administration in the main menu, then choose Users. Click your user name and select the Media tab. Enter the following details
- For Type, select Alerta.
- For Send to, enter
http://your_alerta_server_ip/api;your_api_key.
Use the API key you created in Step 4.
Save the configuration by clicking the Update button.
Now configure an action to send messages. Select Configuration in the main menu, then select Actions. Click the Create Action button.
On the Action tab, set the Name field’s value to Forward to Alerta.
On the Operations tab, set the following options:
-
Set Default subject to
{TRIGGER.STATUS}: {TRIGGER.NAME} -
For Default message, enter the following text:
Default messageresource={HOST.NAME1}
event={ITEM.KEY1}
environment=Production
severity={TRIGGER.SEVERITY}
status={TRIGGER.STATUS}
ack={EVENT.ACK.STATUS}
service={TRIGGER.HOSTGROUP.NAME}
group=Zabbix
value={ITEM.VALUE1}
text={TRIGGER.STATUS}: {TRIGGER.NAME}
tags={EVENT.TAGS}
attributes.ip={HOST.IP1}
attributes.thresholdInfo={TRIGGER.TEMPLATE.NAME}: {TRIGGER.EXPRESSION}
type=zabbixAlert
dateTime={EVENT.DATE}T{EVENT.TIME}Z
Zabbix will send messages in the specified format when it detects a problem. It will replace the expressions in curly brackets with the corresponding values. All these fields are necessary for Alerta to receive the alert and display it correctly.
Next, create a new operation by clicking New in the Operations field. nter the following values into the form:
- For Send to Users, enter
Your user name. - For Send only to, select Alerta from the dropdown box.
Then select the Recovery operations tab and change the Default message to the following:
Recovery operationsresource={HOST.NAME1}
event={ITEM.KEY1}
environment=Production
severity={TRIGGER.SEVERITY}
status={TRIGGER.STATUS}
ack={EVENT.ACK.STATUS}
service={TRIGGER.HOSTGROUP.NAME}
group=Zabbix
value={ITEM.VALUE1}
text={TRIGGER.STATUS}: {ITEM.NAME1}
tags={EVENT.RECOVERY.TAGS}
attributes.ip={HOST.IP1}
attributes.thresholdInfo={TRIGGER.TEMPLATE.NAME}: {TRIGGER.EXPRESSION}
attributes.moreInfo=<a href="http://x.x.x.x/tr_events.php?triggerid={TRIGGER.ID}&eventid={EVENT.RECOVERY.ID}">Zabbix console</a>
type=zabbixAlert
dateTime={EVENT.RECOVERY.DATE}T{EVENT.RECOVERY.TIME}Z
This message is similar to the previous message. This message will be sent when the problem disappears.
Complete the configuration by clicking the Add button.
Zabbix is ready to send alerts to Alerta. Let’s generate one.
Step 8 — Generating a Test Alert to Verify Zabbix-Alerta Integration
Let’s generate a test alert to ensure everything is connected. By default, Zabbix keeps track of the amount of free disk space on your server. We’ll create a temporary file that’s large enough to trigger Zabbix’s file system usage alert.
Log in to your Zabbix server if you’re not already connected.
Next, determine how much free space you have on the server. You can use the df command to find out:
- df -h
You’ll see output like the following:
Output    Filesystem      Size  Used Avail Use% Mounted on
    /dev/vda1        20G  1.5G   18G   9% /
We are interested in the amount of free space. In this case, the free space is 18GB. Your free space may differ.
Use the fallocate command to create a file that takes up more than 80% of the available disk space, which should be enough to trigger the alert:
- fallocate -l 16G /tmp/temp.img
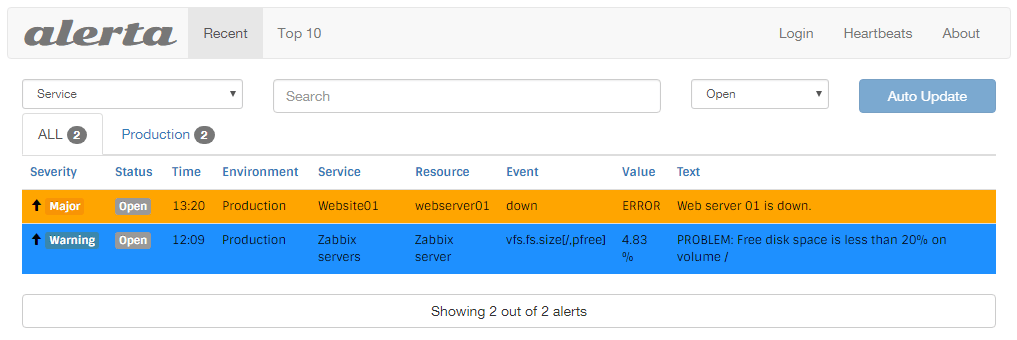
Within a few minutes, Zabbix will trigger an alert about the amount of free disk space and will run the action we configured, sending the notification message to Alerta. You will see this new notification in the Alerta dashboard.
Now that you know the alerts are working, delete the temporary file you created so you can reclaim your disk space:
- rm -f /tmp/temp.img
After a minute Zabbix will send the recovery message. The alert will disappear from main dashboard, but you can view all closed events by selecting Closed.
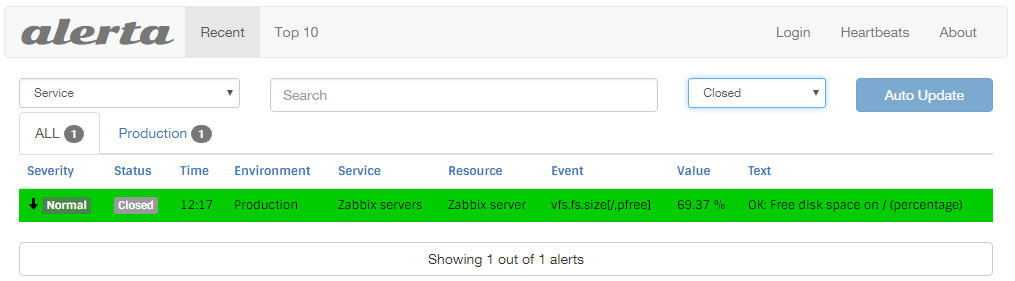
You can click on the event row to view more details.
Conclusion
In this tutorial, you installed and configured Alerta, and set up Zabbix to send notifications into it. As a result, you now have a convenient tool to track alerts. In the future, you can add other sources of notifications, thereby consolidating and centralizing information from various monitoring systems.
Thanks for learning with the DigitalOcean Community. Check out our offerings for compute, storage, networking, and managed databases.
About the author(s)
Monitoring engineer
Managed the Write for DOnations program, wrote and edited community articles, and makes things on the Internet. Expertise in DevOps areas including Linux, Ubuntu, Debian, and more.
Still looking for an answer?
This textbox defaults to using Markdown to format your answer.
You can type !ref in this text area to quickly search our full set of tutorials, documentation & marketplace offerings and insert the link!
hello , i’m facing an error when i try to start alerta-app : sudo systemctl alerta-app :
it looks like , can’t import the name app from alert-app.
how to fix this problem ? pr 15 09:41:33 localhost.localdomain alertad[15656]: ed. Apr 15 09:41:33 localhost.localdomain alertad[15656]: INFO:flask.app:Server webhook ‘telegram’ loaded. Apr 15 09:41:33 localhost.localdomain alertad[15656]: Traceback (most recent call last): Apr 15 09:41:33 localhost.localdomain alertad[15656]: File “wsgi.py”, line 1, in <module> Apr 15 09:41:33 localhost.localdomain alertad[15656]: from alerta.app import app Apr 15 09:41:33 localhost.localdomain alertad[15656]: ImportError: cannot import name ‘app’ Apr 15 09:41:33 localhost.localdomain alertad[15656]: VACUUM: unix socket /var/run/alerta/uwsgi.sock removed. Apr 15 09:41:33 localhost.localdomain systemd[1]: alerta-app.service holdoff time over, scheduling restart. Apr 15 09:41:33 localhost.localdomain systemd[1]: Stopped uWSGI service for Alerta. – Subject: Unit alerta-app.service has finished shutting down – Defined-By: systemd – Support: http://lists.freedesktop.org/mailman/listinfo/systemd-devel
– Unit alerta-app.service has finished shutting down. Apr 15 09:41:33 localhost.localdomain systemd[1]: Starting uWSGI service for Alerta… – Subject: Unit alerta-app.service has begun start-up – Defined-By: systemd – Support: http://lists.freedesktop.org/mailman/listinfo/systemd-devel
– Unit alerta-app.service has begun starting up. Apr 15 09:41:33 localhost.localdomain uwsgi[15680]: [uWSGI] getting INI configuration from /etc/uwsgi.ini
 This work is licensed under a Creative Commons Attribution-NonCommercial- ShareAlike 4.0 International License.
Become a contributor for community
Get paid to write technical tutorials and select a tech-focused charity to receive a matching donation.

DigitalOcean Documentation
Full documentation for every DigitalOcean product.

Resources for startups and AI-native businesses
The Wave has everything you need to know about building a business, from raising funding to marketing your product.
The developer cloud
Scale up as you grow — whether you're running one virtual machine or ten thousand.

Start building today
From GPU-powered inference and Kubernetes to managed databases and storage, get everything you need to build, scale, and deploy intelligent applications.
