
Introduction
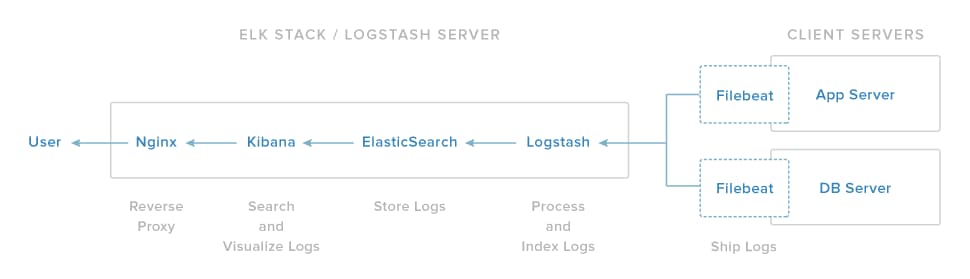
This tutorial is an ELK Stack (Elasticsearch, Logstash, Kibana) troubleshooting guide. It assumes that you followed the How To Install Elasticsearch, Logstash, and Kibana (ELK Stack) on Ubuntu 14.04 tutorial, but it may be useful for troubleshooting other general ELK setups.
This tutorial is structured as a series of common issues, and potential solutions to these issues, along with steps to help you verify that the various components of your ELK stack are functioning properly. As such, feel free to jump around to the sections that are relevant to the issues you are encountering.
Issue: Kibana No Default Index Pattern Warning
When accessing Kibana via a web browser, you may encounter a page with this warning:
Kibana warning:Warning No default index pattern. You must select or create one to continue.
...
Unable to fetch mapping. Do you have indices matching the pattern?
Here is a screenshot of the warning:
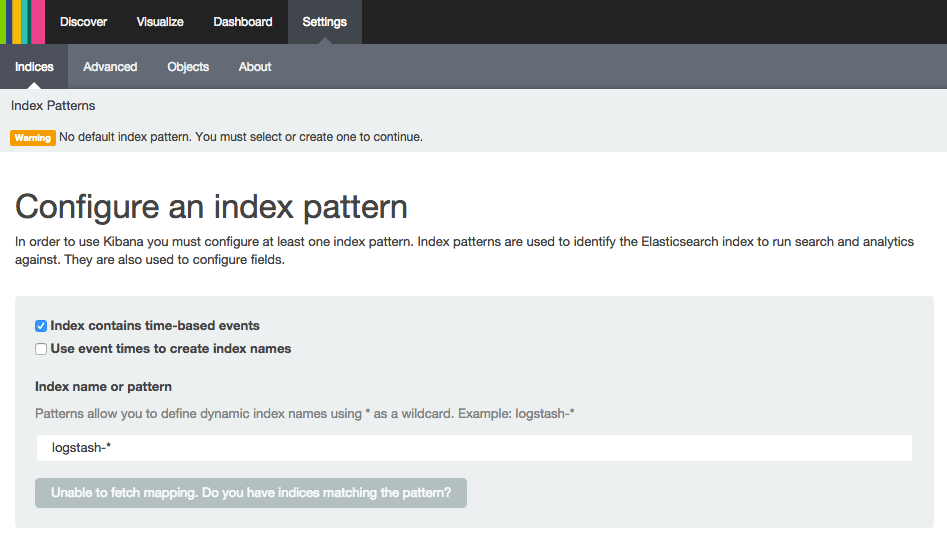
“Unable to fetch mapping” indicates that Elasticsearch does not contain any entries that match the default logstash-* pattern. Typically, this means that your logs are not being stored in Elasticsearch due to communication issues from Logstash to Elasticsearch, and/or from your log shipper (e.g. Filebeat) to Logstash. In other words, your logs aren’t making it through the chain from Filebeat, to Logstash, to Elasticsearch for some reason.
To resolve communication issues between Logstash and Elasticsearch, run through the Logstash troubleshooting sections. To resolve communication issues between Filebeat and Logstash, run through the Filebeat troubleshooting sections.
If you configured Logstash to use a non-default index pattern, you can resolve the issue by specifying the proper index pattern in the text box.
Issue: Kibana Unable to connect to Elasticsearch
When accessing Kibana via a web browser, you may encounter a page with this error:
Kibana error:Fatal Error
Kibana: Unable to connect to Elasticsearch

Error: Unable to connect to Elasticsearch
Error: Bad Gateway
...
Here is a screenshot of the error:
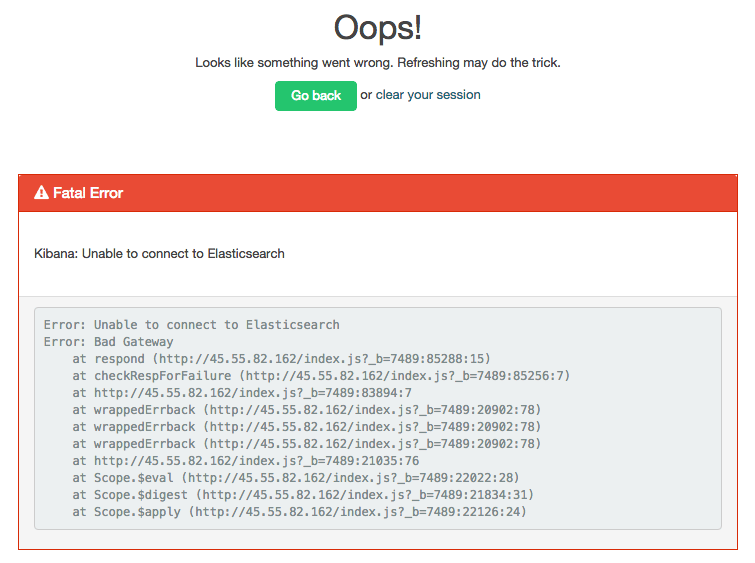
This means that Kibana can’t connect to Elasticsearch. Elasticsearch may not be running, or Kibana may be configured to look for Elasticsearch on the wrong host and port.
To resolve this issue, make sure that Elasticsearch is running by following the Elasticsearch troubleshooting sections. Then ensure that Kibana is configured to connect to the host and port that Elasticsearch is running on.
For example, if Elasticsearch is running on localhost on port 9200, make sure that Kibana is configured appropriately.
Open the Kibana configuration file:
- sudo vi /opt/kibana/config/kibana.yml
Then make sure elasticsearch_url is set properly.
/opt/kibana/config/kibana.yml excerpt:# The Elasticsearch instance to use for all your queries.
elasticsearch_url: "http://localhost:9200"
Save and exit.
Now restart the Kibana service to put your changes into place:
- sudo service kibana restart
After Kibana has restarted, open Kibana in a web browser and verify that the error was resolved.
Issue: Kibana Is Not Accessible
The Nginx component of the ELK stack serves as a reverse proxy to Kibana. If Nginx is not running or configured properly, you will not be able to access the Kibana interface. However, as the rest of the ELK components don’t rely on Nginx, they may very well be functioning fine.
Cause: Nginx Is Not Running
If Nginx isn’t running, and you try to access your ELK stack in a web browser, you may see an error that is similar to this:
Nginx Error:This webpage is not available
ERR_CONNECTION_REFUSED
This usually indicates that Nginx isn’t running.
You can check the status of the Nginx service with this command:
- sudo service nginx status
If it reports that the service is not running or not recognized, resolve your issue by following the instructions of the Install Nginx section of the ELK stack tutorial. If it reports that the service is running, you need to reconfigure Nginx, following the same instructions.
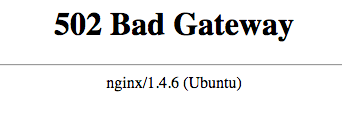
Cause: Nginx Is Running But Can’t Connect to Kibana
If Kibana is not accessible, and you receive a 502 Bad Gateway error, Nginx is running but it’s unable to connect to Kibana.
The first step to resolving this issue is to check if Kibana is running with this command:
- sudo service kibana status
If Kibana isn’t running or not recognized, follow the instructions of the Install Kibana section of the ELK stack tutorial.
If that doesn’t resolve the issue, you may have an issue with your Nginx configuration. You should review the configuration portion of the Install Nginx section of the ELK stack tutorial. You can check the Nginx error logs for clues:
- sudo tail /var/log/nginx/error.log
This should tell you exactly why Nginx can’t connect to Kibana.
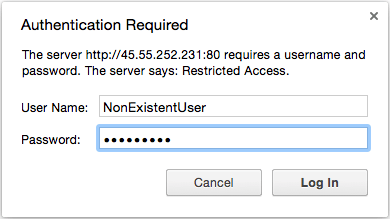
Cause: Unable to Authenticate User
If you have basic authentication enabled, and you are having trouble passing the authentication step, you should look at the Nginx error logs to determine the specifics of the problem.
To look at the recent Nginx errors, use this command:
- sudo tail /var/log/nginx/error.log
If you see a user was not found error, the user does not exist in the htpasswd file. This type of error is indicated by the following log entry:
Nginx error logs (user was not found):2015/10/26 12:11:57 [error] 3933#0: *242 user "NonExistentUser" was not found in "/etc/nginx/htpasswd.users", client: 108.60.145.130, server: example.com, request: "GET / HTTP/1.1", host: "45.55.252.231"
If you see a password mismatch error, the user exists but you supplied the incorrect password. This type of error is indicated by the following log entry:
Nginx error logs (user password mismatch):2015/10/26 12:12:56 [error] 3933#0: *242 user "kibanaadmin": password mismatch, client: 108.60.145.130, server: example.com, request: "GET / HTTP/1.1", host: "45.55.252.231"
The resolution to these two errors is to either provide the proper login information, or modify your existing htpasswd file with user logins that you expect to exist. For example, to create or overwrite a user called kibanaadmin in the htpasswd.users file, use this command:
- sudo htpasswd /etc/nginx/htpasswd.users kibanaadmin
Then supply your desired password, and confirm it.
If you see a No such file or directory error, the htpasswd file specified in the Nginx configuration does not exist. This type of error is indicated by the following log entry:
Nginx error logs (htpasswd file does not exist):2015/10/26 12:17:38 [error] 3933#0: *266 open() "/etc/nginx/htpasswd.users" failed (2: No such file or directory), client: 108.60.145.130, server: example.com, request: "GET / HTTP/1.1", host: "45.55.252.231"
Here, you should create a new /etc/nginx/htpasswd.users file, and add a user (kibanaadmin in this example) to it, with this command:
sudo htpasswd -c /etc/nginx/htpasswd.users kibanaadmin
Enter a new password, and confirm it.
Now, try authenticating as the user you just created.
Logstash: How To Check If It is Running
If Logstash isn’t running, you won’t be able to receive and parse logs from log shippers, such as Filebeat, and store the processed logs in Elasticsearch. This section will show you how to check if Logstash is functioning normally.
Verify Service is Running
The most basic thing to check is the status of the Logstash status:
- sudo service logstash status
If Logstash is running, you will see this output:
Logstash status (OK):logstash is running
Otherwise, if the service is not running, you will see this message:
Logstash status (Bad):logstash is not running
If Logstash isn’t running, try starting it with this command:
- sudo service logstash start
Then check its status again, after several seconds. Logstash is a Java application and it will report as “running” for a few seconds after every start attempt, so it is important to wait a few seconds before checking for a “not running” status. If it reports as “not running”, it is probably misconfigured. The next two sections cover troubleshooting common Logstash issues.
Issue: Logstash is Not Running
If Logstash is not running, there are a few potential causes. This section will cover a variety of common cases where Logstash will fail to run, and propose potential solutions.
Cause: Configuration Contains a Syntax Error
If Logstash has errors in its configuration files, which are located in the /etc/logstash/conf.d directory, the service will not be able to start properly. The best thing to do is check the Logstash logs for clues about why it is failing.
Open two terminal sessions to your server, so you can view the Logstash logs while trying to start the service.
In the first terminal session, we’ll look at the logs:
- tail -f /var/log/logstash/logstash.log
This will display the last few log entries, plus any future log entries.
In the second terminal session, try to start the Logstash service:
- sudo service logstash start
Switch back to the first terminal session to look at the logs that are generated when Logstash is starting up.
If you see log entries that include error messages, try and read the message(s) to figure out what is going wrong. Here is an example of the error logs you might see if the Logstash configuration has a syntax error (mismatched curly braces):
Logstash logs (Syntax error):...
{:timestamp=>"2015-10-28T11:51:09.205000-0400", :message=>"Error: Expected one of #, => at line 12, column 6 (byte 209) after input {\n  lumberjack {\n    port => 5043\n    type => \"logs\"\n    ssl_certificate => \"/etc/pki/tls/certs/logstash-forwarder.crt\"\n    ssl_key => \"/etc/pki/tls/private/logstash-forwarder.key\"\n  \n}\n\n\nfilter {\n  if "}
{:timestamp=>"2015-10-28T11:51:09.228000-0400", :message=>"You may be interested in the '--configtest' flag which you can\nuse to validate logstash's configuration before you choose\nto restart a running system."}
The last message that says that we might be interested in validating the configuration indicates that the configuration contains a syntax error. The previous message provides a more specific error message, in this case, that there is a missing closing curly brace in the input section of the configuration. To resolve this issue, edit the offending portion of your Logstash configuration:
- sudo vi /etc/logstash/conf.d/01-lumberjack-input.conf
Find the line that has the bad entry, and fix it, then save and exit.
Now, on the second terminal, start the Logstash service:
- sudo service logstash start
If the issue has been resolved, there should be no new log entries (Logstash doesn’t log a successful startup). After several seconds, check the status of the Logstash service:
- sudo service logstash status
If it’s running, you have resolved the issue.
You may have a different configuration problem than our example. We will cover a few other common Logstash configuration issues. As always, if you’re able to figure out what the error means, try and fix it yourself.
Cause: SSL Files Do Not Exist
Another common cause for Logstash not running is problem with the SSL certificate and key files. For example, if they don’t exist where your Logstash configuration specifies them to, your logs will show an error like this:
Logstash logs (SSL key file does not exist):{:timestamp=>"2017-12-01T16:51:31.656000+0000", :message=>"Invalid setting for beats input plugin:\n\n  input {\n    beats {\n      # This setting must be a path\n      # File does not exist or cannot be opened /etc/pki/tls/certs/logstash-forwarder.crt\n      ssl_certificate => \"/etc/pki/tls/certs/logstash-forwarder.crt\"\n      ...\n    }\n  }", :level=>:error}
{:timestamp=>"2017-12-01T16:51:31.671000+0000", :message=>"Invalid setting for beats input plugin:\n\n  input {\n    beats {\n      # This setting must be a path\n      # File does not exist or cannot be opened /etc/pki/tls/private/logstash-forwarder.key\n      ssl_key => \"/etc/pki/tls/private/logstash-forwarder.key\"\n      ...\n    }\n  }", :level=>:error}
{:timestamp=>"2017-12-01T16:51:31.685000+0000", :message=>"Error: Something is wrong with your configuration.", :level=>:error}
To resolve this particular issue, you need to make sure that you have an SSL key file (generate one if you forgot to), and that it is placed in the proper location (/etc/pki/tls/private/logstash-forwarder.key, in the example). If you already do have a key file, make sure to move it to the proper location, and ensure that the Logstash configuration is pointing to it.
Now, start the Logstash service:
- sudo service logstash start
If the issue has been resolved, there should be no new log entries. After several seconds, check the status of the Logstash service:
- sudo service logstash status
If it’s running, you have resolved the issue.
Issue: Logstash Is Running but Not Storing Logs in Elasticsearch
If Logstash is running but not storing logs in Elasticsearch, it is because it can’t reach Elasticsearch. Typically, this is a result of Elasticsearch not running. If this is a case, the Logstash logs will show error messages like this:
Logstash logs (Elasticsearch isn't running):{:timestamp=>"2017-12-01T16:53:29.571000+0000", :message=>"Connection refused (Connection refused)", :class=>"Manticore::SocketException", :backtrace=>[ruby-backtrace-info-here], :level=>:error}
In this case, ensure that Elasticsearch is running by following the Elasticsearch troubleshooting steps.
You may also see errors like this:
Logstash logs (Logstash is configured to send its output to the wrong host):{:timestamp=>"2017-12-01T16:56:26.274000+0000", :message=>"Attempted to send a bulk request to Elasticsearch configured at '[\"http://localhost:9200/\"]', but Elasticsearch appears to be unreachable or down!", :error_message=>"Connection refused (Connection refused)", :class=>"Manticore::SocketException", :client_config=>{:hosts=>["http://localhost:9200/"], :ssl=>nil, :transport_options=>{:socket_timeout=>0, :request_timeout=>0, :proxy=>nil, :ssl=>{}}, :transport_class=>Elasticsearch::Transport::Transport::HTTP::Manticore, :logger=>nil, :tracer=>nil, :reload_connections=>false, :retry_on_failure=>false, :reload_on_failure=>false, :randomize_hosts=>false}, :level=>:error}
{:timestamp=>"2017-12-01T16:57:49.090000+0000", :message=>"SIGTERM received. Shutting down the pipeline.", :level=>:warn}
This indicates that the output section of your Logstash configuration may be pointing to the wrong host. To resolve this issue, ensure that Elasticsearch is running, and check your Logstash configuration:
- sudo vi /etc/logstash/conf.d/30-elasticsearch-output.conf
Verify that the hosts => ["localhost:9200"] line is pointing to the host that is running Elasticsearch
Logstash output configuration excerptoutput {
  elasticsearch {
    hosts => ["localhost:9200"]
    sniffing => true
. . .
Save and exit. This example assumes that Elasticsearch is running on localhost.
Restart the Logstash service.
- sudo service logstash restart
Then check the Logstash logs for any errors.
Filebeat: How To Check If It is Running
Filebeat runs on your Client machines, and ships logs to your ELK server. If Filebeat isn’t running, you won’t be able to send your various logs to Logstash. As a result, the logs will not get stored in Elasticsearch, and they will not appear in Kibana. This section will show you how to check if Filebeat is functioning normally.
Verify Logs Are Successfully Being Shipped
The easiest way to tell if Filebeat is properly shipping logs to Logstash is to check for Filebeat errors in the syslog log.
- sudo tail /var/log/syslog | grep filebeat
If everything is set up properly, you should see some log entries when you stop or start the Filebeat process, but nothing else.
If you don’t see any log entries, you should verify that Filebeat is running.
Verify Service is Running
The most basic thing to check is the status of Filebeat:
- sudo service filebeat status
If Filebeat is running, you will see this output:
Output* filebeat is running
Otherwise, if the service is not running, you will see this message:
Output * filebeat is not running
If Filebeat isn’t running, try starting it with this command:
- sudo service filebeat start
Then check the status again. If this doesn’t resolve the problem, the following sections will help you troubleshoot your Filebeat problems. We’ll cover common Filebeat issues, and how to resolve them.
Issue: Filebeat is Not Running
If Filebeat is not running on your client machine, there are several potential causes. This section will cover a variety of common cases where Filebeat will fail to run, and propose potential solutions.
Cause: Configuration Contains a Syntax Error
If Filebeat has errors in its configuration file, which is located at /etc/filebeat/filebeat.yml, the service will not be able to start properly. It will immediately exit with errors like the following:
OutputLoading config file error: YAML config parsing failed on /etc/filebeat/filebeat.yml: yaml: line 13: could not find expected ':'. Exiting.
In this case, there is a typo in the configuration file. To resolve this issue, edit the offending portion of the Filebeat configuration. For guidance, follow the Configure Filebeat subsection of the Set Up Filebeat (Add Client Servers)) of the ELK stack tutorial.
After editing the Filebeat configuration, attempt to start the service again:
- sudo service filebeat start
If you see no error output, the issue is resolved.
Cause: SSL Certificate is Missing or Invalid
Communications between Filebeat and Logstash require an SSL certificate for authentication and encryption. If Filebeat is not starting properly, you should check the syslog for errors similar to the following:
OutputError Initialising publisher: open /etc/pki/tls/certs/logstash-forwarder.crt: no such file or directory
This indicates that the logstash-forwarder.crt file is not in the appropriate location. To resolve this issue, copy the SSL certificate from the ELK server to your client machine by following the appropriate subsections of the Set Up Filebeat (Add Client Servers) section of the ELK stack tutorial.
After placing the appropriate SSL certificate file in the proper location, try starting Filebeat again.
If the SSL certificate is invalid, the logs should look like this:
syslog (Certificate is invalid):transport.go:125: SSL client failed to connect with: x509: certificate signed by unknown authority (possibly because of "crypto/rsa: verification error" while trying to verify candidate authority certificate "elk.example.com")
Note that the error message indicates that the certificate exists, but is invalid. In this case, you need to follow the Generate SSL Certificates section of the ELK stack tutorial, then copy the SSL certificate to the client machine (Set Up Filebeat (Add Client Servers)).
After ensuring that the certificate is valid, and that it is in the proper location, you will need to restart Logstash (on the ELK server) to force it to use the new SSL key:
- sudo service logstash restart
Then start Filebeat (on the client machine):
- sudo service filebeat start
Check the logs again, to make sure the issue has been resolved.
Issue: Filebeat Can’t Connect to Logstash
If Logstash (on the ELK server) is not reachable by Filebeat (your client server), you will see error log entries like this:
syslog (Connection refused):transport.go:125: SSL client failed to connect with: dial tcp 203.0.113.4:5044: getsockopt: connection refused
Common reasons for Logstash being unreachable include the following:
- Logstash is not running (on the ELK server)
- Firewalls on either server are blocking the connection on port
5043 - Filebeat is not configured with the proper IP address, hostname, or port
To resolve this issue, first verify that Logstash is running on the ELK server by following the Logstash troubleshooting sections of this guide. Second, verify that the firewall is not blocking the network traffic. Third, verify that Filebeat is configured with the correct IP address (or hostname) and port of the ELK server.
The Filebeat configuration can be edited with this command:
- sudo vi /etc/filebeat/filebeat.yml
After verifying that the Logstash connection information is correct, try restarting Filebeat:
sudo service filebeat restart
Check the Filebeat logs again, to make sure the issue has been resolved.
For general Filebeat guidance, follow the Configure Filebeat subsection of the Set Up Filebeat (Add Client Servers) of the ELK stack tutorial.
Elasticsearch: How To Check If It is Running
If Elasticsearch isn’t running, none of your ELK stack will function. Logstash will not be able to add new logs to Elasticsearch, and Kibana will not be able to retrieve logs from Elasticsearch for reporting. This section will show you how to check if Elasticsearch is functioning normally.
Verify Service is Running
The most basic thing to check is the status of the Elasticsearch service:
- sudo service elasticsearch status
If Elasticsearch is running, you will see this output:
Elasticsearch status (OK): * elasticsearch is running
Otherwise, if the service is not running, you will see this message:
Elasticsearch status (Bad): * elasticsearch is not running
In this case, you should follow the next few sections, which cover troubleshooting Elasticsearch.
Verify that it Responds to HTTP Requests
By default, Elasticsearch responds to HTTP requests on port 9200 (this can be customized, in its configuration file, by specifying a new http.port value). We can use curl to send requests to, and retrieve useful information from Elasticsearch.
Send an HTTP GET request using curl with this command (assuming that your Elasticsearch can be reached at localhost):
- curl localhost:9200
If Elasticsearch is running, you should see a response that looks something like this:
Output{
  "name" : "Hildegarde",
  "cluster_name" : "elasticsearch",
  "cluster_uuid" : "E8q9kr-0RxycYhSLNx8xeA",
  "version" : {
    "number" : "2.4.6",
    "build_hash" : "5376dca9f70f3abef96a77f4bb22720ace8240fd",
    "build_timestamp" : "2017-07-18T12:17:44Z",
    "build_snapshot" : false,
    "lucene_version" : "5.5.4"
  },
  "tagline" : "You Know, for Search"
}
You may also check the health of your Elasticsearch cluster with this command:
curl localhost:9200/_cluster/health?pretty
Your output should look something like this:
Output{
  "cluster_name" : "elasticsearch",
  "status" : "yellow",
  "timed_out" : false,
  "number_of_nodes" : 1,
  "number_of_data_nodes" : 1,
  "active_primary_shards" : 6,
  "active_shards" : 6,
  "relocating_shards" : 0,
  "initializing_shards" : 0,
  "unassigned_shards" : 6,
  "delayed_unassigned_shards" : 0,
  "number_of_pending_tasks" : 0,
  "number_of_in_flight_fetch" : 0,
  "task_max_waiting_in_queue_millis" : 0,
  "active_shards_percent_as_number" : 50.0
}
Note that if your Elasticsearch cluster consists of a single node, your cluster will probably have a yellow status. This is normal for a single node cluster; you can upgrade to a green status by adding at least one more node to your Elasticsearch cluster.
Issue: Elasticsearch is Not Running
If Elasticsearch is not running, there are many potential causes. This section will cover a variety of common cases where Elasticsearch will fail to run, and propose potential solutions.
Cause: It Was Never Started
If Elasticsearch isn’t running, it may not have been started in the first place; Elasticsearch does not start automatically after installation. The solution to this is to manually start it the first time:
- sudo service elasticsearch start
This should report that Elasticsearch is starting. Wait about 10 seconds, then check the status of the Elasticsearch status again.
Cause: Elasticsearch service was not enabled, and the server rebooted
If Elasticsearch was working fine but doesn’t work anymore, it may not be enabled properly. By default, the Elasticsearch service is not enabled to start on boot, you must explicity enable Elasticsearch to start automatically on boot:
- sudo update-rc.d elasticsearch defaults 95 10
Elasticsearch should now automatically start on boot. Test that it works by rebooting your server.
Cause: Elasticsearch is Misconfigured
If Elasticsearch has errors in its configuration file, which is located at /etc/elasticsearch/elasticsearch.yml, the service will not be able to start properly. The best thing to do is check the Elasticsearch error logs for clues about why it is failing.
Open two terminal sessions to your server, so you can view the Elasticsearch logs while trying to start the service.
In the first terminal session, we’ll look at the logs:
- tail -f /var/log/elasticsearch/elasticsearch.log
This will display the last few log entries, plus any future log entries.
In the second terminal session, try to start the Elasticsearch service:
- sudo service elasticsearch start
Switch back to the first terminal session to look at the logs that are generated when Elasticsearch is starting up.
If you see log entries that indicate errors or exceptions (e.g. ERROR, Exception, or error), try and find a line that indicates what caused the error. Here is an example of the error logs you will see if the Elasticsearch network.host is set to a hostname or IP address that is not resolvable:
Elasticsearch logs (Bad):...
[2015-10-27 15:24:43,495][INFO ][node                     ] [Shadrac] starting ...
[2015-10-27 15:24:43,626][ERROR][bootstrap                ] [Shadrac] Exception
org.elasticsearch.transport.BindTransportException: Failed to resolve host [null]
	at org.elasticsearch.transport.netty.NettyTransport.bindServerBootstrap(NettyTransport.java:402)
	at org.elasticsearch.transport.netty.NettyTransport.doStart(NettyTransport.java:283)
	at org.elasticsearch.common.component.AbstractLifecycleComponent.start(AbstractLifecycleComponent.java:85)
	at org.elasticsearch.transport.TransportService.doStart(TransportService.java:153)
	at org.elasticsearch.common.component.AbstractLifecycleComponent.start(AbstractLifecycleComponent.java:85)
	at org.elasticsearch.node.internal.InternalNode.start(InternalNode.java:257)
	at org.elasticsearch.bootstrap.Bootstrap.start(Bootstrap.java:160)
	at org.elasticsearch.bootstrap.Bootstrap.main(Bootstrap.java:248)
	at org.elasticsearch.bootstrap.Elasticsearch.main(Elasticsearch.java:32)
Caused by: java.net.UnknownHostException: incorrect_hostname: unknown error
...
Note that the last line of the example logs indicates that an UnknownHostException: incorrect_hostname error has occurred. This particular example indicates that the network.host is set to incorrect_hostname, which doesn’t resolve to anything. In a single-node Elasticsearch setup, this should be set to localhost or 127.0.0.1.
To resolve this issue, edit the Elasticsearch configuration file:
- sudo vi /etc/elasticsearch/elasticsearch.yml
Find the line that has the bad entry, and fix it. In the case of the example, we should look for the line that specifies network.host: incorrect_hostname and change it so it looks like this:
...
network.host: localhost
...
Save and exit.
Now, on the second terminal, start the Elasticsearch service:
- sudo service elasticsearch start
If the issue has been resolved, you should see error-free logs that indicate that Elasticsearch has started. It might look something like this:
Elasticsearch logs (Good):...
[2015-10-27 15:29:21,980][INFO ][node                     ] [Garrison Kane] initializing ...
[2015-10-27 15:29:22,084][INFO ][plugins                  ] [Garrison Kane] loaded [], sites []
[2015-10-27 15:29:22,124][INFO ][env                      ] [Garrison Kane] using [1] data paths, mounts [[/ (/dev/vda1)]], net usable_space [52.1gb], net total_space [58.9gb], types [ext4]
[2015-10-27 15:29:24,532][INFO ][node                     ] [Garrison Kane] initialized
[2015-10-27 15:29:24,533][INFO ][node                     ] [Garrison Kane] starting ...
[2015-10-27 15:29:24,646][INFO ][transport                ] [Garrison Kane] bound_address {inet[/127.0.0.1:9300]}, publish_address {inet[localhost/127.0.0.1:9300]}
[2015-10-27 15:29:24,682][INFO ][discovery                ] [Garrison Kane] elasticsearch/WJvkRFnbQ5mLTgOatk0afQ
[2015-10-27 15:29:28,460][INFO ][cluster.service          ] [Garrison Kane] new_master [Garrison Kane][WJvkRFnbQ5mLTgOatk0afQ][elk-run][inet[localhost/127.0.0.1:9300]], reason: zen-disco-join (elected_as_master)
[2015-10-27 15:29:28,561][INFO ][http                     ] [Garrison Kane] bound_address {inet[/127.0.0.1:9200]}, publish_address {inet[localhost/127.0.0.1:9200]}
[2015-10-27 15:29:28,562][INFO ][node                     ] [Garrison Kane] started
...
Now if you check the Elasticsearch status, and you should see that it is running fine.
You may have a different configuration problem than our example. If you’re able to figure out what the error means, try and fix it yourself. If that fails, try and search the Internet for individual error lines that do not contain information that is specific to your server (e.g. the IP address, or the automatically generated Elasticsearch node name).
Conclusion
Hopefully this troubleshooting guide has helped you resolve any issues you were having with your ELK stack setup. If you have any questions or suggestions, leave them in the comments below!
Thanks for learning with the DigitalOcean Community. Check out our offerings for compute, storage, networking, and managed databases.
About the author
Software Engineer @ DigitalOcean. Former Señor Technical Writer (I no longer update articles or respond to comments). Expertise in areas including Ubuntu, PostgreSQL, MySQL, and more.
Still looking for an answer?
This textbox defaults to using Markdown to format your answer.
You can type !ref in this text area to quickly search our full set of tutorials, documentation & marketplace offerings and insert the link!
Thanks for the Troubleshooting guide! Do you perhaps know how to fix a problem with the Watcher 2.0? I’m trying to setup a watcher with a slack action but that won’t work either. Something to do with “unsupported datatype” being the reason the alert wasn’t sent. The e-mail however does work.
Here’s another problem which I encountered, and might be useful to someone. Whenever I follow these tutorials I like to install the latest versions of the packages (rather than those referenced).
So I installed ES 2.0.0 and Kibana 4.1 (as at this moment, that’s the latest in the elastic.co repo) but it didn’t work.
I ended up with this error and Kibana wouldn’t run at all:
err":{"message":"unknown error","name":"Error","stack":"Error: unknown error\n
I manually downloaded the latest Kibana tar.gz archive which is 4.2, deleted everything in /opt/kibana/ and extracted the 4.2 version, chowned the files to kibana:kibana and then it worked fine.
Hope this helps someone.
Thanks for this Mitchell. It’s been really helpful. I wonder if someone has the same error as I have. I follow every step from the tutorial, but when I try to load Kibana through my browser I only get the navigation bar. On the elasticsearch logs I have the following error (Elasticsearch 2.1):
Error: [query_phase_execution_exception] Result window is too large, from + size must be less than or equal to: [10000] but was [2147483647]. See the scroll api for a more efficient way to request large data sets.
Google’d it and found a recent commit: https://github.com/elastic/kibana/issues/5287 for that exact error. Don’t know what to do next. (
I’m new to ELK. I installed ELK on Ubuntu. All seems to be up and running (ES, nginx, Kibana, Logstash) But, when I browse to Kibana, after authenticating on nginx, the browser displays only the upper header: Kibana logo + Discover / Visualize / Dashboard / Settings , without the indices info. Any idea what went wrong?
kibana is not running no erros in log. Centos 7
sudo systemctl start kibana sudo chkconfig kibana on Note: Forwarding request to ‘systemctl enable kibana.service’. sudo service kibana status kibana is not running sudo tail /var/log/nginx/error.log sudo service nginx status Redirecting to /bin/systemctl status nginx.service ● nginx.service - The nginx HTTP and reverse proxy server Loaded: loaded (/usr/lib/systemd/system/nginx.service; enabled; vendor preset: disabled) Active: active (running) since Wed 2016-02-17 13:28:23 EST; 14min ago
Any help or suggestions on why kibana keeps coming back that it’s not running?
How can I store only 5 days of logs data on the ELK server and then delete the old logs? We have lot of client servers sending logs to ELK servers and we wanted to view only 5 days worth of data on Kibana dashboard. Thoughts?
I have installed an ELK stack following your tutorial, but I am having the “Unable to fetch mapping. Do you have indices matching the pattern?” Error from Kibana. All services in the stack are running okay, but when I do “sudo service logstash configtest” my output is this: Error: Expected one of #, input, filter, output at line 1, column 1 (byte 1) after {:level=>:error}
 This work is licensed under a Creative Commons Attribution-NonCommercial- ShareAlike 4.0 International License.
Become a contributor for community
Get paid to write technical tutorials and select a tech-focused charity to receive a matching donation.

DigitalOcean Documentation
Full documentation for every DigitalOcean product.

Resources for startups and AI-native businesses
The Wave has everything you need to know about building a business, from raising funding to marketing your product.
The developer cloud
Scale up as you grow — whether you're running one virtual machine or ten thousand.

Start building today
From GPU-powered inference and Kubernetes to managed databases and storage, get everything you need to build, scale, and deploy intelligent applications.
