
Introduction
In this tutorial, we will go over how to use Apache JMeter to perform basic load and stress testing on your web application environment. We will show you how to use the graphical user interface to build a test plan and to run tests against a web server.
JMeter is an open source desktop Java application that is designed to load test and measure performance. It can be used to simulate loads of various scenarios and output performance data in several ways, including CSV and XML files, and graphs. Because it is 100% Java, it is available on every OS that supports Java 6 or later.
Prerequisites
In order to follow this tutorial, you will need to have a computer that you can run JMeter on, and a web server to load test against. Do not run these tests against your production servers unless you know they can handle the load, or you may negatively impact your server’s performance.
You may adapt the tests in this tutorial to any of your own web applications. The web server that we are testing against as an example is a 1 CPU / 512 MB VPS running WordPress on a LEMP Stack, in the NYC2 DigitalOcean Datacenter. The JMeter computer is running in the DigitalOcean office in NYC (which is related to the latency of our tests).
Please note that the JMeter test results can be skewed by a variety of factors, including the system resources (CPU and RAM) available to JMeter and the network between JMeter and the web server being tested. The size of the load that JMeter can generate without skewing the results can be increased by running the tests in the non-graphical mode or by distributing the load generation to multiple JMeter servers.
Install JMeter
Because we are using Apache JMeter as a desktop application, and there are a large variety of desktop OSes in use, we will not cover the installation steps of JMeter for any specific OS. With that being said, JMeter is very easy to install. The easiest ways to install are to use a package manager (e.g. apt-get or Homebrew), or download and unarchive the JMeter binaries from the official site and install Java (version 6 or later).
Here is a list of the software, with links to archives, required to run JMeter:
- Oracle Java or OpenJDK (6 or later)
- Apache JMeter
Depending on how you install Java, you may need to add the Java bin directory to your PATH environmental variable, so JMeter can find the Java and keytool binaries.
Also, we will refer to the path that you installed JMeter to (the directory that you unarchived it to) as $JMETER_HOME. Therefore, if you are on a Linux or Unix-based OS, the JMeter binary is located at $JMETER_HOME/bin/jmeter. If you are running Windows, you can run $JMETER_HOME/bin/jmeter.bat.
For reference, when writing this tutorial, we used the following software versions:
- Oracle Java 7 update 60, 64-bit
- JMeter 2.11
Once you have JMeter installed and running, let’s move on to building a test plan!
Building a Basic Test Plan
After starting JMeter, you should see the graphical user interface with an empty Test Plan:
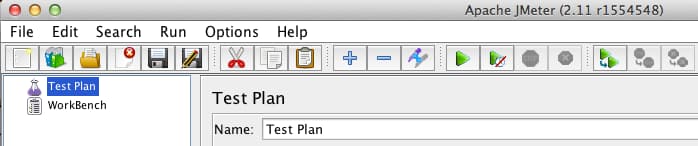
A test plan is composed of a sequence of test components that determine how the load test will be simulated. We will explain the how some of these components can be used as we add them into our test plan.
Add a Thread Group
First, add a Thread Group to Test Plan:
- Right-click on Test Plan
- Mouse over Add >
- Mouse over Threads (Users) >
- Click on Thread Group
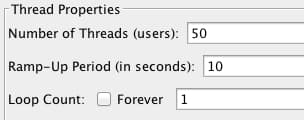
The Thread Group has three particularly important properties influence the load test:
- Number of Threads (users): The number of users that JMeter will attempt to simulate. Set this to 50
- Ramp-Up Period (in seconds): The duration of time that JMeter will distribute the start of the threads over. Set this to 10.
- Loop Count: The number of times to execute the test. Leave this set to 1.
Add an HTTP Request Defaults
The HTTP Request Defaults Config Element is used to set default values for HTTP Requests in our test plan. This is particularly useful if we want to send multiple HTTP requests to the same server as part of our test. Now let’s add HTTP Request Defaults to Thread Group:
- Select Thread Group, then Right-click it
- Mouse over Add >
- Mouse over Config Element >
- Click on HTTP Request Defaults
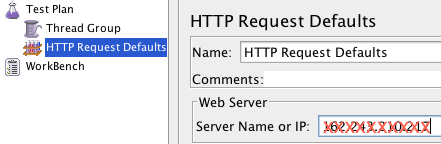
In HTTP Request Defaults, under the Web Server section, fill in the Server Name or IP field with the name or IP address of the web server you want to test. Setting the server here makes it the default server for the rest of the items in this thread group.
Add an HTTP Cookie Manager
If your web server uses cookies, you can add support for cookies by adding an HTTP Cookie Manager to the Thread Group:
- Select Thread Group, then Right-click it
- Mouse over Add >
- Mouse over Config Element >
- Click on HTTP Cookie Manager
Add an HTTP Request Sampler
Now you will want to add an HTTP Request sampler to Thread Group, which represents a page request that each thread (user) will access:
- Select Thread Group, then Right-click it
- Mouse over Add >
- Mouse over Sampler >
- Click on HTTP Request
In HTTP Request, under the HTTP Request section, fill in the Path with the item that you want each thread (user) to request. We will set this to /, so each thread will access the homepage of our server. Note that you do not need to specify the server in this item because it was already specified in the HTTP Request Defaults item.
Note: If you want to add more HTTP Requests as part of your test, repeat this step. Every thread will perform all of the requests in this test plan.
Add a View Results in Table Listener
In JMeter, listeners are used to output the results of a load test. There are a variety of listeners available, and the other listeners can be added by installing plugins. We will use the Table because it is easy to read.
- Select Thread Group, then Right-click it
- Mouse over Add >
- Mouse over Listener >
- Click on View Results in Table
You may also type in a value for Filename to output the results to a CSV file.
Run the Basic Test Plan
Now that we have our basic test plan set up, let’s run it and see the results.
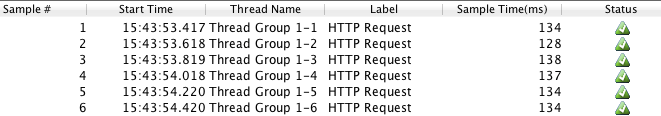
First, save the test plan by clicking on File then Save, then specify your desired file name. Then select on View Results in Table in the left pane, then click Run from the main menu then click Start (or just click the green Start arrow below the main menu). You should see the test results in the table as the test is run like:
Interpreting the Results
You will probably see that the Status of all the requests is “Success” (indicated by a green triangle with a checkmark in it). After that, the columns that you are probably most interest in are the Sample Time (ms) and Latency (not displayed in example) columns.
- Latency: The number of milliseconds that elapsed between when JMeter sent the request and when an initial response was received
- Sample Time: The number of milliseconds that the server took to fully serve the request (response + latency)
According to the table that was generated, the range of Sample Time was 128-164 ms. This is a reasonable response time for a basic homepage (which was about 55 KB). If your web application server is not struggling for resources, as demonstrated in the example, your Sample Time will be influenced primarily by geographical distance (which generally increases latency) and the size of the requested item (which increases transfer time). Your personal results will vary from the example.
So, our server survived our simulation of 50 users accessing our 55 KB WordPress homepage over 10 seconds (5 every second), with an acceptable response. Let’s see what happens when we increase the number of threads.
Increasing the Load
Let’s try the same test with 80 threads over 10 seconds. In the Thread Group item in the left-pane, change the Number of Threads (users) to 80. Now click View Results in Table, then click Start. On our example server, this results in the following table:
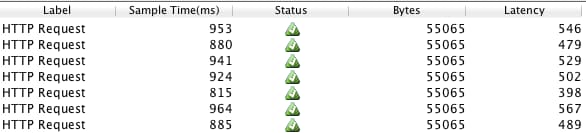
As you can see, the sample time has increased to nearly a second, which indicates that our web application server is beginning to become overburdened by requests. Let’s log in to our VPS and see take a quick look at resource usage during the load test.
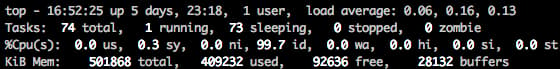
Log in to your web server via SSH and run top:
top
Unless you have users actively hitting your server, you should see that the Cpu(s) % user usage (us) should be very low or 0%, and the Cpu(s) % idle (id) should be 99%+, like so:
Now, in JMeter, start the test again, then switch back to your web server’s SSH session. You should see the resource usage increase:
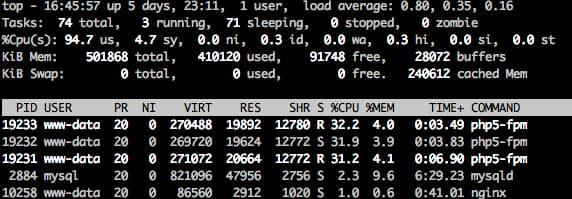
In the case of our example, the CPU % user usage is 94% and the system usage (sy) is 4.7% with 0% idle. We aren’t running out of memory, as indicated in the image above, so the decreased performance is due to lack of CPU power! We can also see that the php5-fpm processes, which are serving WordPress, are using is using the majority of the CPU (about 96% combined).
In order to meet the demands of this simulation of 80 users in 10 seconds, we need to either increase our CPU or optimize our server setup to use less CPU. In the case of WordPress, we could move the MySQL database (which uses portion of the CPU) to another server and we could also implement caching (which would decrease CPU usage).
If you are curious, you may adjust the number of threads in the test to see how many your server can handle before it begins to exhibit performance degradation. In the case of our 1 CPU droplet example, it works fine until we use 72 threads over 10 seconds.
Conclusion
JMeter can be a very valuable tool for determining how your web application server setup should be improved, to reduce bottlenecks and increase performance. Now that you are familiar with the basic usage of JMeter, feel free to create new test plans to measure the performance of your servers in various scenarios.
The test that we used as the example does not accurately reflect a normal user’s usage pattern, but JMeter has the tools to perform a variety of tests that may be useful in your own environment. For example, JMeter can be configured to simulate a user logging into your application, client-side caching, and handling user sessions with URL rewriting. There are many other built-in samplers, listeners, and configuration tools that can help you build your desired scenario. Additionally, there are JMeter plugins to enhance its functionality that are available for download at http://jmeter-plugins.org/.
Thanks for learning with the DigitalOcean Community. Check out our offerings for compute, storage, networking, and managed databases.
Tutorial Series: Load Testing with Apache JMeter
Load testing your web application servers can be an important step in preparing your environment for production. Apache JMeter can be used to simulate the load of many users connecting to your servers, which can be useful in identifying your capacity limits and potential bottlenecks in your setup.
This series will show you how to use JMeter to record test scenarios, and to perform load testing on your web servers.
Browse Series: 2 tutorials
About the author
Software Engineer @ DigitalOcean. Former Señor Technical Writer (I no longer update articles or respond to comments). Expertise in areas including Ubuntu, PostgreSQL, MySQL, and more.
Still looking for an answer?
This textbox defaults to using Markdown to format your answer.
You can type !ref in this text area to quickly search our full set of tutorials, documentation & marketplace offerings and insert the link!
Great Overview. I gave a webinar a few months ago called “Learn JMeter in 60 minutes” that teaches most of the basics, but also includes site logins and dynamic data with CSV files: https://www.youtube.com/watch?v=cv7KqxaLZd8
Great over view which shows the basic use of Jmeter and also the analysis of web server with respect to JMeter.
That was nice article. do you have any info on how to load test chat applications which are client server. ie we have a desktop application and a java server application. which communication with each other using xmpp and Rest API calls?
That was nice article. do you have any info on how to load test chat applications which are client server. ie we have a desktop application and a java server application. which communication with each other using xmpp and Rest API calls?
I just wanna know, how accurate is Jmeter performance Testing. And how can we do Iteration in Jmeter if any options available (beginner) . Thanks!
If i need to execute test for a website for multiple countries,how can i do that by using my current testing environment.
Don’t include the http:// in your server address within the Sampler [HTTP Request] or HTTP Request Defaults… took me a while to work out why my requests were failing with just a warning…
This is perfect process explanation to test the application by using Jmeter. Thank you so much for sharing.
Can you please tell how to test performance using jmeter on basis of user registration, navigation and image uploading for 400 users?
 This work is licensed under a Creative Commons Attribution-NonCommercial- ShareAlike 4.0 International License.
Become a contributor for community
Get paid to write technical tutorials and select a tech-focused charity to receive a matching donation.

DigitalOcean Documentation
Full documentation for every DigitalOcean product.

Resources for startups and AI-native businesses
The Wave has everything you need to know about building a business, from raising funding to marketing your product.
The developer cloud
Scale up as you grow — whether you're running one virtual machine or ten thousand.

Start building today
From GPU-powered inference and Kubernetes to managed databases and storage, get everything you need to build, scale, and deploy intelligent applications.
