By Hanif Jetha

Introduction
DigitalOcean Managed Databases allows you to scale your PostgreSQL database using several methods. One such method is a built-in connection pooler that allows you to efficiently handle large numbers of client connections and reduce the CPU and memory footprint of these open connections. By using a connection pool and sharing a fixed set of recyclable connections, you can handle significantly more concurrent client connections, and squeeze extra performance out of your PostgreSQL database.
In this tutorial we’ll use pgbench, PostgreSQL’s built-in benchmarking tool, to run load tests on a DigitalOcean Managed PostgreSQL Database. We’ll dive in to connection pools, describe how they work, and show how to create one using the Cloud Control panel. Finally, using results from the pgbench tests, we’ll demonstrate how using a connection pool can be an inexpensive method of increasing database throughput.
Prerequisites
To complete this tutorial, you’ll need:
- A DigitalOcean Managed PostgreSQL Database cluster. To learn how to provision and configure a DigitalOcean PostgreSQL cluster, consult the Managed Database product documentation.
- A client machine with PostgreSQL installed. By default, your PostgreSQL installation will contain the
pgbenchbenchmarking utility and thepsqlclient, both of which we’ll use in this guide. Consult How To Install and Use PostgreSQL on Ubuntu 18.04 to learn how to Install PostgreSQL. If you’re not running Ubuntu on your client machine, you can use the version finder to find the appropriate tutorial.
Once you have a DigitalOcean PostgreSQL cluster up and running and a client machine with pgbench installed, you’re ready to begin with this guide.
Step 1 — Creating and Initializing benchmark Database
benchmark DatabaseBefore we create a connection pool for our database, we’ll first create the benchmark database on our PostgreSQL cluster and populate it with some dummy data on which pgbench will run its tests. The pgbench utility repeatedly runs a series of five SQL commands (consisting of SELECT, UPDATE, and INSERT queries) in a transaction, using multiple threads and clients, and calculates a useful performance metric called Transactions per Second (TPS). TPS is a measure of database throughput, counting the number of atomic transactions processed by the database in one second. To learn more about the specific commands executed by pgbench, consult What is the “Transaction” Actually Performed in pgbench? from the official pgbench documentation.
Let’s begin by connecting to our PostgreSQL cluster and creating the benchmark database.
First, retrieve your cluster’s Connection Details by navigating to Databases and locating your PostgreSQL cluster. Click into your cluster. You should see a cluster overview page containing the following Connection Details box:
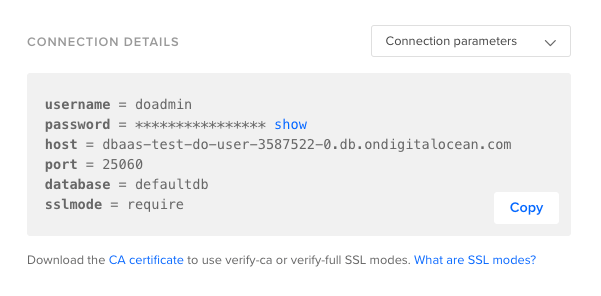
From this, we can parse the following config variables:
- Admin user:
doadmin - Admin password:
your_password - Cluster endpoint:
dbaas-test-do-user-3587522-0.db.ondigitalocean.com - Connection port:
25060 - Database to connect to:
defaultdb - SSL Mode:
require(use an SSL-encrypted connection for increased security)
Take note of these parameters, as you’ll need them when using both the psql client and pgbench tool.
Click on the dropdown above this box and select Connection String. We’ll copy this string and pass it in to psql to connect to this PostgreSQL node.
Connect to your cluster using psql and the connection string you just copied:
- psql postgresql://doadmin:your_password@your_cluster_endpoint:25060/defaultdb?sslmode=require
You should see the following PostgreSQL client prompt, indicating that you’ve connected to your PostgreSQL cluster successfully:
Outputpsql (10.6 (Ubuntu 10.6-0ubuntu0.18.04.1))
SSL connection (protocol: TLSv1.2, cipher: ECDHE-RSA-AES256-GCM-SHA384, bits: 256, compression: off)
Type "help" for help.

defaultdb=>
From here, create the benchmark database:
- CREATE DATABASE benchmark;
You should see the following output:
OutputCREATE DATABASE
Now, disconnect from the cluster:
- \q
Before we run the pgbench tests, we need to populate this benchmark database with some tables and dummy data required to run the tests.
To do this, we’ll run pgbench with the following flags:
-
-h: The PostgreSQL cluster endpoint -
-p: The PostgreSQL cluster connection port -
-U: The database username -
-i: Indicates that we’d like to initialize thebenchmarkdatabase with benchmarking tables and their dummy data. -
-s: Set a scale factor of 150, which will multiply table sizes by 150. The default scale factor of1results in tables of the following sizes:table # of rows --------------------------------- pgbench_branches 1 pgbench_tellers 10 pgbench_accounts 100000 pgbench_history 0Using a scale factor of 150, the
pgbench_accountstable will contain 15,000,000 rows.Note: To avoid excessive blocked transactions, be sure to set the scale factor to a value at least as large as the number of concurrent clients you intend to test with. In this tutorial we’ll test with 150 clients at most, so we set
-sto 150 here. To learn more, consult these recommended practices from the officialpgbenchdocumentation.
Run the complete pgbench command:
- pgbench -h your_cluster_endpoint -p 25060 -U doadmin -i -s 150 benchmark
After running this command, you will be prompted to enter the password for the database user you specified. Enter the password, and hit ENTER.
You should see the following output:
Outputdropping old tables...
NOTICE:  table "pgbench_accounts" does not exist, skipping
NOTICE:  table "pgbench_branches" does not exist, skipping
NOTICE:  table "pgbench_history" does not exist, skipping
NOTICE:  table "pgbench_tellers" does not exist, skipping
creating tables...
generating data...
100000 of 15000000 tuples (0%) done (elapsed 0.19 s, remaining 27.93 s)
200000 of 15000000 tuples (1%) done (elapsed 0.85 s, remaining 62.62 s)
300000 of 15000000 tuples (2%) done (elapsed 1.21 s, remaining 59.23 s)
400000 of 15000000 tuples (2%) done (elapsed 1.63 s, remaining 59.44 s)
500000 of 15000000 tuples (3%) done (elapsed 2.05 s, remaining 59.51 s)
. . .
14700000 of 15000000 tuples (98%) done (elapsed 70.87 s, remaining 1.45 s)
14800000 of 15000000 tuples (98%) done (elapsed 71.39 s, remaining 0.96 s)
14900000 of 15000000 tuples (99%) done (elapsed 71.91 s, remaining 0.48 s)
15000000 of 15000000 tuples (100%) done (elapsed 72.42 s, remaining 0.00 s)
vacuuming...
creating primary keys...
done.
At this point, we’ve created a benchmarking database, populated with the tables and data required to run the pgbench tests. We can now move on to running a baseline test which we’ll use to compare performance before and after connection pooling is enabled.
Step 2 — Running a Baseline pgbench Test
pgbench TestBefore we run our first benchmark, it’s worth diving into what we’re trying to optimize with connection pools.
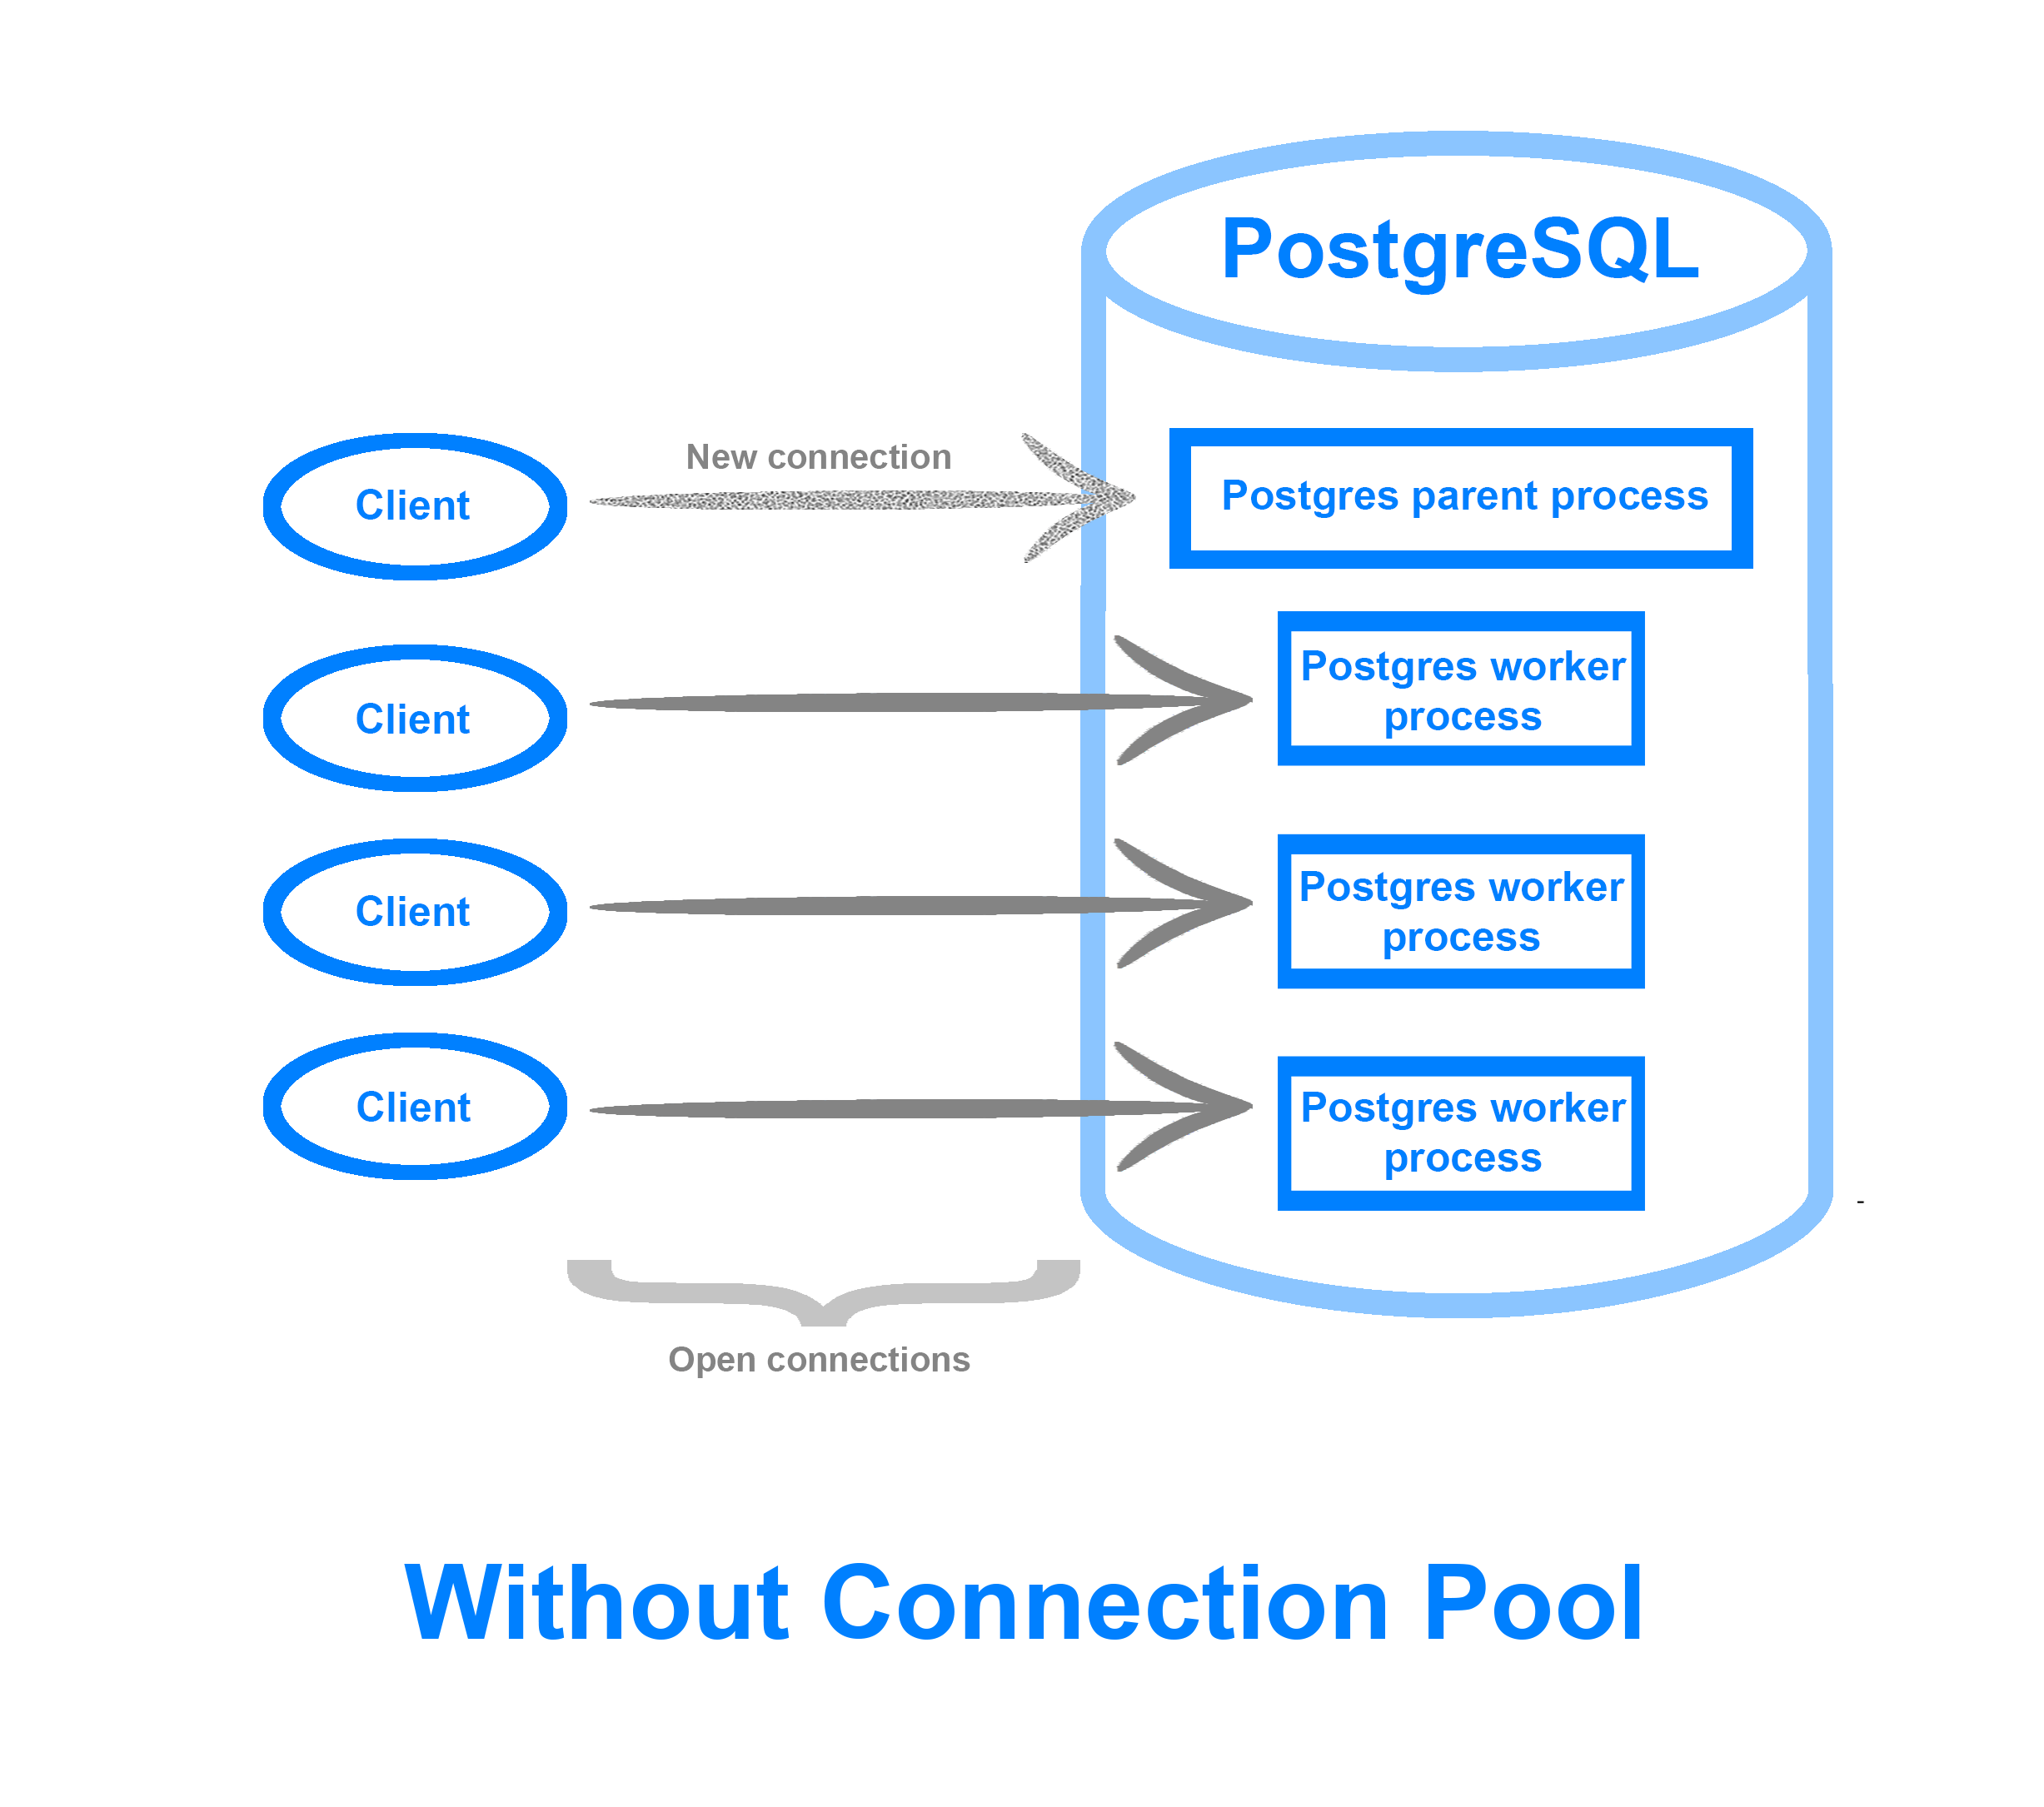
Typically when a client connects to a PostgreSQL database, the main PostgreSQL OS process forks itself into a child process corresponding to this new connection. When there are only a few connections, this rarely presents an issue. However, as clients and connections scale, the CPU and memory overhead of creating and maintaining these connections begins to add up, especially if the application in question does not efficiently use database connections. In addition, the max_connections PostgreSQL setting may limit the number of client connections allowed, resulting in additional connections being refused or dropped.
A connection pool keeps open a fixed number of database connections, the pool size, which it then uses to distribute and execute client requests. This means that you can accommodate far more simultaneous connections, efficiently deal with idle or stagnant clients, as well as queue up client requests during traffic spikes instead of rejecting them. By recycling connections, you can more efficiently use your machine’s resources in an environment where there is a heavy connection volume, and squeeze extra performance out of your database.
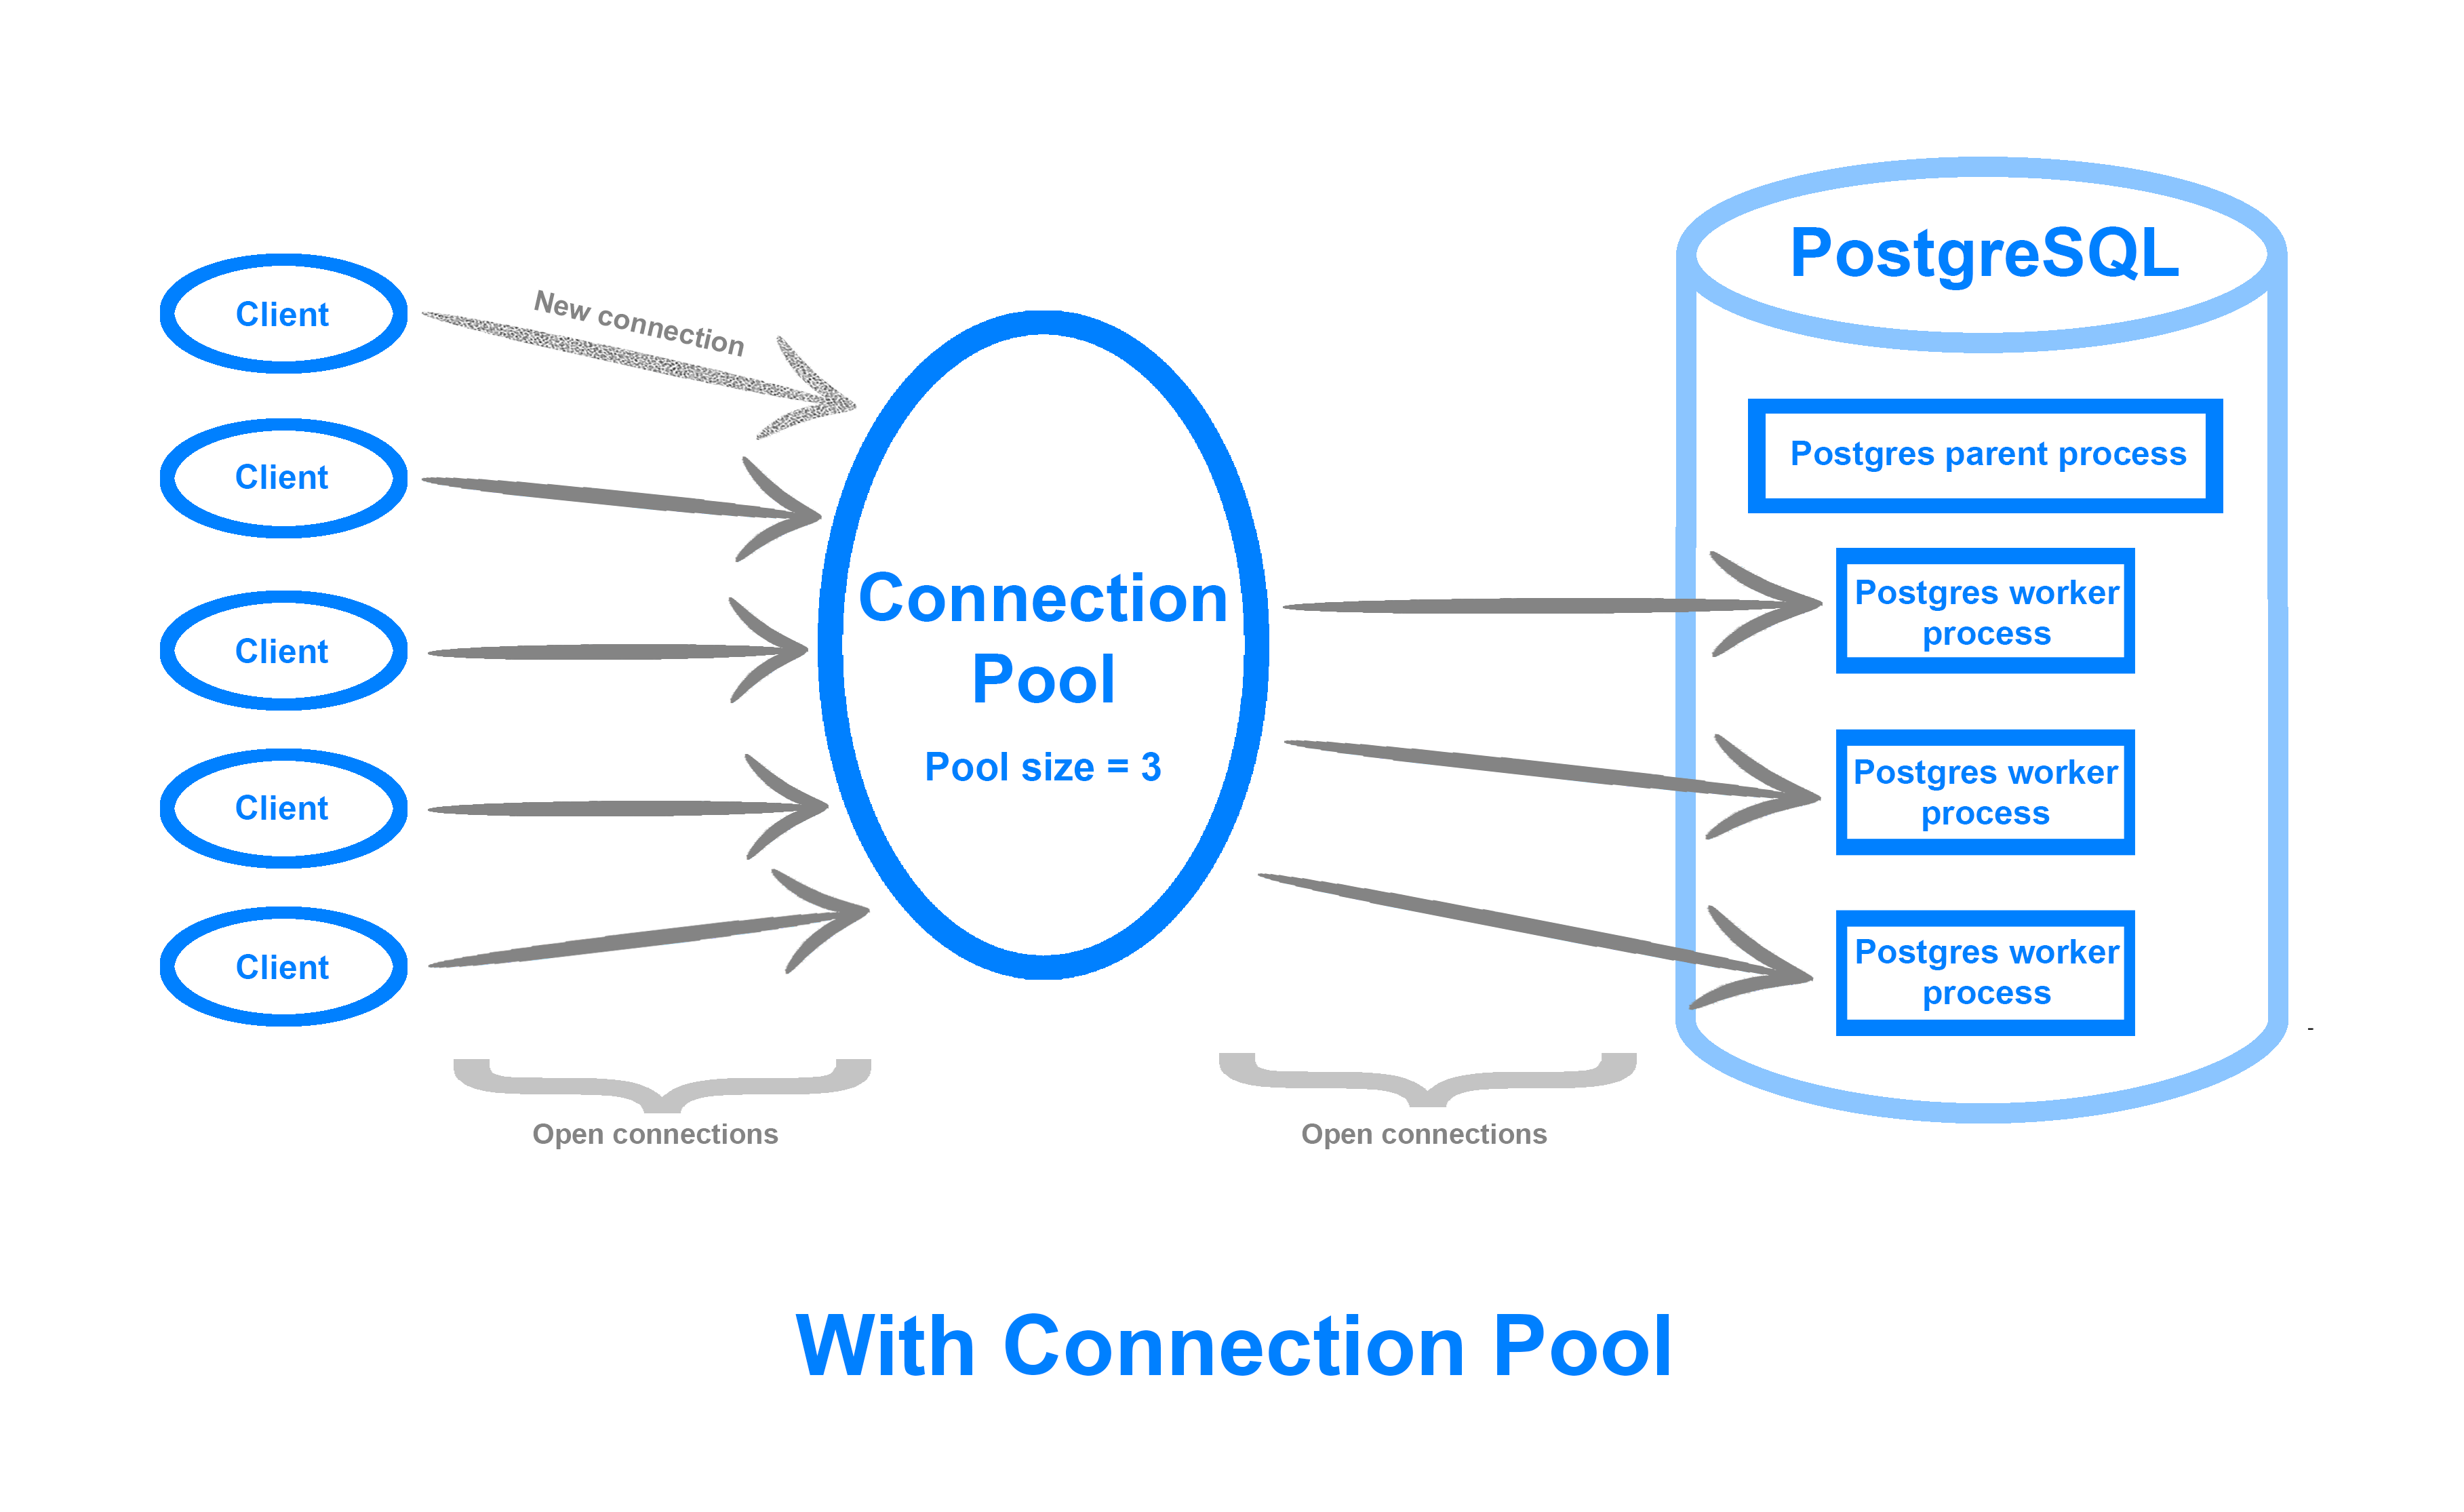
A connection pool can be implemented either on the application side or as middleware between the database and your application. The Managed Databases connection pooler is built on top of pgBouncer, a lightweight, open-source middleware connection pooler for PostgreSQL. Its interface is available via the Cloud Control Panel UI.
Navigate to Databases in the Control Panel, and then click into your PostgreSQL cluster. From here, click into Connection Pools. Then, click on Create a Connection Pool. You should see the following configuration window:
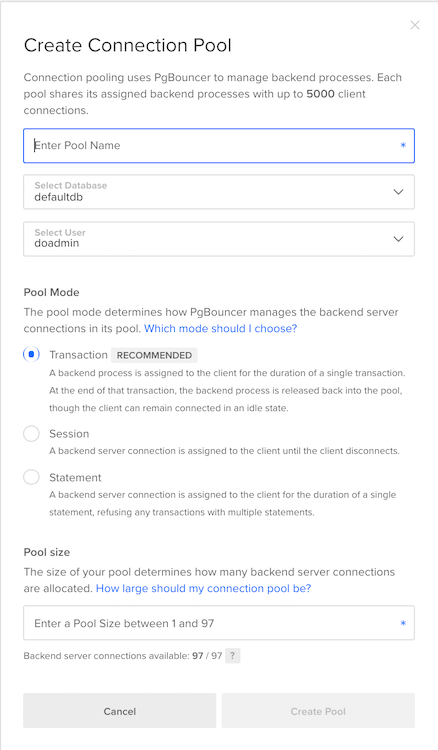
Here, you can configure the following fields:
- Pool Name: A unique name for your connection pool
- Database: The database for which you’d like to pool connections
- User: The PostgreSQL user the connection pool will authenticate as
- Mode: One of Session, Transaction, or Statement. This option controls how long the pool assigns a backend connection to a client.
- Session: The client holds on to the connection until it explicitly disconnects.
- Transaction: The client obtains the connection until it completes a transaction, after which the connection is returned to the pool.
- Statement: The pool aggressively recycles connections after each client statement. In statement mode, multi-statement transactions are not allowed. To learn more, consult the Connection Pools product documentation.
- Pool Size: The number of connections the connection pool will keep open between itself and the database.
Before we create a connection pool, we’ll run a baseline test to which we can compare database performance with connection pooling.
In this tutorial, we’ll use a 4 GB RAM, 2 vCPU, 80 GB Disk, primary node only Managed Database setup. You can scale the benchmark test parameters in this section according to your PostgreSQL cluster specs.
DigitalOcean Managed Database clusters have the PostgreSQL max_connections parameter preset to 25 connections per 1 GB RAM. A 4 GB RAM PostgreSQL node therefore has max_connections set to 100. In addition, for all clusters, 3 connections are reserved for maintenance. So for this 4 GB RAM PostgreSQL cluster, 97 connections are available for connection pooling.
With this in mind, let’s run our first baseline pgbench test.
Log in to your client machine. We’ll run pgbench, specifying the database endpoint, port and user as usual. In addition, we’ll provide the following flags:
-c: The number of concurrent clients or database sessions to simulate. We set this to 50 so as to simulate a number of concurrent connections smaller than themax_connectionsparameter for our PostgreSQL cluster.-j: The number of worker threadspgbenchwill use to run the benchmark. If you’re using a multi-CPU machine, you can tune this upwards to distribute clients across threads. On a two-core machine, we set this to2.-P: Display progress and metrics every60seconds.-T: Run the benchmark for600seconds (10 minutes). To produce consistent, reproducible results, it’s important that you run the benchmark for several minutes, or through one checkpoint cycle.
We’ll also specify that we’d like to run the benchmark against the benchmark database we created and populated earlier.
Run the following complete pgbench command:
- pgbench -h your_db_endpoint -p 25060 -U doadmin -c 50 -j 2 -P 60 -T 600 benchmark
Hit ENTER and then type in the password for the doadmin user to begin running the test. You should see output similar to the following (results will depend on the specs of your PostgreSQL cluster):
Outputstarting vacuum...end.
progress: 60.0 s, 157.4 tps, lat 282.988 ms stddev 40.261
progress: 120.0 s, 176.2 tps, lat 283.726 ms stddev 38.722
progress: 180.0 s, 167.4 tps, lat 298.663 ms stddev 238.124
progress: 240.0 s, 178.9 tps, lat 279.564 ms stddev 43.619
progress: 300.0 s, 178.5 tps, lat 280.016 ms stddev 43.235
progress: 360.0 s, 178.8 tps, lat 279.737 ms stddev 43.307
progress: 420.0 s, 179.3 tps, lat 278.837 ms stddev 43.783
progress: 480.0 s, 178.5 tps, lat 280.203 ms stddev 43.921
progress: 540.0 s, 180.0 tps, lat 277.816 ms stddev 43.742
progress: 600.0 s, 178.5 tps, lat 280.044 ms stddev 43.705
transaction type: <builtin: TPC-B (sort of)>
scaling factor: 150
query mode: simple
number of clients: 50
number of threads: 2
duration: 600 s
number of transactions actually processed: 105256
latency average = 282.039 ms
latency stddev = 84.244 ms
tps = 175.329321 (including connections establishing)
tps = 175.404174 (excluding connections establishing)
Here, we observed that over a 10 minute run with 50 concurrent sessions, we processed 105,256 transactions with a throughput of roughly 175 transactions per second.
Now, let’s run the same test, this time using 150 concurrent clients, a value that is higher than max_connections for this database, to synthetically simulate a mass influx of client connections:
- pgbench -h your_db_endpoint -p 25060 -U doadmin -c 150 -j 2 -P 60 -T 600 benchmark
You should see output similar to the following:
Outputstarting vacuum...end.
connection to database "pgbench" failed:
FATAL:  remaining connection slots are reserved for non-replication superuser connections
progress: 60.0 s, 182.6 tps, lat 280.069 ms stddev 42.009
progress: 120.0 s, 253.8 tps, lat 295.612 ms stddev 237.448
progress: 180.0 s, 271.3 tps, lat 276.411 ms stddev 40.643
progress: 240.0 s, 273.0 tps, lat 274.653 ms stddev 40.942
progress: 300.0 s, 272.8 tps, lat 274.977 ms stddev 41.660
progress: 360.0 s, 250.0 tps, lat 300.033 ms stddev 282.712
progress: 420.0 s, 272.1 tps, lat 275.614 ms stddev 42.901
progress: 480.0 s, 261.1 tps, lat 287.226 ms stddev 112.499
progress: 540.0 s, 272.5 tps, lat 275.309 ms stddev 41.740
progress: 600.0 s, 271.2 tps, lat 276.585 ms stddev 41.221
transaction type: <builtin: TPC-B (sort of)>
scaling factor: 150
query mode: simple
number of clients: 150
number of threads: 2
duration: 600 s
number of transactions actually processed: 154892
latency average = 281.421 ms
latency stddev = 125.929 ms
tps = 257.994941 (including connections establishing)
tps = 258.049251 (excluding connections establishing)
Note the FATAL error, indicating that pgbench hit the 100 connection limit threshold set by max_connections, resulting in a refused connection. The test was still able to complete, with a TPS of roughly 257.
At this point we can investigate how a connection pool could potentially improve our database’s throughput.
Step 3 — Creating and Testing a Connection Pool
In this step we’ll create a connection pool and rerun the previous pgbench test to see if we can improve our database’s throughput.
In general, the max_connections setting and connection pool parameters are tuned in tandem to max out the database’s load. However, because max_connections is abstracted away from the user in DigitalOcean Managed Databases, our main levers here are the connection pool Mode and Size settings.
To begin, let’s create a connection pool in Transaction mode that keeps open all the available backend connections.
Navigate to Databases in the Control Panel, and then click into your PostgreSQL cluster. From here, click into Connection Pools. Then, click on Create a Connection Pool.
In the configuration window that appears, fill in the following values:
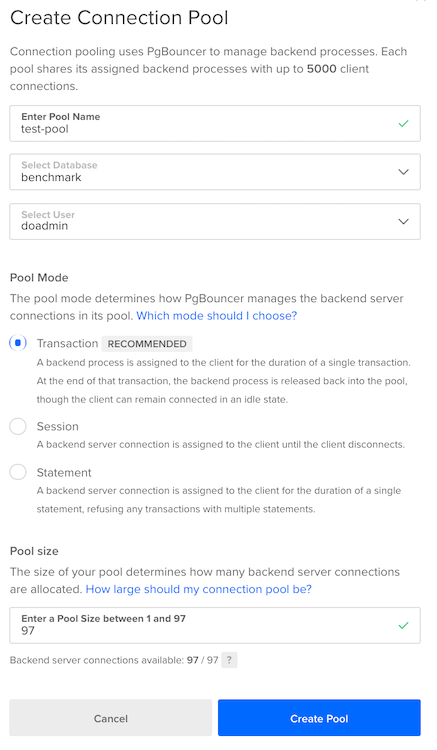
Here we name our connection pool test-pool, and use it with the benchmark database. Our database user is doadmin and we set the connection pool to Transaction mode. Recall from earlier that for a managed database cluster with 4GB of RAM, there are 97 available database connections. Accordingly, configure the pool to keep open 97 database connections.
When you’re done, hit Create Pool.
You should now see this pool in the Control Panel:
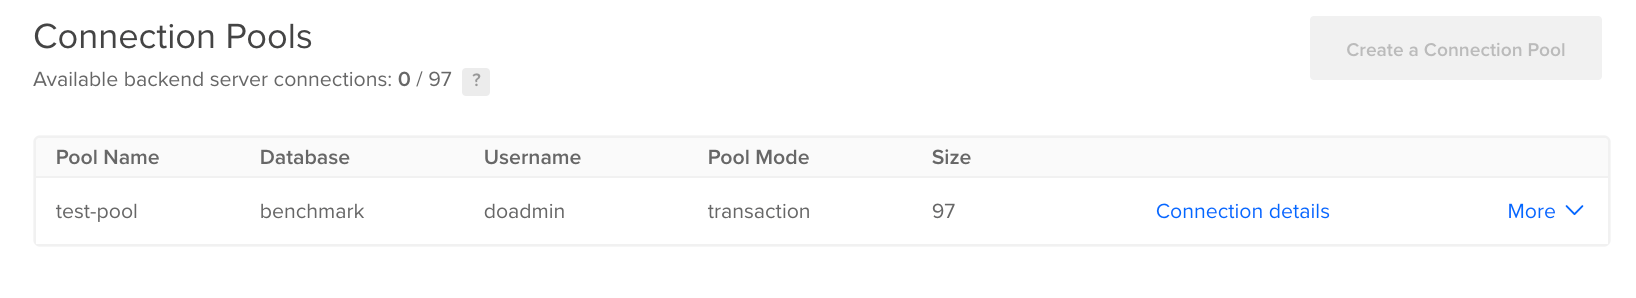
Grab its URI by clicking Connection Details. It should look something like the following
postgres://doadmin:password@pool_endpoint:pool_port/test-pool?sslmode=require
You should notice a different port here, and potentially a different endpoint and database name, corresponding to the pool name test-pool.
Now that we’ve created the test-pool connection pool, we can rerun the pgbench test we ran above.
Rerun pgbench
From your client machine, run the following pgbench command (with 150 concurrent clients), making sure to substitute the highlighted values with those in your connection pool URI:
- pgbench -h pool_endpoint -p pool_port -U doadmin -c 150 -j 2 -P 60 -T 600 test-pool
Here we once again use 150 concurrent clients, run the test across 2 threads, print progress every 60 seconds, and run the test for 600 seconds. We set the database name to test-pool, the name of the connection pool.
Once the test completes, you should see output similar to the following (note that these results will vary depending on the specs of your database node):
Outputstarting vacuum...end.
progress: 60.0 s, 240.0 tps, lat 425.251 ms stddev 59.773
progress: 120.0 s, 350.0 tps, lat 428.647 ms stddev 57.084
progress: 180.0 s, 340.3 tps, lat 440.680 ms stddev 313.631
progress: 240.0 s, 364.9 tps, lat 411.083 ms stddev 61.106
progress: 300.0 s, 366.5 tps, lat 409.367 ms stddev 60.165
progress: 360.0 s, 362.5 tps, lat 413.750 ms stddev 59.005
progress: 420.0 s, 359.5 tps, lat 417.292 ms stddev 60.395
progress: 480.0 s, 363.8 tps, lat 412.130 ms stddev 60.361
progress: 540.0 s, 351.6 tps, lat 426.661 ms stddev 62.960
progress: 600.0 s, 344.5 tps, lat 435.516 ms stddev 65.182
transaction type: <builtin: TPC-B (sort of)>
scaling factor: 150
query mode: simple
number of clients: 150
number of threads: 2
duration: 600 s
number of transactions actually processed: 206768
latency average = 421.719 ms
latency stddev = 114.676 ms
tps = 344.240797 (including connections establishing)
tps = 344.385646 (excluding connections establishing)
Notice here that we were able to increase our database’s throughput from 257 TPS to 344 TPS with 150 concurrent connections (an increase of 33%), and did not run up against the max_connections limit we previously hit without a connection pool. By placing a connection pool in front of the database, we can avoid dropped connections and significantly increase database throughput in an environment with a large number of simultaneous connections.
If you run this same test, but with a -c value of 50 (specifying a smaller number of clients), the gains from using a connection pool become much less evident:
Outputstarting vacuum...end.
progress: 60.0 s, 154.0 tps, lat 290.592 ms stddev 35.530
progress: 120.0 s, 162.7 tps, lat 307.168 ms stddev 241.003
progress: 180.0 s, 172.0 tps, lat 290.678 ms stddev 36.225
progress: 240.0 s, 172.4 tps, lat 290.169 ms stddev 37.603
progress: 300.0 s, 177.8 tps, lat 281.214 ms stddev 35.365
progress: 360.0 s, 177.7 tps, lat 281.402 ms stddev 35.227
progress: 420.0 s, 174.5 tps, lat 286.404 ms stddev 34.797
progress: 480.0 s, 176.1 tps, lat 284.107 ms stddev 36.540
progress: 540.0 s, 173.1 tps, lat 288.771 ms stddev 38.059
progress: 600.0 s, 174.5 tps, lat 286.508 ms stddev 59.941
transaction type: <builtin: TPC-B (sort of)>
scaling factor: 150
query mode: simple
number of clients: 50
number of threads: 2
duration: 600 s
number of transactions actually processed: 102938
latency average = 288.509 ms
latency stddev = 83.503 ms
tps = 171.482966 (including connections establishing)
tps = 171.553434 (excluding connections establishing)
Here we see that we were not able to increase throughput by using a connection pool. Our throughput went down to 171 TPS from 175 TPS.
Although in this guide we use pgbench with its built-in benchmark data set, the best test for determining whether or not to use a connection pool is a benchmark load that accurately represents production load on your database, against production data. Creating custom benchmarking scripts and data is beyond the scope of this guide, but to learn more, consult the official pgbench documentation.
Note: The pool size setting is highly workload-specific. In this guide, we configured the connection pool to use all the available backend database connections. This was because throughout our benchmark, the database rarely reached full utilization (you can monitor database load from the Metrics tab in the Cloud Control Panel). Depending on your database’s load, this may not be the optimal setting. If you notice that your database is constantly fully saturated, shrinking the connection pool may increase throughput and improve performance by queuing additional requests instead of trying to execute them all at the same time on an already loaded server.
Conclusion
DigitalOcean Managed Databases connection pooling is a powerful feature that can help you quickly squeeze extra performance out of your database. Along with other techniques like replication, caching, and sharding, connection pooling can help you scale your database layer to process an even greater volume of requests.
In this guide we focused on a simplistic and synthetic testing scenario using PostgreSQL’s built-in pgbench benchmarking tool and its default benchmark test. In any production scenario, you should run benchmarks against actual production data while simulating production load. This will allow you to tune your database for your particular usage pattern.
Along with pgbench, other tools exist to benchmark and load your database. One such tool developed by Percona is sysbench-tpcc. Another is Apache’s JMeter, which can load test databases as well as web applications.
To learn more about DigitalOcean Managed Databases, consult the Managed Databases product documentation. To learn more about sharding, another useful scaling technique, consult Understanding Database Sharding.
References
- How to Pool PostgreSQL Connections with PgBouncer
- Tuning PostgreSQL with pgbench
- Scaling PostgreSQL with PgBouncer: You May Need a Connection Pooler Sooner Than You Expect
- PgBouncer Official Documentation
- Tuning Your PostgreSQL Server
- PostgreSQL 9.6 High Performance
- pgbench Official Documentation
- Understanding Postgres connection pooling with PgBouncer
Thanks for learning with the DigitalOcean Community. Check out our offerings for compute, storage, networking, and managed databases.
About the author
DevOps Engineer, Former Technical Writer and Editor at DigitalOcean. Expertise in topics including Ubuntu, Kubernetes, Docker, CentOS.
Still looking for an answer?
This textbox defaults to using Markdown to format your answer.
You can type !ref in this text area to quickly search our full set of tutorials, documentation & marketplace offerings and insert the link!
Thank you for this useful article! Here is another somewhat related article about database pools (and pools in general), which may be of interest to some readers: https://innolitics.com/articles/database-pools/
Bit confused. When I run a similar test with the same resources (4gb, 2cpu) with managed PostgreSQL, I get completely different results.
My TPS is much lower than yours overall. Is the reason for this my latency? Also, why would latency be so bad, it’s certainly not my internet.
Without connection pool:
progress: 44.4 s, 0.0 tps, lat 0.000 ms stddev 0.000 progress: 60.0 s, 21.9 tps, lat 2151.508 ms stddev 230.595 progress: 80.0 s, 23.7 tps, lat 2103.538 ms stddev 177.279 progress: 100.0 s, 24.7 tps, lat 2027.145 ms stddev 130.513 progress: 120.0 s, 23.3 tps, lat 2134.609 ms stddev 186.384 progress: 140.0 s, 23.8 tps, lat 2101.984 ms stddev 184.289 progress: 160.0 s, 24.5 tps, lat 2037.188 ms stddev 151.914 progress: 180.0 s, 22.1 tps, lat 2271.931 ms stddev 546.300 transaction type: <builtin: TPC-B (sort of)> scaling factor: 150 query mode: simple number of clients: 50 number of threads: 2 duration: 180 s number of transactions actually processed: 3233 latency average = 2112.877 ms latency stddev = 270.212 ms tps = 17.761851 (including connections establishing) tps = 17.936911 (excluding connections establishing)
With connection pool:
progress: 108.3 s, 0.0 tps, lat 0.000 ms stddev 0.000 progress: 120.0 s, 47.9 tps, lat 2769.361 ms stddev 512.446 progress: 140.0 s, 50.9 tps, lat 2923.746 ms stddev 240.220 progress: 160.0 s, 52.3 tps, lat 2883.238 ms stddev 254.371 progress: 180.0 s, 53.9 tps, lat 2766.957 ms stddev 212.124 transaction type: <builtin: TPC-B (sort of)> scaling factor: 150 query mode: simple number of clients: 150 number of threads: 2 duration: 180 s number of transactions actually processed: 3852 latency average = 2840.492 ms latency stddev = 299.417 ms tps = 21.046722 (including connections establishing) tps = 21.214132 (excluding connections establishing)
 This work is licensed under a Creative Commons Attribution-NonCommercial- ShareAlike 4.0 International License.
Become a contributor for community
Get paid to write technical tutorials and select a tech-focused charity to receive a matching donation.

DigitalOcean Documentation
Full documentation for every DigitalOcean product.

Resources for startups and AI-native businesses
The Wave has everything you need to know about building a business, from raising funding to marketing your product.
The developer cloud
Scale up as you grow — whether you're running one virtual machine or ten thousand.

Start building today
From GPU-powered inference and Kubernetes to managed databases and storage, get everything you need to build, scale, and deploy intelligent applications.
