
React Developer Tools (Devtools for short) is a browser extension for Chrome and Firefox that provides an extra set of React-specific inspection widgets to assist you with development. By installing React Devtools, you’ll get two main features: a view of the component tree and the current state and props of each component you select.
Let’s get debugging!
Getting Started
To install React Devtools, visit the extension page for your browser of choice — Chrome or Firefox — and find the install button.
The images in this tutorial are captured from Chrome, but the Firefox version has no notable differences. If you use a different browser, or perhaps need to inspect a React Native app, React Devtools is available as a standalone application. You can read more about that here.
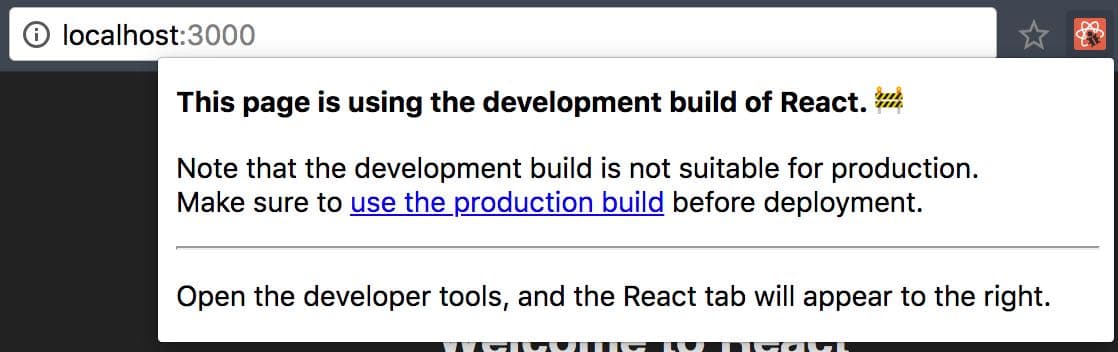
After installation, the extension requires no further setup. If you find yourself unable to access the toolkit, try reopening your browser or verifying that Devtools can access the React instance on the page by clicking the React logo next to your address bar:
Inspecting Your App
The quickest way to open React Devtools is to right click your page and select inspect.
On your browser’s inspection window, select the React tab, and you should be presented with a view of your app’s component hierarchy:
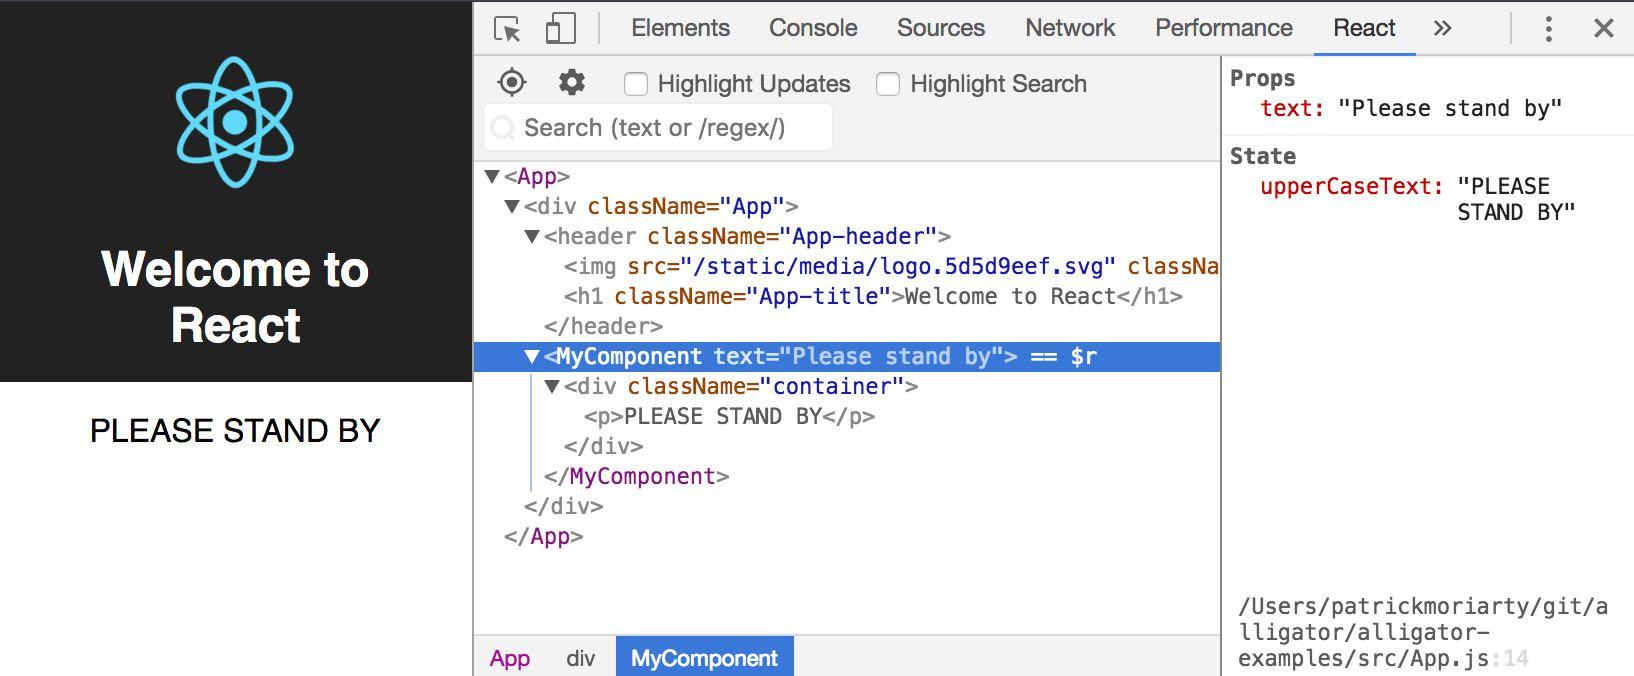
If you’ve used Chrome or Firefox’s developer tools, this view should look a little familiar to you. The view of our app’s component tree is similar to the plain HTML tree you’d see on the Elements tab, but there are some improvements:
- Our React elements are displayed next to plain HTML elements and are selectable.
- Selected React elements have a real-time view of the instance’s state and props (as seen on the right). This is great for debugging!
- The tabs at the bottom represent the path from the top of the tree to our selected element. In this case,
MyComponentis a child ofdiv, which is a child ofApp.
Extra Features
Inline element selection
Much like the plain-HTML element select feature in Chrome and Firefox, React Devtools has a feature to select React components on the page. Click the bullseye button, then select an element on the page:
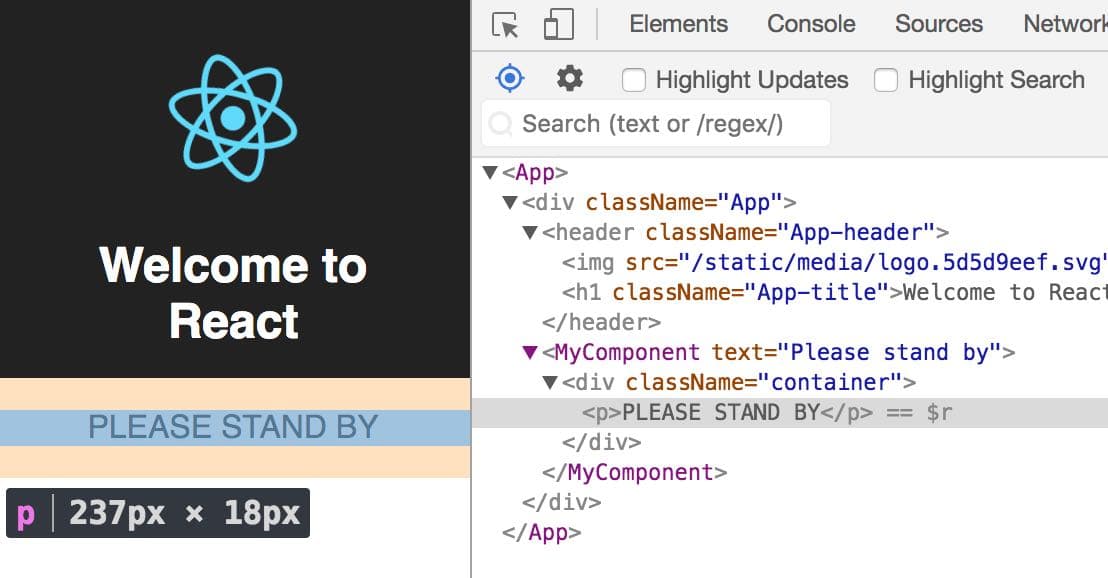
You’ll notice we can’t select MyComponent directly, but we can get pretty close by using the selection tool.
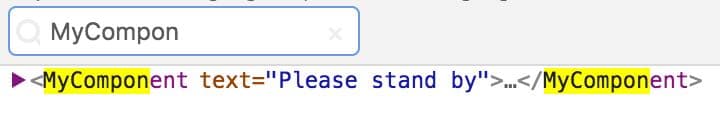
Search
In cases where your component tree is tall or complex, the search feature comes to the rescue.
Console debugging
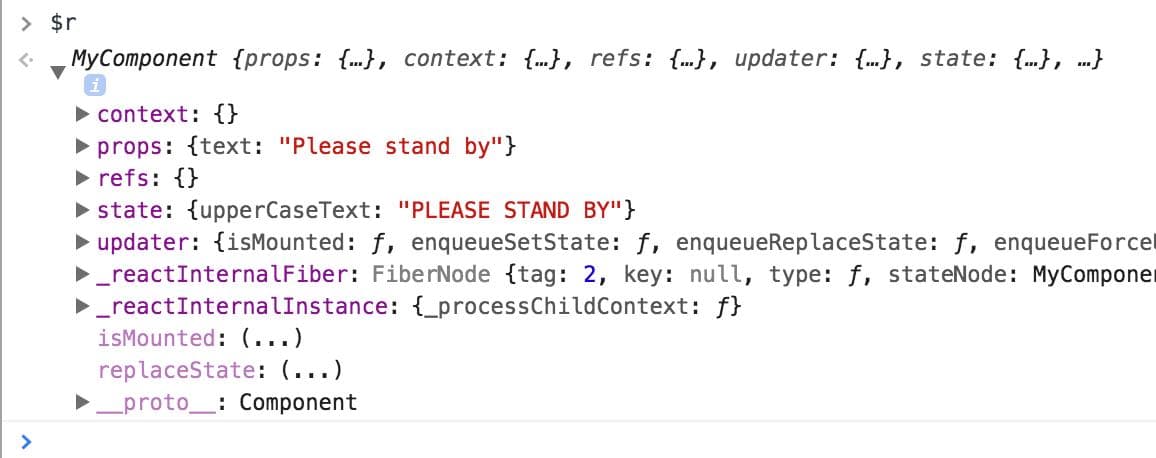
One often-overlooked feature in React Devtools is the ability to access selected elements in the JavaScript console. Notice the $r next to selected elements in the component tree — this is the name of the variable we can use to access the instance:
Final Thoughts
The same thing that makes debugging React applications a struggle for some also makes it a breeze for others. In most cases, debugging reactively simply means closely inspecting your app’s state or view.
Mastering the features in React Devtools is a highly effective way to do both of these tasks at once.
Thanks for learning with the DigitalOcean Community. Check out our offerings for compute, storage, networking, and managed databases.
About the author
Still looking for an answer?
This textbox defaults to using Markdown to format your answer.
You can type !ref in this text area to quickly search our full set of tutorials, documentation & marketplace offerings and insert the link!
 This work is licensed under a Creative Commons Attribution-NonCommercial- ShareAlike 4.0 International License.
Become a contributor for community
Get paid to write technical tutorials and select a tech-focused charity to receive a matching donation.

DigitalOcean Documentation
Full documentation for every DigitalOcean product.

Resources for startups and AI-native businesses
The Wave has everything you need to know about building a business, from raising funding to marketing your product.
The developer cloud
Scale up as you grow — whether you're running one virtual machine or ten thousand.

Start building today
From GPU-powered inference and Kubernetes to managed databases and storage, get everything you need to build, scale, and deploy intelligent applications.
