By Cristian Marius Tiutiu, Bikram Gupta and Anish Singh Walia

Introduction
In a real-world scenario, you want to have resiliency for your applications. On the other hand, you want to be more efficient on resources and cut down costs as well. You need something that can scale your application on demand.
Most of the time you created Kubernetes Deployments for your applications using a fixed ReplicaSet number. But, in production environments which are variably put under load by external requests, it is not always that simple. It is inefficient to change the replica set value every time your web application is under load and starts to misbehave. Main reason(s) can be: your application receives more requests each afternoon (a specific period of the day), or when holidays are coming and many users visit your shopping site. Then, when the crowded period is over, you must go back and scale down your web deployments to avoid waste of resources and reduce infrastructure costs.
This is where Horizontal Pod Autoscaling kicks in, and provides a solution for more efficient resource usage, as well as reducing costs. It is a closed loop system that automatically grows or shrinks resources (application Pods), based on current needs. You create a HorizontalPodAutoscaler (or HPA) resource for each application deployment that needs autoscaling and let it take care of the rest for you automatically.
Horizontal pod scaling deals with adjusting replicas for application Pods, whereas vertical pod scaling deals with resource requests and limits for containers within Pods.
How Horizontal Pod Autoscaling Works
At a high level, HPA does the following:
- Keeps an eye on resource requests metrics coming from your application workloads (Pods), by querying the metrics server.
- Compare the target threshold value that you set in the HPA definition with the average resource utilization observed for your application workloads (CPU and memory).
- If the target threshold is reached, then HPA will scale up your application deployment to meet higher demands. Otherwise, if below the threshold, it will scale down the deployment. To see what logic HPA uses to scale your application deployment, please visit the algorithm details page from the official documentation.
Under the hood, a HorizontalPodAutoscaler is just another CRD (Custom Resource Definition) that drives a Kubernetes control loop implemented via a dedicated controller within the Control Plane of your cluster. Basically, you create a HorizontalPodAutoscaler YAML manifest targeting your application Deployment, and then use kubectl to apply the HPA resource in your cluster. Please bear in mind that you cannot target objects that cannot be scaled, such as a DaemonSet for example.
In order to do its magic, HPA needs a metrics server available in your cluster to scrape required metrics, such as CPU and memory utilization. One popular option is the Kubernetes Metrics Server.
The metrics server acts as an extension for the Kubernetes API server, thus offering more features. In a nutshell, the Kubernetes Metrics Server works by collecting resource metrics from Kubelets and exposing them via the Kubernetes API Server to be consumed by Horizontal Pod Autoscaler. Metrics API can also be accessed by kubectl top, making it easier to debug autoscaling pipelines.
Please make sure to read and understand the metrics server’s main purpose by visiting the use cases section from the main documentation (this is important).
For custom metrics (anything other than CPU or memory), you can use Prometheus via a special adapter named prometheus-adapter. It means, you can scale applications using other metrics (such as the number of HTTP requests), rather than CPU and/or memory utilization.
This tutorial will show you how to:
- Deploy
Kubernetes Metrics Serverto yourDOKScluster. - Understand main concepts and how to create
HPAsfor your applications. - Test each HPA setup using two scenarios: constant and variable application load.
- Configure and use the
Prometheus Adapterto scale applications using custom metrics.
For more in-depth explanations, please visit the official documentation page for the Horizontal Pod Autoscaler.
Metrics Server and HPA Overview Diagram
The below diagram shows a high-level overview of how HPA works in conjunction with metrics-server:
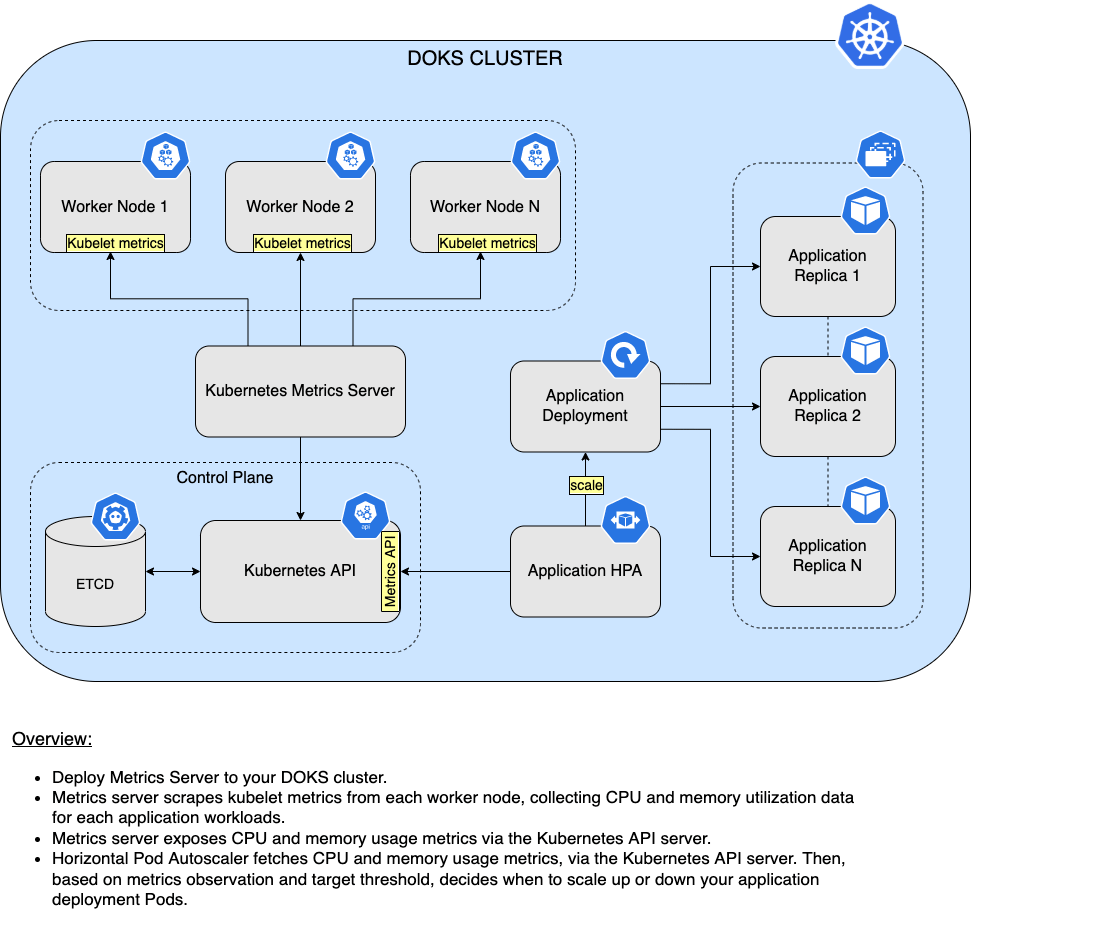
Table of Contents
Prerequisites
To complete this tutorial, you will need:
- A Git client to clone the
Starter Kitrepository. - Helm, for managing
Kubernetes Metrics Serverreleases and upgrades. - Kubectl, for
Kubernetesinteraction. Kubectl must be configured and ready to use. Please follow these instructions to connect to your cluster withkubectl.
In the next step, you will learn how to deploy the Kubernetes Metrics Server, using the Helm package manager.
Step 1 - Installing Kubernetes Metrics Server
Kubernetes metrics server can be installed in two ways:
- Via a single
kubectlcommand in high availability mode using:
kubectl apply -f https://github.com/kubernetes-sigs/metrics-server/releases/latest/download/high-availability.yaml
- Via
Helm, by deploying metrics-server chart to your cluster.
This tutorial (and all tutorials from the Starter Kit) uses the Helm installation method because it’s more flexible, and you can fine-tune the release parameters later on if needed. High availability is a must, and can be set easily via the replica field from the metrics-server Helm chart.
Please bear in mind that the metrics server deployment requires some special permissions. For more information about all prerequisites, please read the official requirements page.
Steps to deploy metrics server via Helm:
- First, clone the
Starter Kitrepository and change the directory to your local copy.
git clone https://github.com/digitalocean/Kubernetes-Starter-Kit-Developers.git
cd Kubernetes-Starter-Kit-Developers
- Next, add the metrics-server
Helmrepo and list the availablecharts:
helm repo add metrics-server https://kubernetes-sigs.github.io/metrics-server
helm repo update metrics-server
helm search repo metrics-server
The output looks similar to the following:
OutputNAME                            CHART VERSION   APP VERSION     DESCRIPTION
metrics-server/metrics-server   3.8.2           0.6.1           Metrics Server is a scalable, efficient source ...
Note:
The chart of interest is metrics-server/metrics-server, which will install Kubernetes metrics server on the cluster. Please visit the metrics-server chart page, for more details.
3. Then, open and inspect the metrics-server Helm values file provided in the Starter Kit repository, using an editor of your choice (preferably with YAML lint support). For example, you can use VS Code:
code 07-scaling-application-workloads/assets/manifests/metrics-server-values-v3.8.2.yaml
- Finally, install the
Kubernetes Metrics ServerusingHelm(a dedicatedmetrics-servernamespace will be created as well):
HELM_CHART_VERSION="3.8.2
helm install metrics-server metrics-server/metrics-server --version "$HELM_CHART_VERSION" \
--namespace metrics-server \
--create-namespace \
--f "07-scaling-application-workloads/assets/manifests/metrics-server-values-v${HELM_CHART_VERSION}.yaml"
Note:
A specific version for the metrics-server Helm chart is used. In this case 3.8.2 was picked, which maps to the 0.6.1 release of the metrics-server application (see the output from Step 2.). It’s good practice in general, to lock on a specific version. This helps to have predictable results, and allows versioning control via Git.
Observations and results:
You can verify metrics-server deployment status via:
helm ls -n metrics-server
The output looks similar to (notice that the STATUS column value is deployed):
OutputNAME            NAMESPACE       REVISION        UPDATED                                 STATUS          CHART                   APP VERSION
metrics-server  metrics-server  1               2022-02-24 14:58:23.785875 +0200 EET    deployed        metrics-server-3.8.2    0.6.1
Next, check all Kubernetes resources status from the metrics-server namespace:
kubectl get all -n metrics-server
The output looks similar to (notice the deployment and replicaset resources, which should be healthy and counted as 2):
OutputNAME                                  READY   STATUS    RESTARTS   AGE
pod/metrics-server-694d47d564-9sp5h   1/1     Running   0          8m54s
pod/metrics-server-694d47d564-cc4m2   1/1     Running   0          8m54s

NAME                     TYPE        CLUSTER-IP     EXTERNAL-IP   PORT(S)   AGE
service/metrics-server   ClusterIP   10.245.92.63   <none>        443/TCP   8m54s

NAME                             READY   UP-TO-DATE   AVAILABLE   AGE
deployment.apps/metrics-server   2/2     2            2           8m55s

NAME                                        DESIRED   CURRENT   READY   AGE
replicaset.apps/metrics-server-694d47d564   2         2         2       8m55s
Finally, check if the kubectl top command works (similar to Linux top command - prints current resource usage, such as CPU and memory). Below command displays current resource usage for all Pods in the kube-system namespace:
kubectl top pods -n kube-system
The output looks similar to (CPU usage is expressed in millicores, and memory usage in Mebibytes):
OutputNAME                               CPU(cores)   MEMORY(bytes)
cilium-operator-5db58f5b89-7kptj   2m           35Mi
cilium-r2n9t                       4m           150Mi
cilium-xlqkp                       9m           180Mi
coredns-85d9ccbb46-7xnkg           1m           21Mi
coredns-85d9ccbb46-gxg6d           1m           20Mi
csi-do-node-p6lq4                  1m           19Mi
csi-do-node-rxd6m                  1m           21Mi
do-node-agent-2z2bc                0m           15Mi
do-node-agent-ppds8                0m           21Mi
kube-proxy-l9ddv                   1m           25Mi
kube-proxy-t6c29                   1m           30Mi
If the output looks like above, then you configured metrics server correctly. In the next step, you will learn how to configure and test your first HorizontalPodAutoscaling resource.
Step 2 - Getting to Know HPAs
So far, each time you created a new Kubernetes deployment for your application, the ReplicaSet field was configured to a fixed value. This may suffice for simple cases, or development environments. In this step you will learn how to define a HPA CRD, and then focus on the first practical example.
In an HPA-based setup, the HorizontalPodAutoscaler takes control over the application deployment replica set field value. Typical HorizontalPodAutoscaler CRD looks like below:
apiVersion: autoscaling/v2beta2
kind: HorizontalPodAutoscaler
metadata:
  name: my-app-hpa
spec:
  scaleTargetRef:
    apiVersion: apps/v1
    kind: Deployment
    name: my-app-deployment
  minReplicas: 1
  maxReplicas: 3
  metrics:
    - type: Resource
      resource:
        name: cpu
        target:
          type: Utilization
          averageUtilization: 50
Explanations for the above configuration:
spec.scaleTargetRef: Reference to the scaled resource.spec.minReplicas: The lower limit for the number of replicas to which the autoscaler can scale down.spec.maxReplicas: The upper limit for the number of pods that can be set by the autoscaler.spec.metrics.type: Type of metric to use to calculate the desired replica count. The above example uses usingResourcetype, which tells the HPA to scale the deployment based on averageCPU(or memory) utilization (average utilization is set to a threshold value of50).
Next, you have two options to create an HPA for your application deployment:
- Use the
kubectl autoscalecommand on an existing deployment. - Create an HPA YAML manifest, and then use
kubectlto apply changes to your cluster.
The first option is for performing a quick test (or spin), and you don’t want to mess with YAML stuff yet. Please go ahead and try the first example provided in the Starter Kit:
- First, please clone the Starter Kit repository (if not already), and change the directory to your local copy:
git clone https://github.com/digitalocean/Kubernetes-Starter-Kit-Developers.git
cd Kubernetes-Starter-Kit-Developers
- Then, create the myapp-test deployment (main purpose is to create some CPU load, by printing a message indefinitely):
kubectl apply -f https://github.com/digitalocean/Kubernetes-Starter-Kit-Developers/blob/main/07-scaling-application-workloads/assets/manifests/hpa/metrics-server/myapp-test.yaml
- Finally, create a
HorizontalPodAutoscalertargeting themyapp-testdeployment:
kubectl autoscale deployment myapp-test --cpu-percent=50 --min=1 --max=3
The above action translates to: Please create an HPA resource for me that automatically scales my myapp-test deployment to a maximum of 3 replicas (and no less than 1 replica) whenever average CPU utilization hits 50%. You can check if the HPA resource was created by running:
kubectl get hpa
The output looks similar to (the TARGETS column shows a value of 50% which is the average CPU utilization that the HPA needs to maintain, whereas 240% is the current usage):
OutputNAME         REFERENCE                  TARGETS    MINPODS   MAXPODS   REPLICAS   AGE
myapp-test   Deployment/myapp-test      240%/50%   1         3         3          52s
The TARGETS column value will display <unknown>/50% for a while (around 15 seconds). This is normal, and it has to do with HPA fetching the specific metric and computing the average value over time. By default, HPA checks metrics every 15 seconds.
You can also observe the events a HPA generates under the hood via:
kubectl describe hpa myapp-test
The output looks similar to (notice in the Events list how the HPA is increasing the replica count automatically):
OutputName:                                                  myapp-test
Namespace:                                             default
Labels:                                                <none>
Annotations:                                           <none>
CreationTimestamp:                                     Mon, 28 Feb 2022 10:10:50 +0200
Reference:                                             Deployment/myapp-test
Metrics:                                               ( current / target )
  resource cpu on pods  (as a percentage of request):  240% (48m) / 50%
Min replicas:                                          1
Max replicas:                                          3
Deployment pods:                                       3 current / 3 desired
...
Events:
  Type    Reason             Age   From                       Message
  ----    ------             ----  ----                       -------
  Normal  SuccessfulRescale  17s   horizontal-pod-autoscaler  New size: 2; reason: cpu resource utilization (percentage of request) above target
  Normal  SuccessfulRescale  37s   horizontal-pod-autoscaler  New size: 3; reason: cpu resource utilization (percentage of request) above target
In a real-world scenario, you will want to use a dedicated YAML manifest to define each HPA. This way, you can track the changes by having the manifest committed in a Git repository, as well as come back to it later and perform changes.
Before moving to the next step, please delete the myapp-test deployment and corresponding HPA resource created earlier:
kubectl delete hpa myapp-test
kubectl delete deployment myapp-test
Next, you’re going to discover and test HPAs by looking at two different scenarios:
- The application creates a constant load by running some CPU-intensive tasks.
- External load is simulated via many successive HTTP calls for the application under test.
Step 3 - Scaling Applications Automatically via Metrics Server
The following HPA experiments are based on two scenarios:
- An application deployment that creates constant load by performing some CPU-intensive computations.
- A shell script simulates external load by performing fast successive HTTP calls for a web application.
Scenario 1 - Constant Load Test
In this scenario, you will create a sample application implemented using Python, which performs some CPU-intensive computations. The Python code is shown below:
import math

while True:
  x = 0.0001
  for i in range(1000000):
    x = x + math.sqrt(x)
    print(x)
  print("OK!")
The above code can be deployed via the constant-load-deployment-test manifest from the Starter Kit repository. The deployment will fetch a docker image hosting the required Python runtime and then attach a ConfigMap to the application Pod hosting the sample Python script shown earlier.
First, please clone the Starter Kit repository, and change directory to your local copy:
git clone https://github.com/digitalocean/Kubernetes-Starter-Kit-Developers.git
cd Kubernetes-Starter-Kit-Developers
Then, create the sample deployment for the first scenario via kubectl (a separate namespace is being created as well, for better observation):
kubectl create ns hpa-constant-load
kubectl apply -f https://github.com/digitalocean/Kubernetes-Starter-Kit-Developers/blob/06eec522f859bba957297d3068341df089468e97/07-scaling-application-workloads/assets/manifests/hpa/metrics-server/constant-load-deployment-test.yaml -n hpa-constant-load
Note: The sample deployment provided in this repository configures resource request limits for the sample application Pods. This is important because HPA logic relies on having resource request limits set for your Pods, and it won’t work otherwise. In general, it is advised to set resource request limits for all your application Pods to avoid things running out of control in your cluster.
Verify that the deployment was created successfully and that it’s up and running:
kubectl get deployments -n hpa-constant-load
The output looks similar to (notice that only one application Pod is running):
OutputNAME                            READY   UP-TO-DATE   AVAILABLE   AGE
constant-load-deployment-test   1/1     1            1           8s
Next, create the constant-load-hpa-test resource in your cluster, via kubectl:
kubectl apply -f https://github.com/digitalocean/Kubernetes-Starter-Kit-Developers/blob/main/07-scaling-application-workloads/assets/manifests/hpa/metrics-server/constant-load-hpa-test.yaml
The above command will create a HPA resource, targeting the sample deployment created earlier. You can check the constant-load-test HPA state via:
kubectl get hpa constant-load-test -n hpa-constant-load
The output looks similar to (notice the REFERENCE column targeting constant-load-deployment-test, as well as TARGETS column showing current CPU resource requests versus threshold value):
OutputNAME                 REFERENCE                                  TARGETS    MINPODS   MAXPODS   REPLICAS   AGE
constant-load-test   Deployment/constant-load-deployment-test   255%/50%   1         3         3          49s
You can also notice in the above output that the REPLICAS column value increased from 1 to 3 for the sample application deployment, as stated in the HPA CRD spec. The process took a short time to complete because the application used in this example created a load in no time. Going further, you can also inspect the HPA events and see the actions taken, via: kubectl describe hpa -n hpa-constant-load.
Scenario 2 - External Load Test
A more interesting and realistic scenario to test and study is where an external load is created for the application under test. For this experiment, you’re going to use a different namespace and set of manifests to observe the final behavior in complete isolation from the previous scenario.
The application under test is the quote of the moment sample server. On each HTTP request it sends a different quote as a response. You create load on the service by sending HTTP requests very fast (each 1ms roughly). There’s a helper script provided in the Starter Kit repository, which helps you achieve the results.
First, please create the quote deployment and service using kubectl (also a dedicated hpa-external-load namespace is created beforehand). Please make sure to change the directory to Kubernetes-Starter-Kit-Developers first:
kubectl create ns hpa-external-load
kubectl apply -f 07-scaling-application-workloads/assets/manifests/hpa/metrics-server/quote_deployment.yaml -n hpa-external-load
Now, verify if the quote application deployment and services are healthy:
kubectl get all -n hpa-external-load
The output looks similar to:
OutputNAME                             READY   STATUS    RESTARTS   AGE
pod/quote-dffd65947-s56c9        1/1     Running   0          3m5s

NAME            TYPE        CLUSTER-IP       EXTERNAL-IP   PORT(S)   AGE
service/quote   ClusterIP   10.245.170.194   <none>        80/TCP    3m5s

NAME                        READY   UP-TO-DATE   AVAILABLE   AGE
deployment.apps/quote       1/1     1            1           3m5s

NAME                                   DESIRED   CURRENT   READY   AGE
replicaset.apps/quote-6c8f564ff        1         1         1       3m5s
Next, create the HPA for the quote deployment using kubectl:
kubectl apply -f 07-scaling-application-workloads/assets/manifests/hpa/metrics-server/quote-deployment-hpa-test.yaml -n hpa-external-load
Now, check if the HPA resource is in place and alive:
kubectl get hpa external-load-test -n hpa-external-load
The output looks similar to:
OutputNAME                 REFERENCE          TARGETS   MINPODS   MAXPODS   REPLICAS   AGE
external-load-test   Deployment/quote   1%/20%    1         3         1          108s
Please note that in this case, there’s a different threshold value set for the CPU utilization resource metric, as well as a different scale-down behavior. The external-load-test HPA CRD looks like below:
apiVersion: autoscaling/v2beta2
kind: HorizontalPodAutoscaler
metadata:
  name: external-load-test
spec:
  scaleTargetRef:
    apiVersion: apps/v1
    kind: Deployment
    name: quote
  behavior:
    scaleDown:
      stabilizationWindowSeconds: 60
  minReplicas: 1
  maxReplicas: 3
  metrics:
    - type: Resource
      resource:
        name: cpu
        target:
          type: Utilization
          averageUtilization: 20
The above configuration alters the scaleDown.stabilizationWindowSeconds behavior and sets it to a lower value of 60 seconds. This is not really needed in practice, but in this case, you may want to speed up things to see more quickly how the auto scaler performs the scale-down action. By default, the HorizontalPodAutoscaler has a cool-down period of 5 minutes (or 300 seconds). This is sufficient in most of the cases and should avoid fluctuations when replicas are being scaled.
In the final step, you will run the helper script provided in this repository to create an external load for the target application (meaning the quote server). The script performs successive HTTP calls in a really short period of time, thus trying to simulate external load coming from the users (should suffice for demonstration purposes).
Please make sure to split the terminal in two separate windows in order to observe the results better (you can use tmux, for example). Then, in the first window, please invoke the quote service load test shell script (you can cancel execution anytime by pressing Ctrl+C):
./quote_service_load_test.sh
Next, in the second window, run a kubectl watch (via the -w flag) on the HPA resource:
kubectl get hpa -n hpa-external-load -w
The animation below will show you the experiment results:

You can observe how the autoscaler kicks in when load increases (as long as the load generator script runs), and alters the quote server deployment replica set to a higher value. As soon as the load generator script is stopped, there’s a cool-down period, and after 1 minute or so, the replica set is lowered to the initial value of 1.
Next, you will learn how to scale applications on custom metrics coming from Prometheus. As an example, you can scale deployments based on the number of HTTP requests an application receives rather than CPU and/or memory utilization.
Step 4 - Scaling Applications Automatically via Prometheus Adapter
So far you learned how to horizontally scale applications based on CPU metrics (memory metrics can be used as well, but not covered in this tutorial). This is what metrics server was meant for and that’s it. But, you can also automatically scale applications on custom metrics. Thus, you can leverage Prometheus for the job, and let the HPA take decisions based on Prometheus metrics. Such an example is the number of HTTP requests hitting a web application, thus have the HPA scale your deployment based on the incoming traffic.
To accomplish this task, you need to install a special piece of software called the prometheus-adapter. The main purpose of the prometheus-adapter is to act as a bridge (or translator) between Prometheus and the Kubernetes API server.
When to choose metrics-server over prometheus-adapter or vice versa?
Well, metrics-server is fast, low on resources, and provides only the basic set of metrics (CPU and memory) for HPAs to work, thus making it a good candidate when you don’t want to use a full-blown monitoring system. On the other hand, when you need more granular control over HPAs and scale on other metrics not covered by the metrics server, then Prometheus in combination with the prometheus-adapter is a better choice.
The following steps assume that you have Prometheus Operator deployed in your cluster. Basic knowledge of ServiceMonitors is required as well. If not, please follow the Prometheus Monitoring Stack chapter from the Starter Kit repository. You also need a ServiceMonitor to scrape metrics from the application under test and send them to the Kubernetes API server via the prometheus-adapter. Then, the horizontal pod auto scaler can fetch custom metrics from the Kubernetes API Server and scale your applications appropriately.
The basic steps required for applications autoscaling using custom metrics served by Prometheus are as follows:
- First, you need the
prometheus-adapterinstalled in your cluster. - Next, you define
ServiceMonitorsforPrometheusto scrapecustom metricsfrom your applications. - Then, you define
discovery rulesforprometheus-adapterto expose your applicationcustom metricsin theKubernetes API. - Finally, you create the
HPAtargeting your application deployment, and configure it to scale on custom metric(s).
Installing Prometheus Adapter
Prometheus adapter can be installed the usual way, via Helm. Please follow the below steps:
- First, clone the
Starter Kitrepository, and change the directory to your local copy:
git clone https://github.com/digitalocean/Kubernetes-Starter-Kit-Developers.git
Kubernetes-Starter-Kit-Developers
- Next, add the
prometheus-communityHelm repo and list the available charts:
helm repo add prometheus-community https://prometheus-community.github.io/helm-chart
helm repo update prometheus-community
helm search repo prometheus-community
The output looks similar to the following:
OutputNAME                                                    CHART VERSION   APP VERSION     DESCRIPTION
prometheus-community/alertmanager                       0.18.0          v0.23.0         The Alertmanager handles alerts sent by client ...
prometheus-community/kube-prometheus-stack              35.5.1          0.56.3          kube-prometheus-stack collects Kubernetes manif...
prometheus-community/kube-state-metrics                 4.9.2           2.5.1           Install kube-state-metrics to generate and expo...
prometheus-community/prometheus                         15.10.1         2.34.0          Prometheus is a monitoring system and time seri...
prometheus-community/prometheus-adapter                 3.3.1           v0.9.1          A Helm chart for k8s prometheus adapter
...
The chart of interest is prometheus-community/prometheus-adapter, which will install prometheus-adapter on the cluster. Please visit the prometheus-adapter chart page, for more details.
3. Then, open and inspect the prometheus-adapter Helm values file provided in the Starter Kit repository, using an editor of your choice (preferably with YAML lint support). For example, you can use VS Code:
code https://github.com/digitalocean/Kubernetes-Starter-Kit-Developers/blob/main/07-scaling-application-workloads/assets/manifests/prometheus-adapter-values-v3.3.1.yaml
- Make sure to adjust the Prometheus endpoint setting based on your setup (explanations are provided in the Helm values file).
- Finally, save the values file and install
prometheus-adapterusingHelm(a dedicatedprometheus-adapternamespace is being provisioned as well):
HELM_CHART_VERSION="3.3.1"
helm install prometheus-adapter prometheus-community/prometheus-adapter \
--version "$HELM_CHART_VERSION" \
--namespace prometheus-adapter \
--create-namespace \
-f "07-scaling-application-workloads/assets/manifests/prometheus-adapter-values-v${HELM_CHART_VERSION}.yaml"
A specific version for the prometheus-adapter Helm chart is used. In this case, 3.3.1 was picked, which maps to the 0.9.1 release of the Prometheus-adapter application (see the output from Step 2.). It’s good practice, in general, to lock on a specific version. This helps to have predictable results, and allows versioning control via Git.
Observations and results:
You can verify prometheus-adapter deployment status via:
helm ls -n prometheus-adapter
The output looks similar to (notice the STATUS column value set to deployed):
OutputNAME                 NAMESPACE            REVISION   UPDATED                STATUS     CHART                      APP VERSION
prometheus-adapter   prometheus-adapter   1          2022-03-01 12:06:22    deployed   prometheus-adapter-3.3.1   v0.9.1
Next, check the Kubernetes resources status from the prometheus-adapter namespace:
kubectl get all -n prometheus-adapter
The output looks similar to (notice the deployment and replicaset resources, which should be healthy and counted as 2):
OutputNAME                                      READY   STATUS    RESTARTS   AGE
pod/prometheus-adapter-7f475b958b-fd9sm   1/1     Running   0          2m54s
pod/prometheus-adapter-7f475b958b-plzbw   1/1     Running   0          2m54s

NAME                         TYPE        CLUSTER-IP      EXTERNAL-IP   PORT(S)   AGE
service/prometheus-adapter   ClusterIP   10.245.150.99   <none>        443/TCP   2m55s

NAME                                 READY   UP-TO-DATE   AVAILABLE   AGE
deployment.apps/prometheus-adapter   2/2     2            2           2m55s

NAME                                            DESIRED   CURRENT   READY   AGE
replicaset.apps/prometheus-adapter-7f475b958b   2         2         2       2m55s
After a few moments, you can query the custom.metrics.k8s.io API and redirect the output to a file:
kubectl get --raw /apis/custom.metrics.k8s.io/v1beta1 > custom_metrics_k8s_io.json
Looking at the custom_metrics_k8s_io.json file contents, you can observe some of the custom metrics exposed by the Kubernetes API server:
{
 "kind": "APIResourceList",
 "apiVersion": "v1",
 "groupVersion": "custom.metrics.k8s.io/v1beta1",
 "resources": [
     {
         "name": "jobs.batch/prometheus_sd_kubernetes_events",
         "singularName": "",
         "namespaced": true,
         "kind": "MetricValueList",
         "verbs": [
             "get"
         ]
     },
     {
         "name": "services/kube_statefulset_labels",
         "singularName": "",
         "namespaced": true,
         "kind": "MetricValueList",
         "verbs": [
             "get"
         ]
     },
...
If the output is similar to the above, then you installed and configured the prometheus-adapter correctly. Next, you will learn how to set up a sample application deployment providing a custom metrics endpoint. Then, you will configure a Prometheus ServiceMonitor to scrape the metrics endpoint.
Creating a Sample Application to Test Prometheus Adapter
In this step, you will deploy the prometheus-example application which exposes the following custom metrics:
http_requests_total- total number of incoming HTTP requests.http_request_duration_seconds- duration of all HTTP requests.http_request_duration_seconds_count- total count of all incoming HTTP requests.http_request_duration_seconds_sum- total duration in seconds of all incoming HTTP requests.http_request_duration_seconds_bucket- a histogram representation of the duration of the incoming HTTP requests.
After the prometheus-example application is deployed, you can test the custom metrics HPA setup. Then, you can fire multiple HTTP requests against the prometheus-example service and see how autoscaling works based on the http_requests_total metric.
First, change the directory where Starter Kit was cloned on your local machine:
cd Kubernetes-Starter-Kit-Developers
Then, please deploy the prometheus-example application using the YAML manifest from the Starter Kit repository. The provided manifest will create the prometheus-example deployment resource, as well as the associated Kubernetes service. A separate namespace named prometheus-custom-metrics-test is created as well, to test the whole setup:
kubectl create ns prometheus-custom-metrics-test
kubectl apply -f 07-scaling-application-workloads/assets/manifests/hpa/prometheus-adapter/prometheus-example-deployment.yaml -n prometheus-custom-metrics-test
Next, verify the resources created in the prometheus-custom-metrics-test namespace:
kubectl get all -n prometheus-custom-metrics-test
The output looks similar to (notice the prometheus-example-app Pod which must be up and running, as well as the associated service):
OutputNAME                                          READY   STATUS    RESTARTS   AGE
pod/prometheus-example-app-7455d5c48f-wbshc   1/1     Running   0          9s

NAME                             TYPE        CLUSTER-IP       EXTERNAL-IP   PORT(S)   AGE
service/prometheus-example-app   ClusterIP   10.245.103.235   <none>        80/TCP    10s

NAME                                     READY   UP-TO-DATE   AVAILABLE   AGE
deployment.apps/prometheus-example-app   1/1     1            1           10s

NAME                                                DESIRED   CURRENT   READY   AGE
replicaset.apps/prometheus-example-app-7455d5c48f   1         1         1       10s
Creating a ServiceMonitor for the Application under Test
Before creating the ServiceMonitor resource, you have to check the serviceMonitorSelector configuration of your Prometheus instance. Please follow the steps below:
- First, check what Prometheus instance(s) is available in your cluster (the
monitoringnamespace is used by theStarter Kit, so please adjust according to your setup):
kubectl get prometheus -n monitoring
The output looks similar to:
OutputNAME                                    VERSION   REPLICAS   AGE
kube-prom-stack-kube-prome-prometheus   v2.35.0   1          7h4m
- Now, pick the prometheus instance discovered in the previous step (if you have multiple instances, just pick the correct one based on your setup), and fetch the
serviceMonitorSelector.matchLabelsfield value:
kubectl get prometheus kube-prom-stack-kube-prome-prometheus -n monitoring -o jsonpath='{.spec.serviceMonitorSelector.matchLabels}'
The output looks similar to (notice that there’s one label named release):
{"release":"kube-prom-stack"}
By default, each Prometheus instance is configured to discover only service monitors that match a specific label. So, in order for the prometheus-example-app ServiceMonitor to be discovered by Prometheus, you need to label it using release: kube-prom-stack.
Change the directory where Starter Kit was cloned on your local machine:
cd Kubernetes-Starter-Kit-Developers
Now open the prometheus-example-service-monitor manifest provided in the Starter Kit repository, using an editor of your choice (preferably with YAML lint support). For example, you can use VS Code:
code 07-scaling-application-workloads/assets/manifests/hpa/prometheus-adapter/prometheus-example-service-monitor.yaml
In the metadata.labels section, make sure to add the label discovered earlier (release: kube-prom-stack). The ServiceMonitor manifest looks similar to:
kind: ServiceMonitor
apiVersion: monitoring.coreos.com/v1
metadata:
  name: prometheus-example-app
  labels:
    app: prometheus-example-app
    release: kube-prom-stack
spec:
  selector:
    matchLabels:
      app.kubernetes.io/name: prometheus-example-app
  namespaceSelector:
    matchNames:
      - prometheus-custom-metrics-test
  endpoints:
    - port: web
Finally, create the required ServiceMonitor for Prometheus to scrape the /metrics endpoint of the prometheus-example-app:
kubectl apply -f 07-scaling-application-workloads/assets/manifests/hpa/prometheus-adapter/prometheus-example-service-monitor.yaml -n prometheus-custom-metrics-test
After completing the above steps, you should see a new target being present in the Targets panel from the Prometheus dashboard. First, you need to port-forward the main Prometheus service to access the dashboard (the below sample command is using the Starter Kit naming conventions, so please adjust based on your current setup):
kubectl port-forward svc/kube-prom-stack-kube-prome-prometheus 9090:9090 -n monitoring
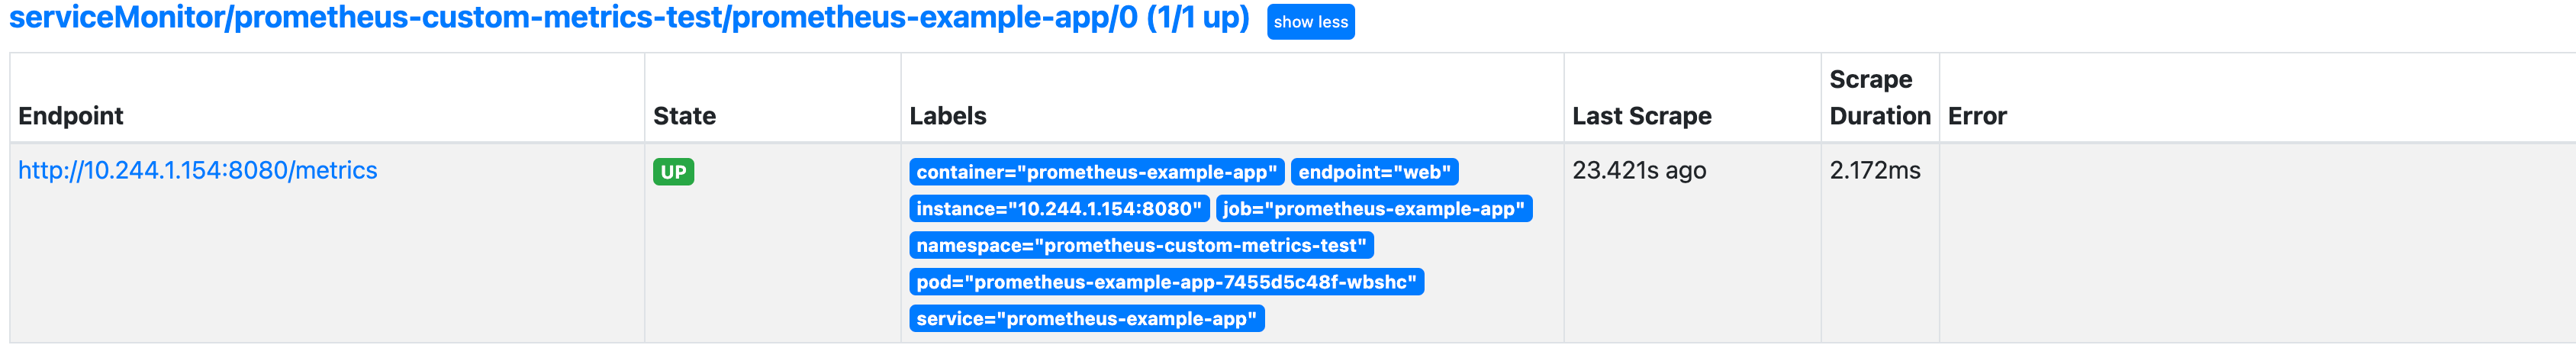
Open a web browser on localhost:9090. Once in, you can go to Status -> Targets, and see that the target has been added.
The output looks similar to (notice the prometheus-example-app present in the discovered targets list):
Defining Discovery Rules for Prometheus Adapter
Although Prometheus is able to scrape and see your application custom metrics, the prometheus-adapter is not going to expose them in the custom metrics API of Kubernetes. You need to define a set of discovery rules to help Prometheus-adapter expose your application’s custom metrics.
Quoting from the official documentation:
The adapter determines which metrics to expose and how to expose them through a set of “discovery” rules. Each rule is executed independently (so make sure that your rules are mutually exclusive), and specifies each of the steps the adapter needs to take to expose a metric in the API.
Each rule can be broken down into roughly four parts:
- Discovery, which specifies how the adapter should find all Prometheus metrics for this rule.
- Association, which specifies how the adapter should determine which Kubernetes resources a particular metric is associated with.
- Naming, which specifies how the adapter should expose the metric in the custom metrics API.
- Querying, which specifies how a request for a particular metric on one or more Kubernetes objects should be turned into a query to Prometheus.
Typical discovery rule definition looks similar to:
rules:
  custom:
    - seriesQuery: 'http_requests_total{pod!=""}'
      resources:
        template: "<<.Resource>>"
      name:
        matches: "^(.*)_total"
        as: "${1}_per_second"
      metricsQuery: "sum(rate(<<.Series>>{<<.LabelMatchers>>}[2m])) by (<<.GroupBy>>)"
You can break the above configuration into pieces, to understand it better:
seriesQuery: Represents the metric you’re interested in, as exposed by the application/metricsendpoint (vectorial representation). This is theDiscoverypart of the rule definition, and tellsprometheus-adapterto select thehttp_requests_totalmetric for all your applicationPodsthat are not null (pod!="").resources.template: This is a Prometheus template, and represents the resource that exposes the metrics (e.g.Pod). This is theAssociationpart of the rule definition.name: Defines a name for the rule. Basically you’re tellingprometheus-adapterto renamehttp_requests_totaltohttp_requests_per_second. In the end you’re interested in the number of http requests per second, and not just a simple counter. This is theNamingpart of the rule definition.metricsQuery: Represents a parameterized Prometheus query. It should look familiar because it’s just PromQL. Here, we compute the http requests rate on average, over a predefined period (e.g. 2 minutes). This is theQueryingpart of the rule definition.
Now that you know how to set up discovery rules for prometheus-adapter, it’s time to put all knowledge into practice. Please follow below steps to instruct prometheus-adapter to use your custom rule(s):
- First, change the directory where
Starter Kitwas cloned on your local machine:
cd Kubernetes-Starter-Kit-Developers
- Next, please open the
prometheus-adapterHelm values file provided in theStarter Kitrepository, using an editor of your choice (preferably withYAMLlint support). For example, you can use VS Code:
code https://github.com/digitalocean/Kubernetes-Starter-Kit-Developers/blob/main/07-scaling-application-workloads/assets/manifests/prometheus-adapter-values-v3.3.1.yaml
- Look for the
rulessection, and uncomment everything. It should look like below:
rules:
  custom:
    - seriesQuery: 'http_requests_total{pod!=""}'
      resources:
        template: "<<.Resource>>"
      name:
        matches: "^(.*)_total"
        as: "${1}_per_second"
      metricsQuery: "sum(rate(<<.Series>>{<<.LabelMatchers>>}[2m])) by (<<.GroupBy>>)"
-
Save the values file, and apply changes via a
Helmupgrade:HELM_CHART_VERSION="3.3.1" helm upgrade prometheus-adapter prometheus-community/prometheus-adapter \ --version "$HELM_CHART_VERSION" \ --namespace prometheus-adapter \ -f "07-scaling-application-workloads/assets/manifests/prometheus-adapter-values-v${HELM_CHART_VERSION}.yaml"
Note:
Please note that with no incoming requests, only the version metric is reported. To generate some HTTP requests you need to:
kubectl port-forward svc/prometheus-example-app 8080:8080 -n prometheus-custom-metrics-test
Open a web browser on http://localhost:8080 and refresh the application’s homepage a few times.
If everything goes well, you can query the custom metrics API and observe the new metric (you can install jq, and have the results printed nicely):
kubectl get --raw="/apis/custom.metrics.k8s.io/v1beta1/namespaces/prometheus-custom-metrics-test/pods/*/http_requests_per_second" | jq .
The output looks similar to:
{
  "kind": "MetricValueList",
  "apiVersion": "custom.metrics.k8s.io/v1beta1",
  "metadata": {
    "selfLink": "/apis/custom.metrics.k8s.io/v1beta1/namespaces/prometheus-custom-metrics-test/pods/%2A/http_requests_per_second"
  },
  "items": [
    {
      "describedObject": {
        "kind": "Pod",
        "namespace": "prometheus-custom-metrics-test",
        "name": "prometheus-example-app-7455d5c48f-wbshc",
        "apiVersion": "/v1"
      },
      "metricName": "http_requests_per_second",
      "timestamp": "2022-03-02T13:33:32Z",
      "value": "0",
      "selector": null
    }
  ]
}
Looking at the above output, you can notice the custom http_requests_per_second metric with a value of 0. This is normal because you haven’t generated any load for the application yet.
Now, you can move to the final step and create an HPA for the Prometheus-example-app deployment used in this tutorial. Then, you will create a load on the application using the custom_metrics_service_load_test script provided in the Starter Kit repository.
Creating and Testing HPAs using Custom Metrics
Defining an HPA for automatically scaling applications on custom metrics is similar to the metrics server examples. The only difference is the metrics field, which in this case is using custom metrics to help HPA make decisions (e.g., http_requests_per_second).
Typical HPA definition based on custom metrics looks like below (explanations for the important fields can be found inline):
kind: HorizontalPodAutoscaler
apiVersion: autoscaling/v2beta2
metadata:
  name: prometheus-example-app
spec:
  scaleTargetRef:
    apiVersion: apps/v1
    kind: Deployment
    name: prometheus-example-app
  minReplicas: 1
  maxReplicas: 5
  metrics:
    # use a "Pods" metric, which takes the average of the
    # given metric across all pods controlled by the autoscaling target
    - type: Pods
      pods:
        metricName: http_requests_per_second
        # target 500 milli-requests per second,
        # which is 1 request every two seconds
        targetAverageValue: 500m
First, change directory where Starter Kit was cloned on your local machine:
cd Kubernetes-Starter-Kit-Developers
Next, create the prometheus-custom-metrics-hpa resource in your cluster, via kubectl:
kubectl apply -f https://github.com/digitalocean/Kubernetes-Starter-Kit-Developers/blob/06eec522f859bba957297d3068341df089468e97/07-scaling-application-workloads/assets/manifests/hpa/prometheus-adapter/prometheus-custom-metrics-hpa.yaml
The above command will create a HPA resource, targeting the sample deployment created earlier. You can check the HPA state via:
kubectl get hpa -n prometheus-custom-metrics-test
The output looks similar to (notice the REFERENCE column targeting the prometheus-example-app deployment, as well as the TARGETS column showing current http_requests_per_second versus threshold value):
OutputNAME                        REFERENCE                           TARGETS   MINPODS   MAXPODS   REPLICAS   AGE
prometheus-custom-metrics   Deployment/prometheus-example-app   0/500m    1         5         1          19s
In the final step, you will run the helper script provided in this repository to create a load on the target (meaning the Prometheus-example-app). The script performs successive HTTP calls in a short period, thus simulating external load coming from the users (should suffice for demonstration purposes).
Please make sure to split the terminal in two separate windows in order to observe the results better (you can use tmux, for example). Then, in the first window, please invoke the custom_metrics_service_load_test shell script (you can cancel execution anytime by pressing Ctrl+C):
./custom_metrics_service_load_test.sh
Next, in the second window, set a kubectl watch (via the -w flag) for the HPA resource:
kubectl get hpa -n prometheus-custom-metrics-test -w
The below screenshot will show you the experiment results:
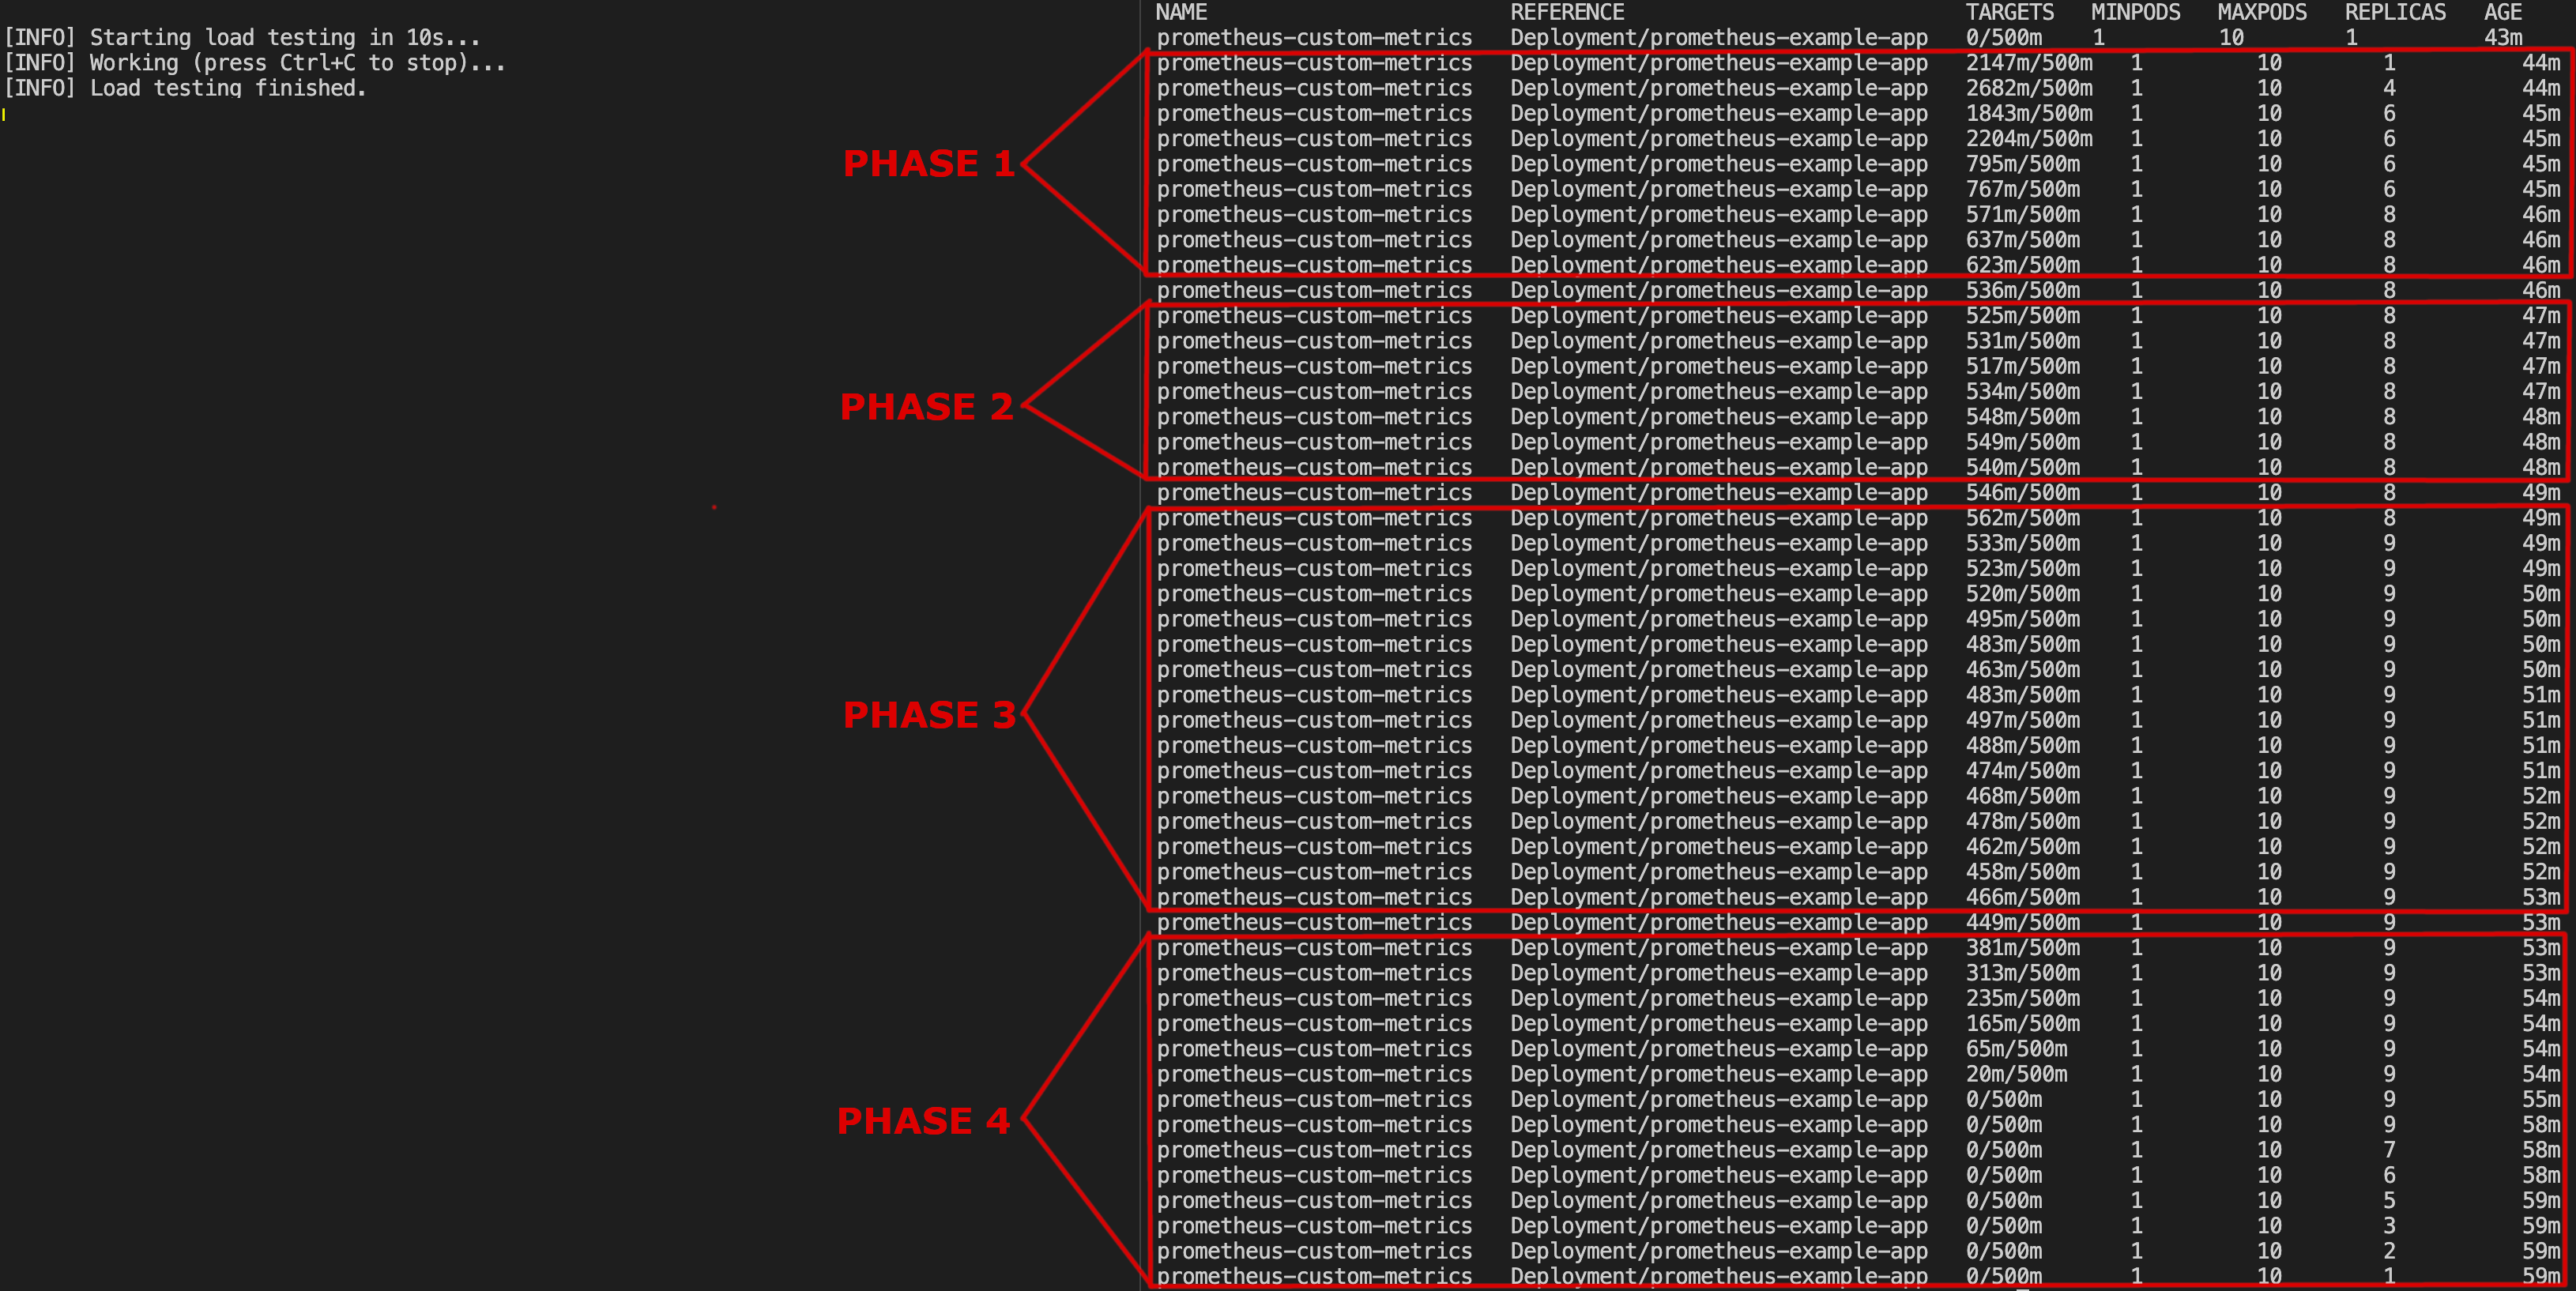
You can observe how the autoscaler kicks in when load increases (as long as the load generator script runs), and alters the prometheus-example-app deployment replica set to a higher value. As soon as the load generator script is stopped, there’s a cool-down period, and after about 5 minutes or so, the replica set is lowered to the initial value of 1.
The following phases are highlighted:
Phase 1: This is the ramp-up phase. Notice how HAP alters thereplica set, and it’s almost gradually increased from a value of1to a value of8. The initial load is around2140milli-requests per second, then decreases to a more manageable value of620milli-requests per second as more application Pods are added.Phase 2: This is where things are getting more stable. The current load has minor fluctuations between520-540milli-requests per second.Phase 3: In this phase, you can notice a bump of more than 10% of the threshold value. The current load increased momentarily to a value of562milli-requests per second. We’re out of thehysteresis window, so the HPA will add more replicas (9) to compensate and stabilize the system. This has almost an immediate effect, and the load starts to decrease under the threshold value, around480milli-requests per second.Phase 4: Here, the load generator script is stopped. You can observe that the load seen by the application is decreasing pretty fast. In about5 minutesor so (default cooldown value), thereplica setis adjusted back to the minimum value of1.
What happens in between? The word hysteresis was mentioned at some point. Suppose the average number of HTTP requests can be stabilized to a value closer to the threshold (assuming a maximum deviation allowed of ± 10%, for example). In that case, the HPA won’t increase the replica set anymore (even though the upper limit was not reached). This is called hysteresis, and it’s part of the HPA logic to avoid fluctuations for the replica set. As a matter of fact, maintaining hysteresis is important in every system where stability is required, thus avoiding oscillations.
Conclusion
In this tutorial you learned how to scale on resource requests metrics using metrics-server, as well as on custom metrics (via prometheus-adapter and Prometheus). Although setting up prometheus-adapter and scaling applications using custom metrics seems a little bit more involved, it offers more flexibility, thus rewarding the effort.
You also simulated some real-world scenarios. Then, you observed how HPAs do their magic and try to stabilize your application (by scaling it automatically), and compensate for the increased load (or heavy traffic).
You can learn more about HPAs using the below resources:
To automate everything in the Starter Kit, please refer to Section 14 - Continuous Delivery using GitOps.
Thanks for learning with the DigitalOcean Community. Check out our offerings for compute, storage, networking, and managed databases.
About the author(s)
I help Businesses scale with AI x SEO x (authentic) Content that revives traffic and keeps leads flowing | 3,000,000+ Average monthly readers on Medium | Sr Technical Writer(Team Lead) @ DigitalOcean | Ex-Cloud Consultant @ AMEX | Ex-Site Reliability Engineer(DevOps)@Nutanix
Still looking for an answer?
This textbox defaults to using Markdown to format your answer.
You can type !ref in this text area to quickly search our full set of tutorials, documentation & marketplace offerings and insert the link!
 This work is licensed under a Creative Commons Attribution-NonCommercial- ShareAlike 4.0 International License.
Become a contributor for community
Get paid to write technical tutorials and select a tech-focused charity to receive a matching donation.

DigitalOcean Documentation
Full documentation for every DigitalOcean product.

Resources for startups and AI-native businesses
The Wave has everything you need to know about building a business, from raising funding to marketing your product.
The developer cloud
Scale up as you grow — whether you're running one virtual machine or ten thousand.

Start building today
From GPU-powered inference and Kubernetes to managed databases and storage, get everything you need to build, scale, and deploy intelligent applications.
