
When it comes to charting on the web, there are two main heavy-hitters: D3.js and Chart.js. But sometimes you don’t need a 500 pound gorilla. Sometimes you just want simple SVG charts that do exactly what you expect. That’s where Frappe Charts fits in. It’s a tiny, vanilla JS library that provides full-featured, animated, interactive SVG charts. And with a simple component wrapper, you can use it with Vue.js!
Getting Started
Start off by installing vue2-frappe. (I’m assuming you’ve already got a Vue.js project up and running.)
$ npm install --save vue2-frappe
Next, enable the plugin. (All it does is register the component.)
import Vue from 'vue';
import VueFrappe from 'vue2-frappe';
import App from './App.vue';

Vue.use(VueFrappe);

new Vue({
  el: '#app',
  render: h => h(App)
});
Making Charts
vue2-frappe is a simple wrapper for Frappe Charts that simply provides the configuration options to frappe as component properties. You you can directly use Frappe Chart’s documentation by changing top-level option keys into Vue.js property bindings.
<template>
<div id="app">
<h2>Chart: Benedict's Weight</h2>
<!-- id - Every chart must have an id. -->
<!-- title - The title displayed on the chart -->
<!-- type - The type of chart: line, bar, percent, pie, or axis-mixed. -->
<!-- labels - Names for each value on the x-axis. -->
<!-- height- Optional: How tall the chart should be. -->
<!-- colors - Separate colors for each dataset. -->
<!-- lineOptions - Additional options for how to display line charts. See docs. -->
<!-- datasets - An array of objects containing names and values for each data set. -->
<vue-frappe
id="my-chart-id"
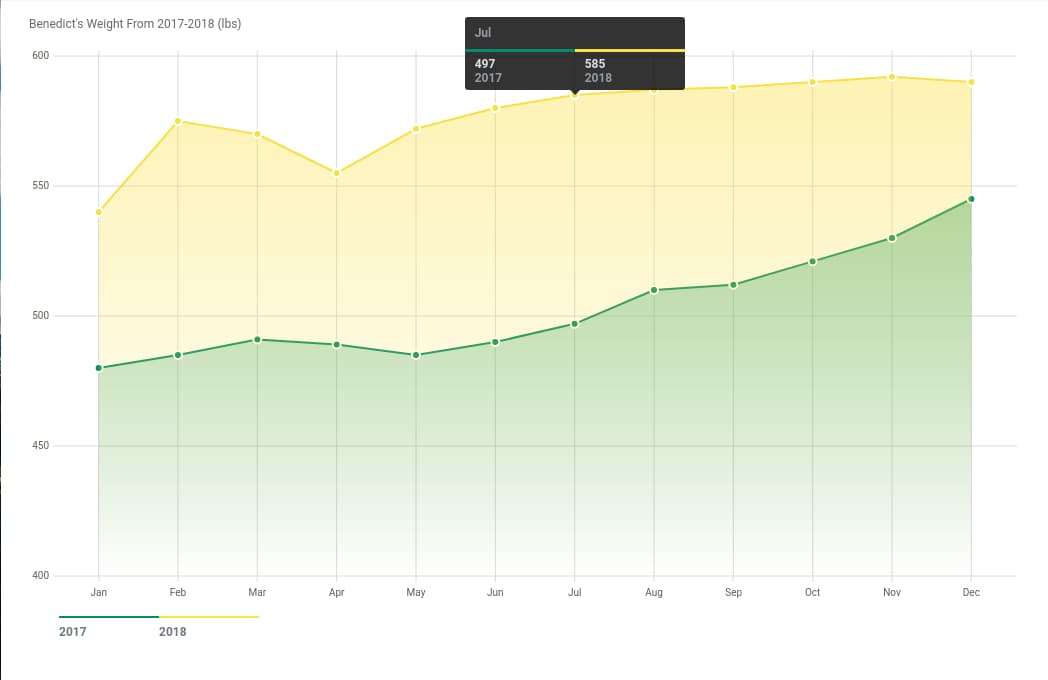
title="Benedict's Weight From 2017-2018 (lbs)"
type="line"
:labels="['Jan', 'Feb', 'Mar', 'Apr', 'May', 'Jun', 'Jul', 'Aug', 'Sep', 'Oct', 'Nov', 'Dec']"
:height="650"
:colors="['#008F68', '#FAE042']"
:lineOptions="{regionFill: 1}"
:datasets="[
{name: '2017', values: benedictsWeight2017},
{name: '2018', values: benedictsWeight2018}
]"
></vue-frappe>
<p>Conclusion: Benedict needs to go on a diet.</p>
</div>
</template>
<script>
export default {
name: 'app',
data() {
return {
benedictsWeight2017: [480, 485, 491, 489, 485, 490, 497, 510, 512, 521, 530, 545],
benedictsWeight2018: [540, 575, 570, 555, 572, 580, 585, 587, 588, 590, 592, 590]
}
}
}
</script>
The above should result in a chart like the one below:
And that’s just the beginning. Frappe Charts supports a variety of other types of charts - pie charts, bar charts, percentage charts, heatmaps, and advanced line and mixed charts. Take a look at their documentation!
Thanks for learning with the DigitalOcean Community. Check out our offerings for compute, storage, networking, and managed databases.
About the author
Still looking for an answer?
This textbox defaults to using Markdown to format your answer.
You can type !ref in this text area to quickly search our full set of tutorials, documentation & marketplace offerings and insert the link!
 This work is licensed under a Creative Commons Attribution-NonCommercial- ShareAlike 4.0 International License.
Become a contributor for community
Get paid to write technical tutorials and select a tech-focused charity to receive a matching donation.

DigitalOcean Documentation
Full documentation for every DigitalOcean product.

Resources for startups and AI-native businesses
The Wave has everything you need to know about building a business, from raising funding to marketing your product.
The developer cloud
Scale up as you grow — whether you're running one virtual machine or ten thousand.

Start building today
From GPU-powered inference and Kubernetes to managed databases and storage, get everything you need to build, scale, and deploy intelligent applications.
