
Heatmaps. A great marketing tool that works by tracking literally every move and click the mouse makes on a webpage, normalizes them, and sends them to a server for whomever might be on the other end to analyze (complete with pretty colors.) A perfectly good and acceptable use of your data and, well, mobile data. Well, if you find yourself needing to implement one of these in your Vue app, vue-heatmapjs is there to help.
Installation
Install vue-heatmapjs in your Vue.js project.
# Yarn
$ yarn add vue-heatmapjs

# NPM
$ npm install vue-heatmapjs --save
Usage
Now enable the plugin in the main Vue setup file.
import Vue from 'vue';
import App from './App.vue';
import heatmap from 'vue-heatmapjs';

Vue.use(heatmap, {
  // Fired on every click and mousemove.
  // data is an object with xy positions and heat value.
  // It would be a good idea to combine and throttle these before sending.
  afterAdd(data) {
    // Send the data here.
    logUserInteractions(data);
  }
});

new Vue({
  el: '#app',
  render: h => h(App)
});
Now, add the v-heatmap directive to the component you want to track.
<template>
  <div id="app" v-heatmap>
    ...
  </div>
</template>
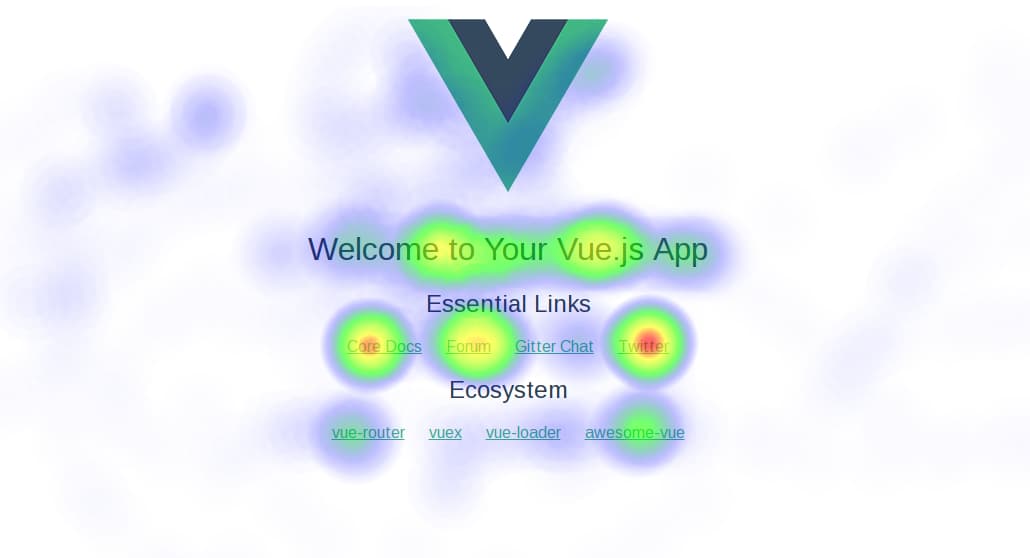
This will render a visual heatmap for all your interactions with the page as seen above. In most cases you won’t want this though. Thankfully you can disable it with v-heatmap="false" and still receive all the events.
<template>
  <div id="app" v-heatmap="false">
    ...
  </div>
</template>
Now you no longer have a good excuse when marketing tells you they want heatmaps. Sorry. Have fun finding a better one.
Thanks for learning with the DigitalOcean Community. Check out our offerings for compute, storage, networking, and managed databases.
About the author
Still looking for an answer?
This textbox defaults to using Markdown to format your answer.
You can type !ref in this text area to quickly search our full set of tutorials, documentation & marketplace offerings and insert the link!
 This work is licensed under a Creative Commons Attribution-NonCommercial- ShareAlike 4.0 International License.
Become a contributor for community
Get paid to write technical tutorials and select a tech-focused charity to receive a matching donation.

DigitalOcean Documentation
Full documentation for every DigitalOcean product.

Resources for startups and AI-native businesses
The Wave has everything you need to know about building a business, from raising funding to marketing your product.
The developer cloud
Scale up as you grow — whether you're running one virtual machine or ten thousand.

Start building today
From GPU-powered inference and Kubernetes to managed databases and storage, get everything you need to build, scale, and deploy intelligent applications.
