By Chris Engelsma

Introduction
Leaflet is a JavaScript library for creating maps. It comes packed with nice features and is extremely mobile-friendly.
Note: This is Part 1 of a 4-part series on using Angular and Leaflet.
You can use this library to display a map that supports zooming in and out and panning with click and drag.
In this tutorial, you will learn how to integrate Leaflet into an Angular app.
Prerequisites
To complete this tutorial, you will need:
- Node.js installed locally, which you can do by following How to Install Node.js and Create a Local Development Environment.
- Some familiarity with setting up an Angular project and using Angular components may be beneficial.
This tutorial was verified with Node v15.12.0, npm v7.7.4, angular v11.2.7, and leaflet v1.7.1.
Step 1 — Setting Up the Project
You can use @angular/cli to create a new Angular Project.
In your terminal window, use the following command:
- npx @angular/cli new angular-leaflet-example --style=css --routing=false --skip-tests
This will configure a new Angular project with styles set to “CSS” (as opposed to “Sass”, Less", or “Stylus”), no routing, and skipping tests.
Navigate to the newly created project directory:
- cd angular-leaflet-example
From your project folder, run the following command to install leaflet:
- npm install leaflet@1.7.1
With this scaffolding set in place, you can begin work on the map component.
Step 2 — Creating the Map Component
Now, you can create the custom map component:
- npx @angular/cli generate component map --skip-tests
This command will produce four new files: map.component.css, map.component.html, and map.component.ts. It will also update the app.module.ts file to use this new component.
Next, open map.component.ts and replace the content with the following lines of code:
<div class="map-container">
  <div class="map-frame">
    <div id="map"></div>
  </div>
</div>
Then, open map.component.css and replace the content with the following lines of code:
.map-container {
  position: absolute;
  top: 0;
  left: 0;
  right: 0;
  bottom: 0;
  margin: 30px;
}

.map-frame {
  border: 2px solid black;
  height: 100%;
}

#map {
  height: 100%;
}
This combination of markup and styles will create an outermost div with the class of .map-container that will position the map to occupy the available space on the screen.
It will also create a div with the id of #map. Using an id instead of a class here is important because Leaflet will expect an id to be passed to it for placing the map.
Next, open up map.component.ts and import the Leaflet package:
import { Component, OnInit } from '@angular/core';
import * as L from 'leaflet';

@Component({
  selector: 'app-map',
  templateUrl: './map.component.html',
  styleUrls: ['./map.component.css']
})
export class MapComponent implements OnInit {
  constructor() { }

  ngOnInit(): void { }
}
The map div will need to exist in the DOM before you can reference it to create your map. This is possible during the AfterViewInit lifecycle hook. Extend your component to implement AfterViewInit and add the ngAfterViewInit() function to your component:
import { Component, AfterViewInit } from '@angular/core';
import * as L from 'leaflet';

@Component({
  selector: 'app-map',
  templateUrl: './map.component.html',
  styleUrls: ['./map.component.css']
})
export class MapComponent implements AfterViewInit {
  constructor() { }

  ngAfterViewInit(): void { }
}
Let’s create a separate private function called initMap() to isolate all the map initialization.
In this function, you will need to create a new Leaflet map object. The API allows you to define options in it as well.
For this tutorial, you will set the center of the map and starting zoom value.
The center will be the geographic center of the contiguous United States located at 39.828175°N 98.579500°W.
The decimal coordinate system Leaflet uses assumes that anything to the west of the prime meridian will be a negative number, so the actual center coordinates will be [ 39.8282, -98.5795 ].
And the zoom level will be set to 3.
Declare a variable for the map object, create the map, and call it from ngAfterViewinit:
import { Component, AfterViewInit } from '@angular/core';
import * as L from 'leaflet';

@Component({
  selector: 'app-map',
  templateUrl: './map.component.html',
  styleUrls: ['./map.component.css']
})
export class MapComponent implements AfterViewInit {
  private map;

  private initMap(): void {
    this.map = L.map('map', {
      center: [ 39.8282, -98.5795 ],
      zoom: 3
    });
  }

  constructor() { }

  ngAfterViewInit(): void {
    this.initMap();
  }
}
Next, open up app.component.html, and replace the generated content with the new component:
<app-map></app-map>
And run the application:
- npm start
Then, open the application in your web browser (localhost:4200):
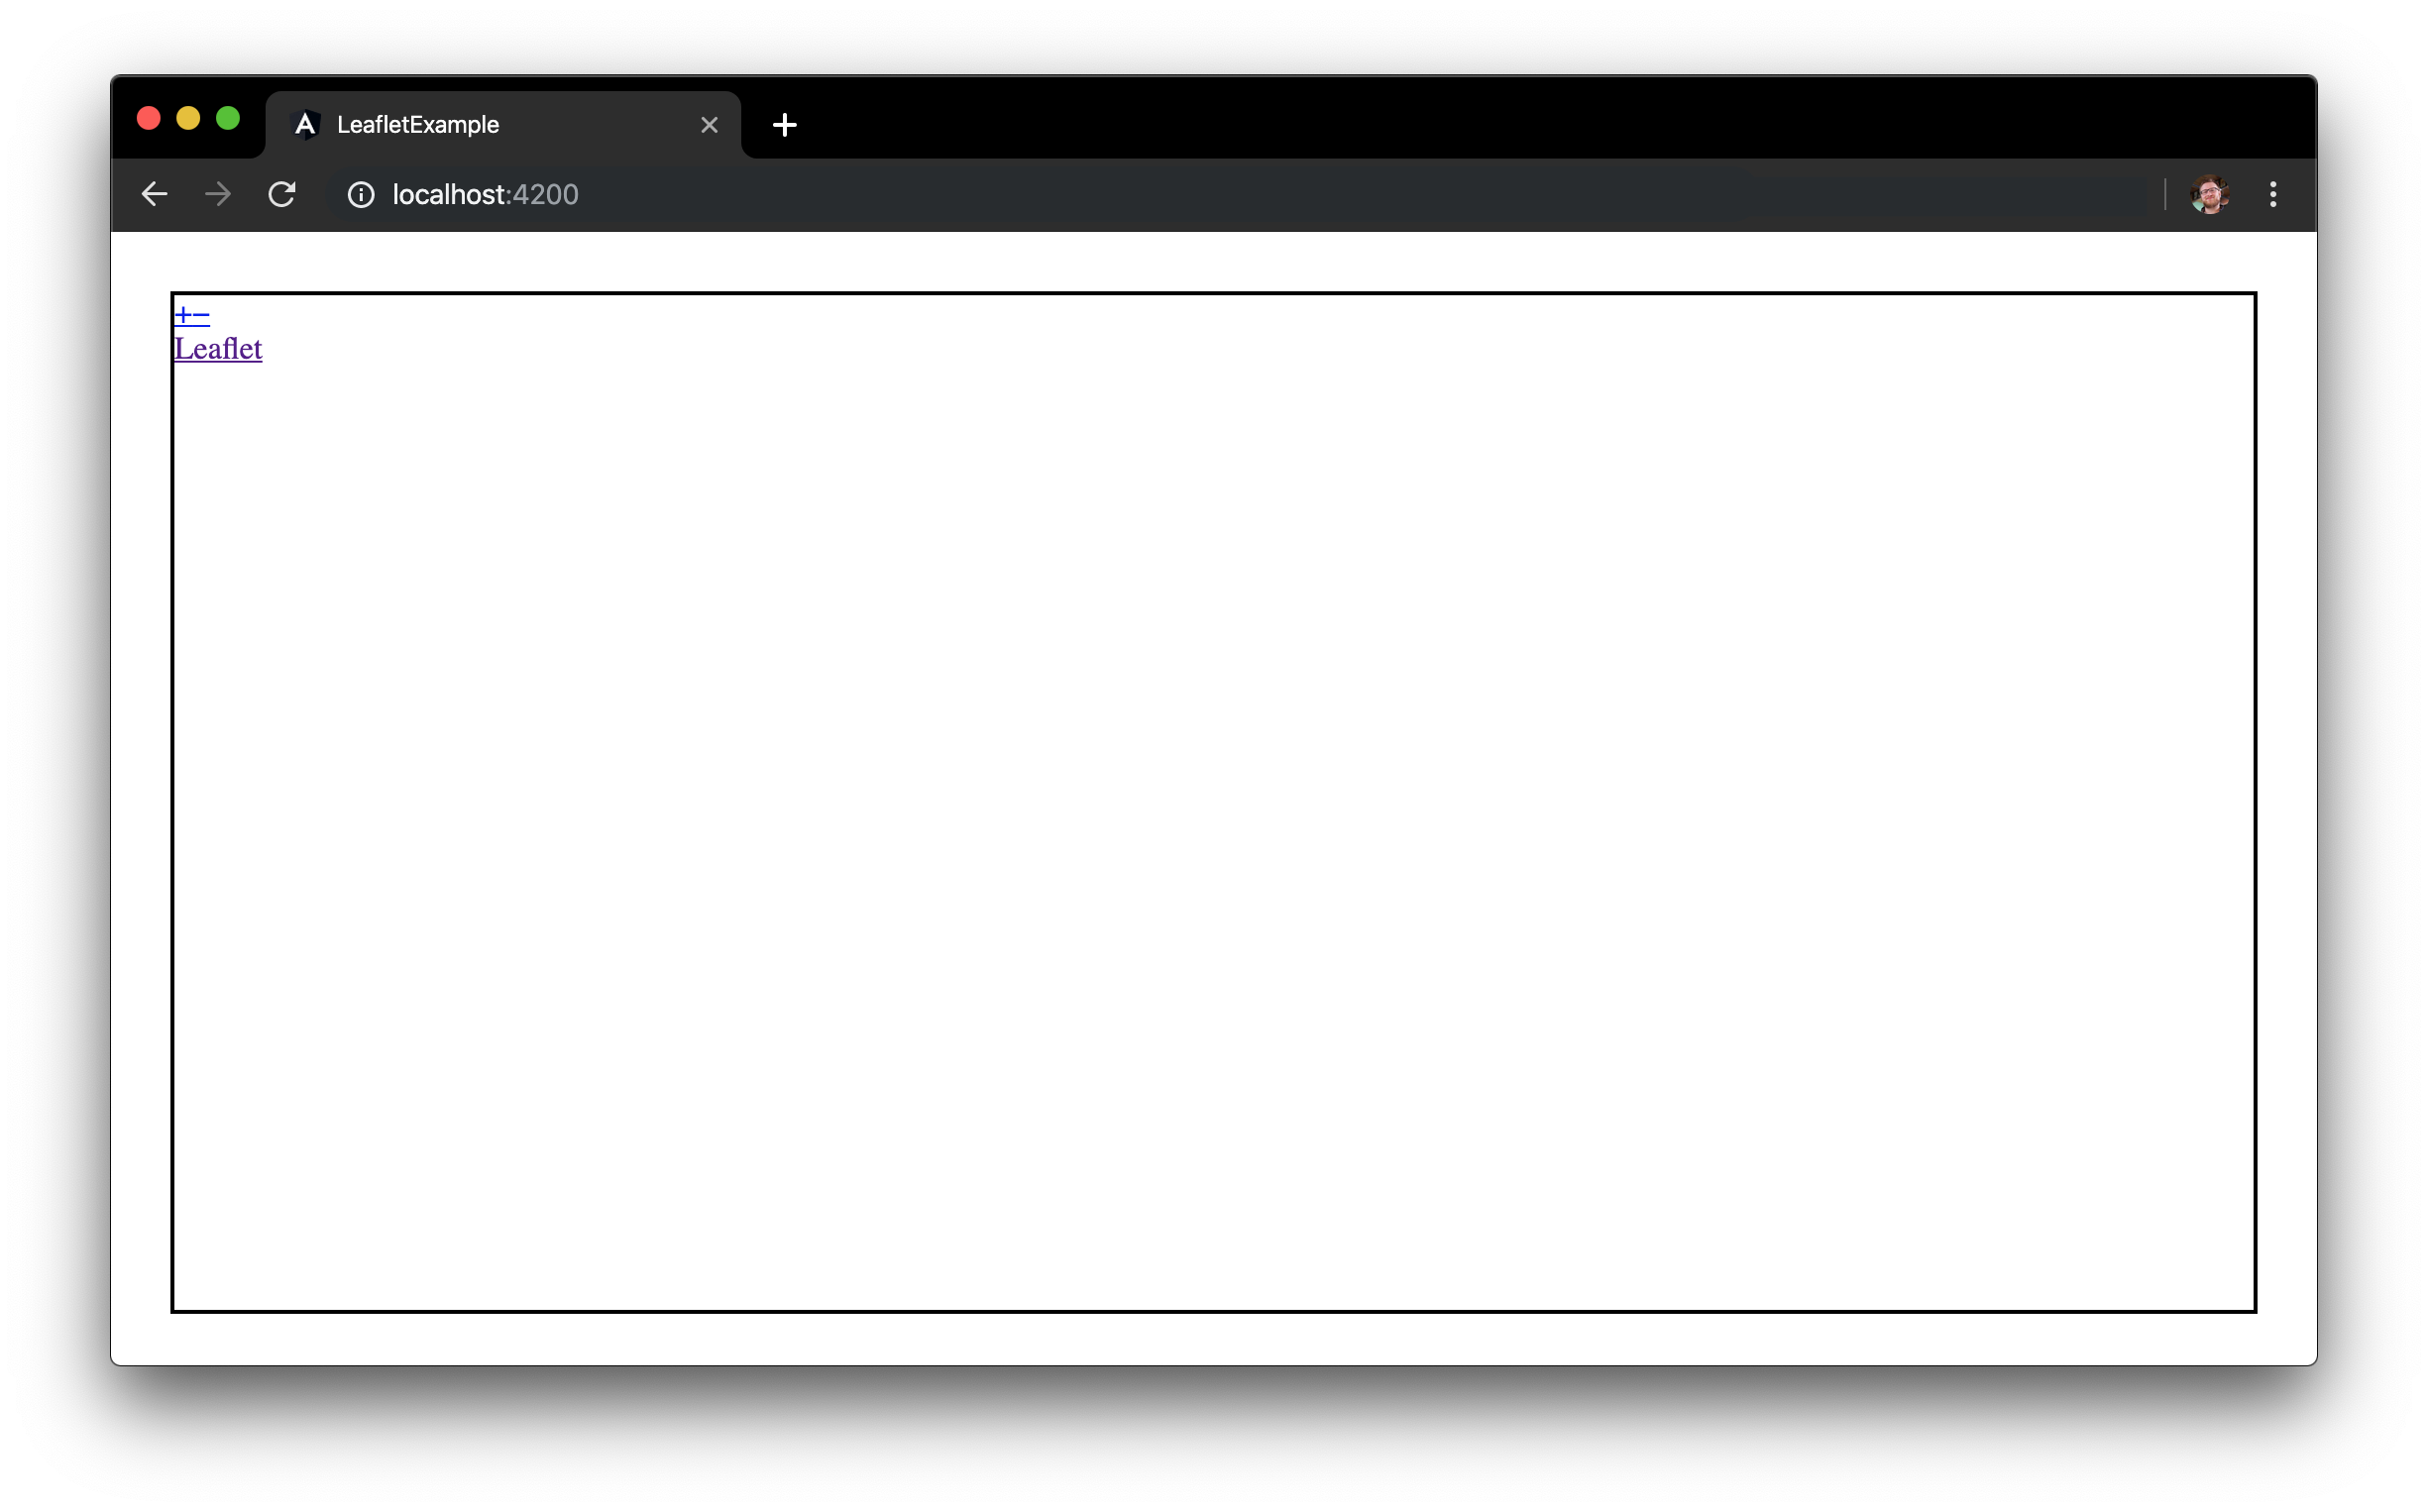
Your application will display an empty div and missing a map.
With Leaflet, you visualize data as Layers. The kind of data you think of when you picture a map is called “tiles”. You will need to create a new tile layer and add it to the map.
To create a new tile layer, you must first pass a tile server URL.
There are many tile server providers out there, but this tutorial will utilize the OpenStreetMap tile server.
Similar to the map object, the tiles layer also accepts customizable options.
For this tutorial, you will set the maximum and minimum zoom levels. You will also provide attribution information for the map data.
Revisit the map.component.ts file and add the tile layer to the map:
import { Component, AfterViewInit } from '@angular/core';
import * as L from 'leaflet';
@Component({
selector: 'app-map',
templateUrl: './map.component.html',
styleUrls: ['./map.component.css']
})
export class MapComponent implements AfterViewInit {
private map;
private initMap(): void {
this.map = L.map('map', {
center: [ 39.8282, -98.5795 ],
zoom: 3
});
const tiles = L.tileLayer('https://{s}.tile.openstreetmap.org/{z}/{x}/{y}.png', {
maxZoom: 18,
minZoom: 3,
attribution: '© <a href="http://www.openstreetmap.org/copyright">OpenStreetMap</a>'
});
tiles.addTo(this.map);
}
constructor() { }
ngAfterViewInit(): void {
this.initMap();
}
}
This code will set the maximum zoom to 18, the minimum zoom to 3, and the attribution text for the tiles.
Then, open the application in your web browser (localhost:4200):
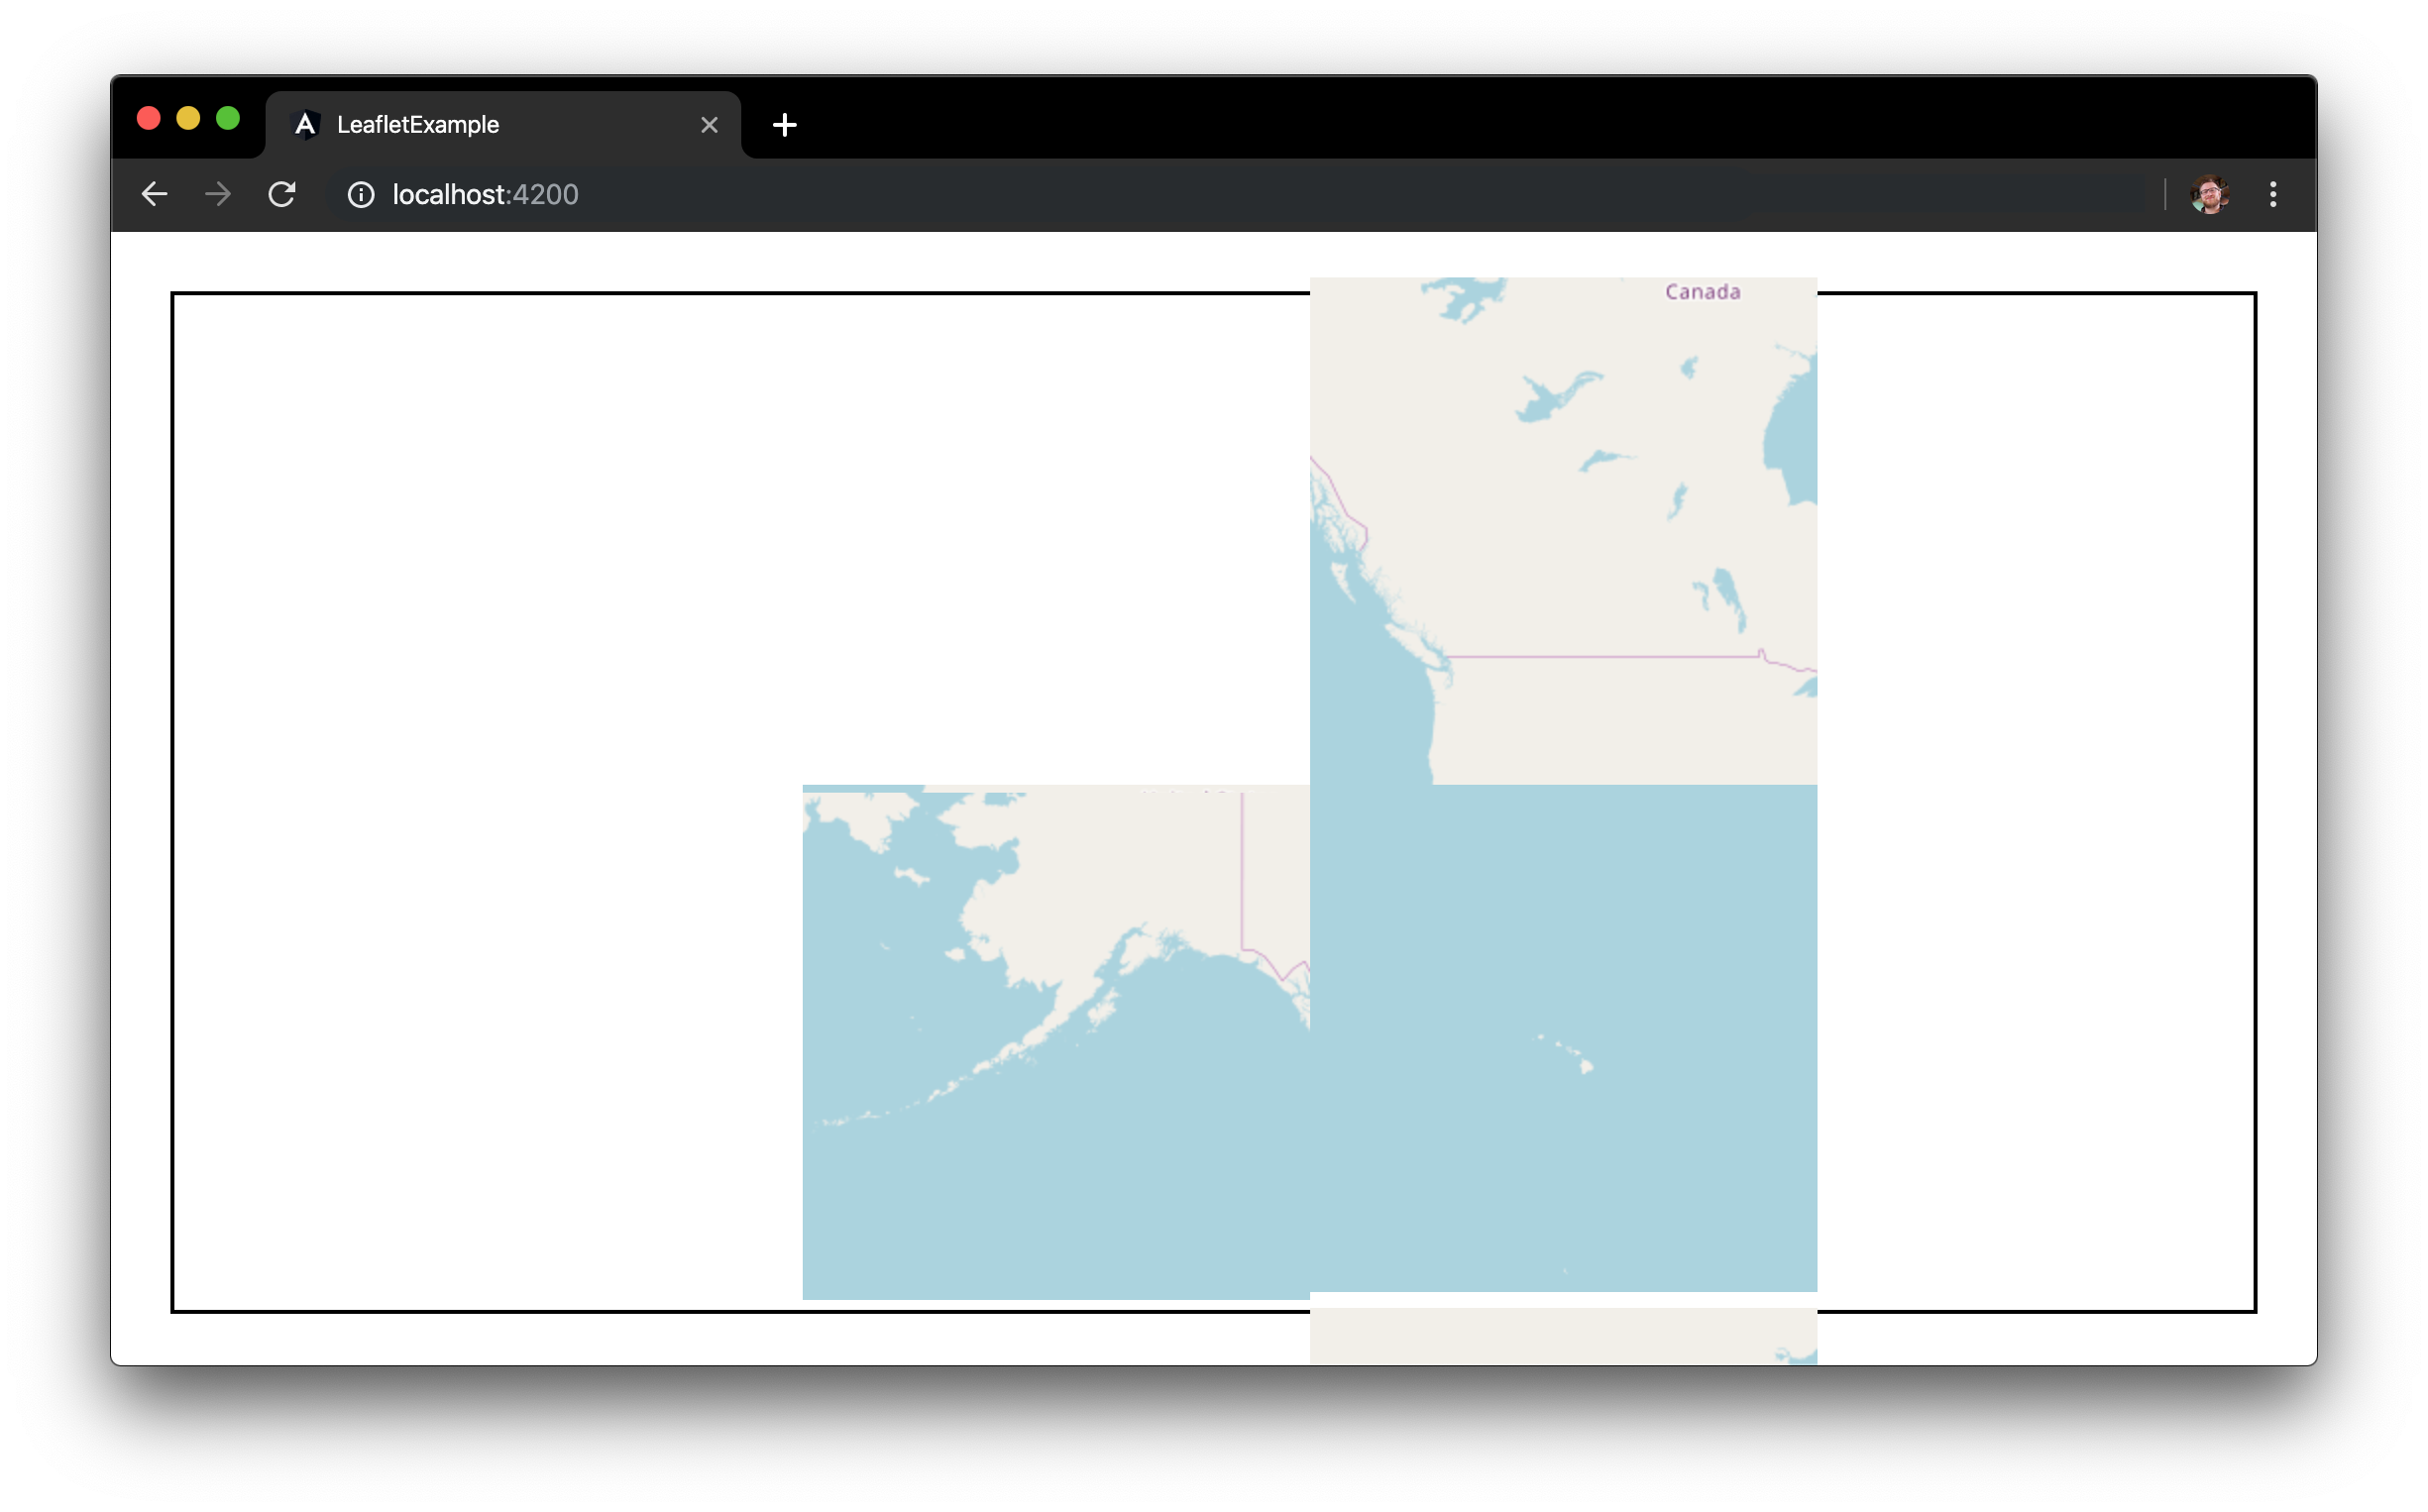
The tiles are loading, but do not appear to be placed correctly. You will need to include the Leaflet stylesheet in the build.
Open the angular.json file and add leaflet.css:
{
  // ...
  "projects": {
    "angular-leaflet-example": {
      // ...
      "architect": {
        "build": {
          // ...
          "options": {
            // ...
            "styles": [
              "./node_modules/leaflet/dist/leaflet.css",
              "src/styles.css"
            ],
            // ..
          },
          // ...
        },
        // ...
      }
    }},
  "defaultProject": "angular-leaflet-example"
}
If you are currently running npm start you will need to stop the process and restart so it refreshes the base stylesheet.
Finally, open the application in your web browser (localhost:4200):
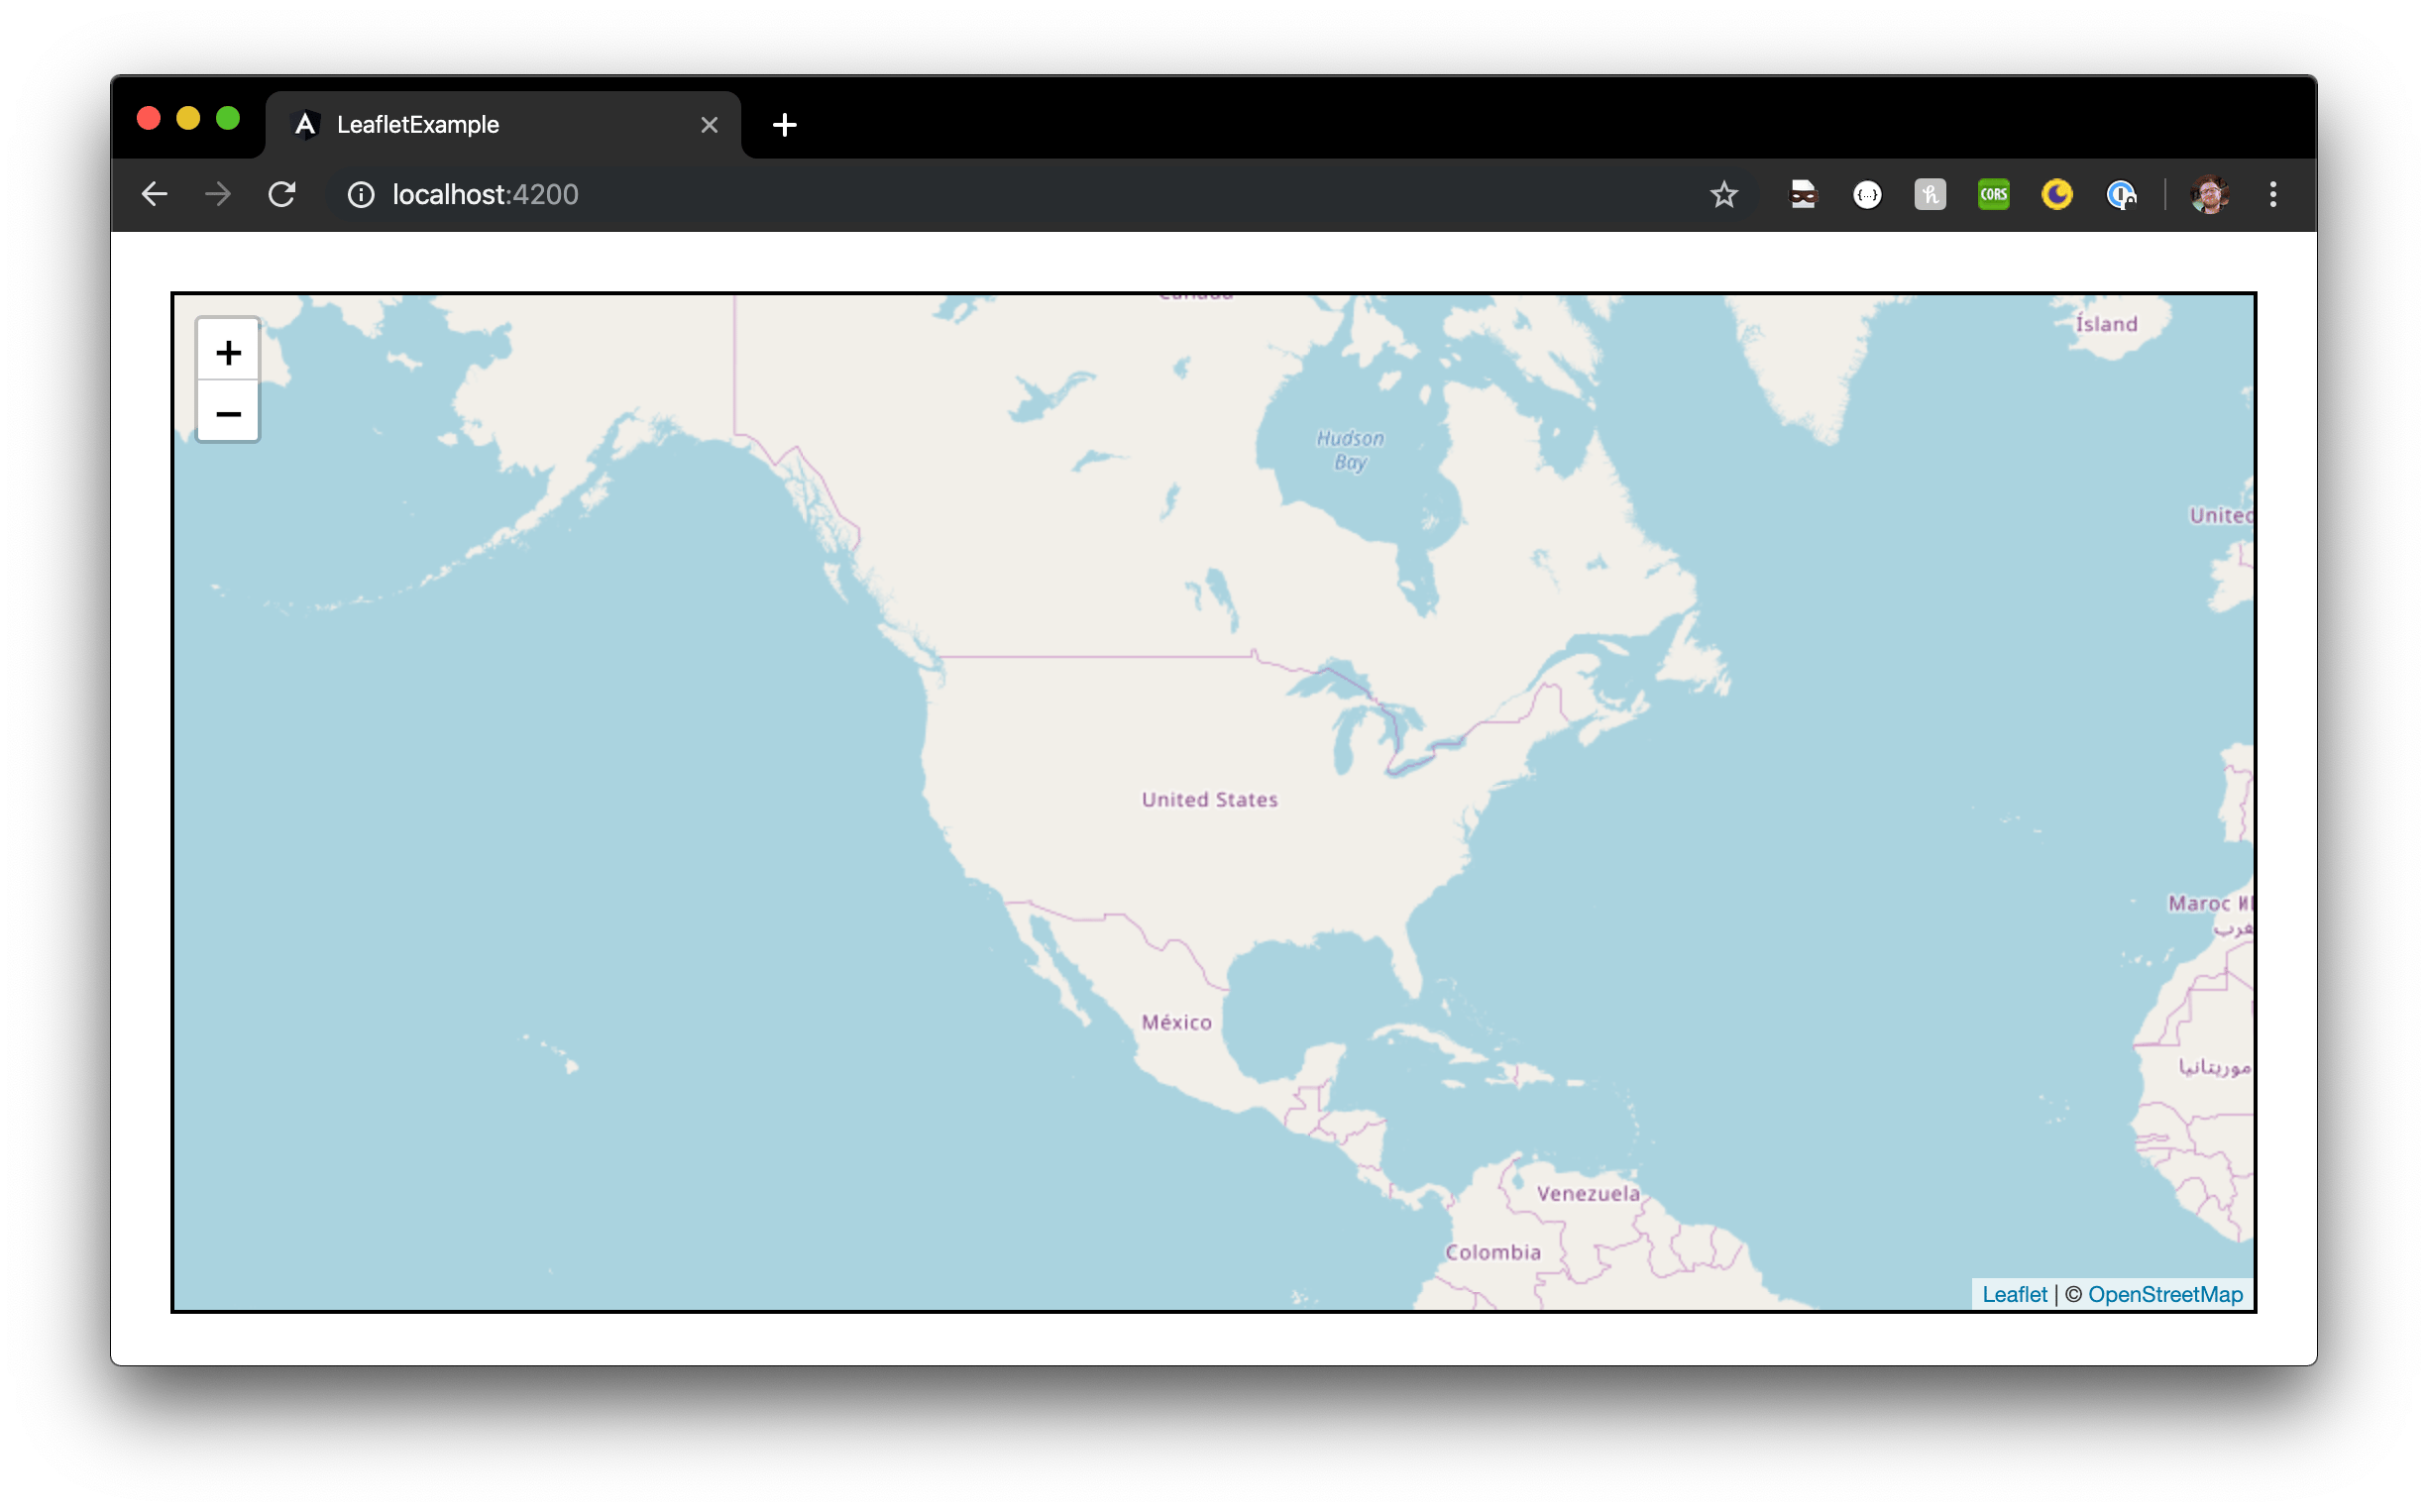
You now have a map that supports zooming and dragging.
Conclusion
In this tutorial, you learned how to use Leaflet in your Angular application.
For inspiration on advanced usages of Leaflet, consider looking at the examples on the official site.
Continue to Part 2 of this series on using Angular and Leaflet.
Thanks for learning with the DigitalOcean Community. Check out our offerings for compute, storage, networking, and managed databases.
About the author
Still looking for an answer?
This textbox defaults to using Markdown to format your answer.
You can type !ref in this text area to quickly search our full set of tutorials, documentation & marketplace offerings and insert the link!
Chris, this is a wonderful series and I thank you for doing it. My interest is Coordinate Reference System transforms from a long forgotten system and displaying them on a modern map. I have been using Open Layers and it is wonderful. However, sophisticated Open Layers and Angular combinations are complex. Your Angular and LeafletJS works out of the box from the simple marker to the choropleth example. Well done!
Please, add these minor tweaks:
-
Users want to follow on step-by-step, so please make your geoJSON file with population property available, even if via Github link. I downloaded a world geonames file and had to adapt its structure to your tutorial.
-
Your marker logic works but you mix Leaflet’s system (lat precedes lon) with geoJSON (lon precedes lat). It works because your code says lat = c.geometry.coordinates[0] but you actually pass this value into Leaflet’s lon variable. Indianapolis is not at 86 degrees south!
-
There is a missing back-tick in tutorial 3 at the end of this line: `<div>State: ${ data.state }</div> +
These are minor and do not detract from a great series where everything worked on Angular 9 and Leaflet 1.6 first time.
I signup to just comment this lol, the above tutorial help me a lot , thanks it is such a simple and direct tutorial
I have an issue in map style, it look no effect when adding the style to angular.json
Thank you for this tutorial.
The issue with tiles loading but do not appearing to be placed correctly persisted for me even after editing angular.json, and the only way I found to fix it was to manually add these to index.html:
<link rel="stylesheet" href="https://unpkg.com/leaflet@1.9.4/dist/leaflet.css"
  integrity="sha256-p4NxAoJBhIIN+hmNHrzRCf9tD/miZyoHS5obTRR9BMY="
  crossorigin=""/>

<script src="https://unpkg.com/leaflet@1.9.4/dist/leaflet.js"
  integrity="sha256-20nQCchB9co0qIjJZRGuk2/Z9VM+kNiyxNV1lvTlZBo="
  crossorigin=""></script>
Just leaving this here in case anyone runs into the same problem.
 This work is licensed under a Creative Commons Attribution-NonCommercial- ShareAlike 4.0 International License.
Become a contributor for community
Get paid to write technical tutorials and select a tech-focused charity to receive a matching donation.

DigitalOcean Documentation
Full documentation for every DigitalOcean product.

Resources for startups and AI-native businesses
The Wave has everything you need to know about building a business, from raising funding to marketing your product.
The developer cloud
Scale up as you grow — whether you're running one virtual machine or ten thousand.

Start building today
From GPU-powered inference and Kubernetes to managed databases and storage, get everything you need to build, scale, and deploy intelligent applications.
