By Chidera Chukwuka and Caitlin Postal

The author selected the Mozilla Foundation to receive a donation as part of the Write for DOnations program.
Introduction
Visualizing data provides an intuitive way for users to know what is happening in the system of their web applications. ApexCharts is one package that you can use to create charts with SolidJS.
SolidJS is a JavaScript library for building user interfaces. Since SolidJS is based on the same design as JavaScript libraries like React and Svelte, developers with experience in these libraries can adapt quickly to SolidJS. SolidJS immediately compiles its templates to the DOM, updating the DOM internally using reactive programming instead of a virtual DOM. Components in SolidJS are regular JavaScript functions, so they are rendered only once. SolidJS offers contemporary framework features that include parallel rendering, JSX, fragments, context, portals, suspense, streaming SSR, and progressive hydration. Vite is the primary building tool, packing your application in JavaScript so that it is compact.
ApexCharts is an open-source, customizable JavaScript chart library for creating interactive visualizations for web apps. You can integrate ApexCharts with many popular JavaScript frameworks, including SolidJS. ApexCharts has a wide range of flexible and responsive charts that can render across multiple screens.
In this tutorial, you will integrate ApexCharts into a SolidJS application for data visualization. You will develop an application that pulls weather data from the OpenWeatherMap API and displays it in a bar chart.
Prerequisites
To follow this tutorial, you will need the following:
- Node.js installed on your machine, which you can set up by following the tutorial on How To Install Node.js.
- A web browser like Firefox or Chrome.
- (Optional) Basic knowledge of the SolidJS Library. You can review the SolidJS documentation.
- (Optional) A text editor that supports JavaScript syntax highlighting, such as Visual Studio Code or Atom. This tutorial uses the command-line editor
nano.
Step 1 — Creating the SolidJS Project
In this step, you will create a SolidJS project and install all necessary dependencies to create charts. You will create a SolidJS app with a Vite Template containing the required boilerplate code.
In a new terminal session, create and move to a new directory that you will use for this tutorial:
- mkdir charts
- cd charts
For this tutorial, the directory will be named charts, but you can call it whatever you wish.
Then, run the npx degit command to clone the template from the repository solid/js/templates/js to your project folder:
- npx degit solidjs/templates/js solid-chart
You can replace solid-chart with the desired name of your application.
Note: TypeScript is a superset of JavaScript that offers optional static typing, classes, and interfaces. It also offers enhanced code completion and IntelliSense for JSX. If you prefer using TypeScript, run these commands:
- npx degit solidjs/templates/ts solid-chart
You’ll receive the same output for the /ts template as for the /js template.
You’ll receive the following output:
Output> cloned solidjs/templates#HEAD to solid-chart
This output confirms that the template has been saved to your machine. Once you have cloned the template to your project folder, you can move into the template folder and install the necessary dependencies for the project:
- cd solid-chart
- npm install
NPM will install the necessary dependencies for the project.
You will need two more dependencies to integrate charts in SolidJS: ApexCharts and Solid-ApexCharts.
ApexCharts is a JavaScript chart library for creating interactive visualizations for web apps. ApexCharts supports fourteen charts, including bar, line, area, pie, column, box, candlestick, heatmap, and more.
Solid-ApexCharts is a SolidJS wrapper for ApexCharts, enabling you to use ApexCharts elements as SolidJS components.
Run this command to install these dependencies:
- npm install apexcharts solid-apexcharts
Then, start the development server with this command:
- npm run dev
You’ll receive an output similar to this:
Output...
  vite v2.9.15 dev server running at:

  > Local: http://localhost:3000/
  > Network: use `--host` to expose

  ready in 605ms.
Your app will now be running on port 3000. Open a browser and enter the URL http://localhost:3000/ to access the SolidJS startup page:
Note: If you are following the tutorial on a remote server, you can use port forwarding to test the app in the browser.
While the development server is still running, open another terminal on your local computer and enter the following command:
- ssh -L 3000:localhost:3000 your_non_root_user@your_server_ip
Upon connecting to the server, navigate to http://localhost:3000 on your local machine’s web browser. Keep the second terminal open throughout the remainder of this tutorial.
Once you have installed all the dependencies, you can fetch data from the API.
Step 2 — Retrieving Data from the API
In this step, you will use the Fetch API to retrieve data from OpenWeatherMap. You will use the latitudes of a particular location and show the variations in a chart.
In your preferred editor, open the App.jsx file in the src folder. This tutorial uses the command-line editor nano:
- nano src/App.jsx
Note: If you used the TypeScript template in Step 1, you will not use .jsx files. Instead, open .tsx files for any .jsx file throughout the tutorial.
Here, you will retrieve the data from the API and give it to a different component so it can render the chart.
First, delete all the information that was automatically generated in the template file.
Next, import createEffect from solid-js by adding this line:
import { createEffect } from "solid-js";
You will now create the effect where the function calls the API. Add these lines to the file:
...

createEffect(() => {
  const fetchData = async () => {
    const res = await fetch("http://api.openweathermap.org/geo/1.0/direct?q=London&limit=5&appid=YOUR_API_KEY_HERE");
    const data = await res.json();
  };

  fetchData()
});
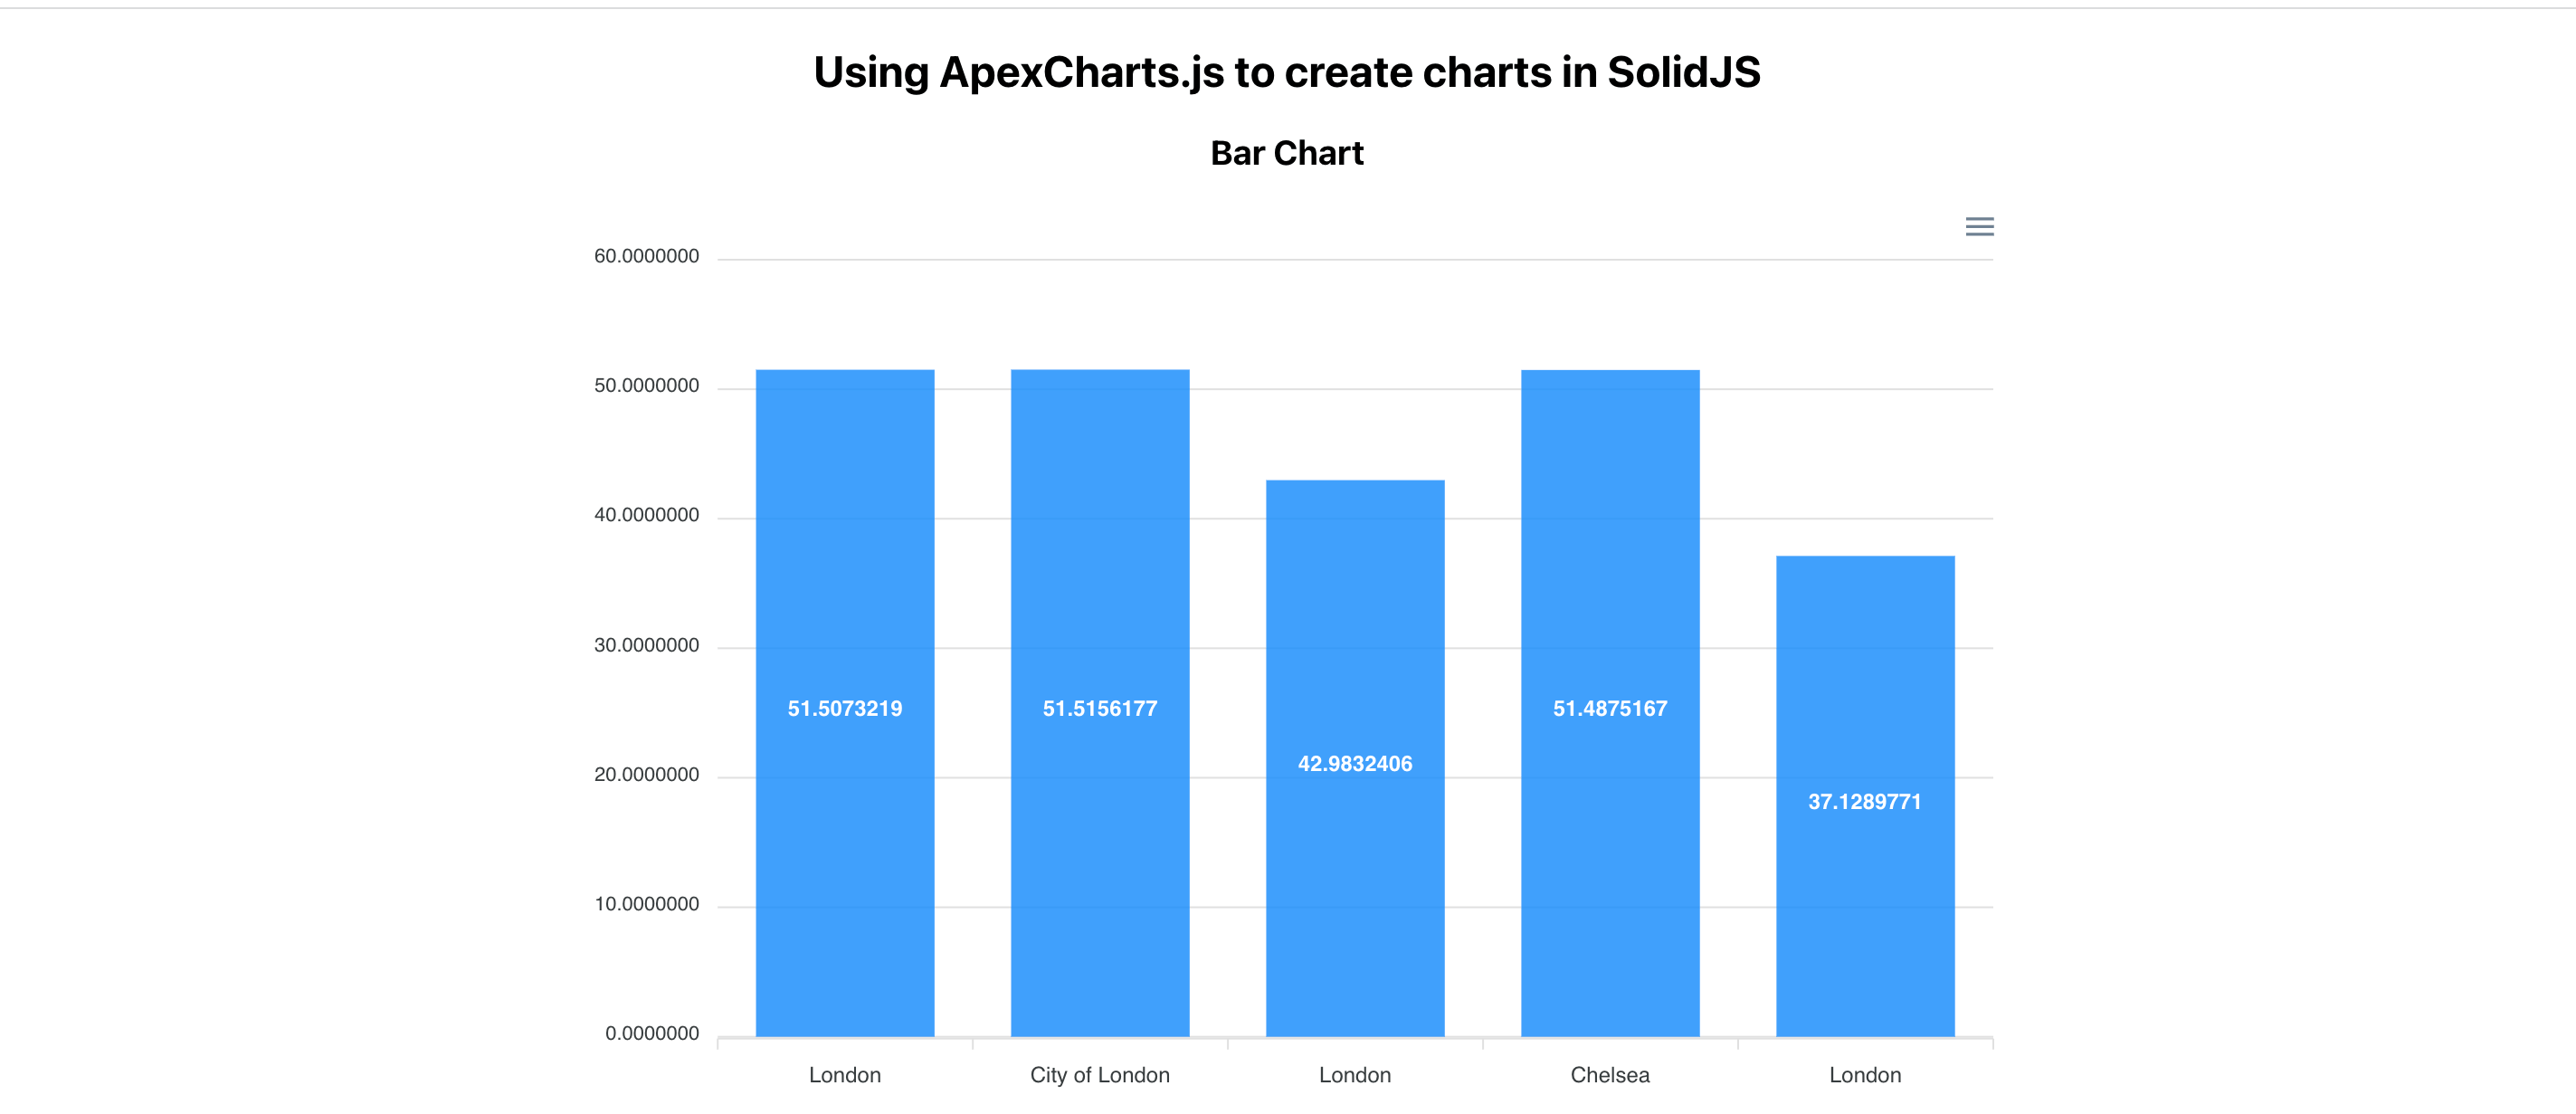
An async function called fetchData queries the OpenWeatherMap API using the Fetch API. This function runs as soon as the App component is mounted because fetchData gets called in a createEffect. The OpenWeatherMap API typically returns an array of weather objects. Here, a limit of 5 is in use. From the data, the name and the lat are the only entities to be used (in the API call, the query is London, and the API key is the string identified by appid=).
Because the fetchData is an async function, you need to await the response. The response is stored in the res variable when available. Once the server receives the data, the response is converted to JSON using the function .json() and stored in the data variable.
After retrieving data, the next task is to store it in a signal and export it. Having retrieved the data from the API, you can create the chart data signal and initialize it with an empty object. Then update its value with the data from the API.
Still in src/App.jsx, import createSignal from solid-js. To do that, update the initial import by adding the highlighted text:
import { createSignal,  createEffect } from "solid-js";
...
Then, create a Signal variable for the chart data just after the import statement by adding the highlighted text:
import { createSignal, createEffect } from 'solid-js';

const [chartData, setChartData] = createSignal({});
...
In Solid, Signals are the basis for reactivity. They include dynamic values, so if you modify the value of a Signal, everything that relies on it gets updated automatically.
The initial value is the parameter given to create the Signal, and an array with two functions (a getter and a setter) are return values. The first returned value is not the value itself but a getter, a function returning the present value. To update appropriately, the library needs to track where that signal gets read. For this tutorial, chartData is the getter, while setChartData is the setter. The Signal is initialized with an empty object.
ApexCharts requires you to specify options. In this tutorial, you will specify the series option with a data array and the xaxis option that adds the data and categories arrays.
To do this, you’ll build the array of values returned from the API using the map() method. The map() method calls a function for each array element, returning the results in a new array. Add the highlighted lines within the fetchData async function:
...
createEffect(() => {
  const fetchData = async () => {
    const res = await fetch("http://api.openweathermap.org/geo/1.0/direct?q=London&limit=5&appid=YOUR_API_KEY_HERE");
    const data = await res.json();

    setChartData({
      series: [
        {
          name: 'Latitudes in London',
          data: data.map((d) => (d.lat))
        }
      ],
      xaxis: {
        categories: data.map((d) => (d.name))
      }
    });
  };

  fetchData()
});
Inside the setter function setChartData, you specify values for the series and xaxis of the Apexcharts.
In the series array, you specify a value for the name and data properties. You iterate over the data returned from the server using the map() and pass the values of latitudes represented by lat. These will be the values in each chart.
The xaxis object expects the categories property, which is set by iterating over the data using the map() method and passing the values of name. This value represents the name of the city on each chart.
Once you have updated chartData with chart parameters and data from the API, you need to provide styling and export it. Add the highlighted lines to the file:
import { createSignal, createEffect } from "solid-js";
import styles from './App.module.css';

const [chartData, setChartData] = createSignal({});

createEffect(() => {
  const fetchData = async () => {
    const res = await fetch("http://api.openweathermap.org/geo/1.0/direct?q=London&limit=5&appid=YOUR_API_KEY_HERE")
    const data = await res.json();

    setChartData({
      series: [
        {
          name: 'Latitudes in London',
          data: data.map((d) => (d.lat))
        }
      ],
      xaxis: {
        categories: data.map((d) => (d.name))
      }
    });

  }

  fetchData()
});

function App() {

  return (
    <^>
        <div class={styles.App}>
          <h2>Using ApexCharts.js to create charts in SolidJS</h2>
          <h3>Bar Chart</h3>
        </div>
    <^>
  );
}

export { chartData }

export default App;
First, you import styles for use in the return section.
Then, you define the return for the function App(), which will create the headings for the chart when you run the application. It calls on the styles to create two headers.
Signals from SolidJS can be exported and used by any other component, so you also export chartData near the end of the file.
Save and close the file.
Since the signal is exported, you can now create a chart component to consume and display it.
Step 3 — Creating a Chart with Data from the API
At this stage, you will create a chart component and consume the data from the API to display the chart.
In the src folder, create a components folder:
- mkdir src/components
Then add a new Charts.jsx file:
- nano src/components/Charts.jsx
In the new Charts.jsx file, import SolidApexCharts and chartData:
import { SolidApexCharts } from 'solid-apexcharts';
import { chartData } from '../App';
Now add the following lines to create a Charts function:
function Charts() {

  return (
    <SolidApexCharts width="1200" type="bar" options={chartData()}  />
  );
};

export default Charts;
The Charts function will use the information from the chartData variable set previously to create a bar chart that is 1200 pixels wide. You pass chartData as the value of options and set the width and type of the chart in the SolidApexCharts component.
Save and close the file.
Open the src/App.jsx file:
- nano src/App.jsx
Now import the Charts component into the App.jsx file:
import { createSignal, createEffect } from "solid-js";
import styles from './App.module.css';
import Charts from './components/Charts';

const [chartData, setChartData] = createSignal({});

function App() {

  return (
    <div class={styles.App}>
      <h2>Using ApexCharts.js to create charts in SolidJS</h2>
      <h3>Bar Chart</h3>
      <Charts />
    </div>
  );
};

export { chartData }

export default App;
First, you import Charts. Then, you add the <Charts /> component just below the h3 element to render when the application is run. This line will display the bar chart with the dynamic data.
Save and close the file.
When you refresh your application in the browser, the bar chart will render.
You can also review the files created in this tutorial in the DigitalOcean Community repository.
Conclusion
In this article, you built a SolidJS application that pulls data from an API to create charts. You used Apexcharts and Solid-ApexCharts for data visualization in a SolidJS application. You can now make other kinds of charts with dynamic data. Try adjusting the chart from a bar chart to another type of chart supported by ApexCharts.
To explore more about SolidJS and its features, visit the SolidJS documentation. To learn more about ApexCharts and other configurations available, check the ApexCharts documentation.
Thanks for learning with the DigitalOcean Community. Check out our offerings for compute, storage, networking, and managed databases.
About the author(s)
Still looking for an answer?
This textbox defaults to using Markdown to format your answer.
You can type !ref in this text area to quickly search our full set of tutorials, documentation & marketplace offerings and insert the link!
 This work is licensed under a Creative Commons Attribution-NonCommercial- ShareAlike 4.0 International License.
Become a contributor for community
Get paid to write technical tutorials and select a tech-focused charity to receive a matching donation.

DigitalOcean Documentation
Full documentation for every DigitalOcean product.

Resources for startups and AI-native businesses
The Wave has everything you need to know about building a business, from raising funding to marketing your product.
The developer cloud
Scale up as you grow — whether you're running one virtual machine or ten thousand.

Start building today
From GPU-powered inference and Kubernetes to managed databases and storage, get everything you need to build, scale, and deploy intelligent applications.
