By Elliot Cooper and Dave Rankin

Introduction
Siege is a configurable benchmarking and testing tool for websites that tests web servers by making requests for web pages. The number of pages per second that Siege requests can be set to anything from a few pages per second to the maximum number that the website can handle.
This information is extremely useful for discovering performance bottlenecks by highlighting which server resource is exhausted first and at which traffic level. Armed with this information, you can make changes to the server’s configuration or upgrade the server’s hardware before a live site fails. In addition, common system administration procedures, such as backups, can be tested under a simulated load to determine their effect on website performance.
In this guide, we will install and configure Siege to run in benchmarking and browsing modes. The benchmarking mode makes as many requests as the web server can handle, and the browsing mode simulates a configurable number of visitors to the website.
Because configuring an Internet connection that runs through a proxy server is particularly simple with Firefox, we will use it to connect to the Internet via the Sproxy proxy server. Sproxy, which was specifically created to work with Siege, records the URL of every request that passes through it to a file. We will use that file to to tell Siege which URLs to test against.
In the first part of this tutorial, we will install Sproxy and configure Firefox to connect to the Internet through it. From there, we will generate a list of URLs to have Siege test against, and, finally, we will examine the test results and identify performance bottlenecks.
Warning: Only use Siege to test websites that you either own or have permission to test. Using Siege against unauthorized websites may be considered a crime in some countries.
Prerequisites
In order to complete this tutorial, you will need:
- One Ubuntu 16.04 server set up by following this Ubuntu 16.04 initial server setup tutorial, including a sudo non-root user and a firewall. Be sure to open port
8080in Step 7 of the initial server setup tutorial with the commandsudo ufw allow 8080. This is the port that Sproxy listens on by default. - Firefox installed. If you are using macOS or Windows on your local computer, you should download the installation file from the official Mozilla website. If you are using Linux, you should use your package manager or follow Mozilla’s official instructions to install Firefox. This tutorial includes instructions for working with Firefox version 56.
- A website you own or have permission to test that is either publicly available or that you can make accessible from the server you install Siege on.
Step 1 — Building and Installing Sproxy
Sproxy is not available as a pre-packaged binary, so you will have to download it from its official website and then build it from source.
Because Sproxy’s build process relies on tools that are not installed on Ubuntu by default, you will need to install some additional packages.
First, update your package list to make sure you get the latest version of each additional package.
- sudo apt-get update
Then, install the packages.
- sudo apt-get install build-essential libnet-ssleay-perl liburi-perl libwww-perl
build-essential provides general libraries and tools that are required to build software on Debian-based Linux distributions, while libnet-ssleay-perl, liburi-perl, and libwww-perl are libraries for the Perl programming language that Sproxy depends on to make connections over SSL, manipulate URI strings, and interface with the World Wide Web.
Now, change to your home directory and download the Sproxy source code archive from its official website.
- cd ~
- curl -O http://download.joedog.org/sproxy/sproxy-latest.tar.gz
Then, create a directory named sproxy to build Sproxy in and unpack the source code archive into the new directory.
- mkdir sproxy
- tar -zxf sproxy-latest.tar.gz --strip-components=1 --directory="sproxy"
Here, the -zxf option tells tar to gunzip and extract the contents of the sproxy-latest.tar.gz file. The --strip-components=1 option strips the first leading component from each file name. This unpacks the archive into the sproxy directory — specified by the --directory option — rather than into sproxy-1.02/sproxy/.
Now, change to the sproxy directory to build and install Sproxy with the configure and make commands.
- cd sproxy
- ./configure
- make
- sudo make install
The ./configure command checks that all of the necessary program dependencies and build tools are present on the system. The make command then builds the program binaries. Finally, the make install command copies the new binaries to their correct locations on the server. Because Sproxy creates a new directory at /usr/local/lib/sproxy/JoeDog, you need to run make install with root privileges.
Finally, test that Sproxy is working correctly by going back into your home directory to start Sproxy in verbose mode with the -v option.
- cd ~
- sproxy -v
The output tells you the the port that Sproxy is listening on, the location of the file that Sproxy is writing output to, and the number of seconds Sproxy will wait for a reply from a remote host.
Sproxy OutputSPROXY v1.02 listening on port 9001
...appending HTTP requests to: /user/urls.txt
...default connection timeout: 120 seconds
If Sproxy fails to start, review the messages in your terminal for information about what went wrong.
Once you’ve verified that everything’s working, stop Sproxy with CTRL+C.
Sproxy is now ready to use, so let’s modify Firefox to connect to the Internet through Sproxy in order to make a list of URLs to benchmark with Siege.
Step 2 — Configuring Firefox to use Sproxy
We will now change Firefox’s networking configuration to send all web requests through the Sproxy, generating the list of benchmarking targets we will need for Siege.
Because we want Sproxy to record every URL we visit, we will also clear Firefox’s local web cache. The web cache is a local store of images and other static content from websites that Firefox has already visited. By default, Firefox does not re-request website assets that it has already cached.
Modifying the Network Settings
First, change the Network Proxy settings under the General tab on Firefox’s main Preferences screen.
- Open Firefox. (This tutorial includes instructions for Firefox version 56. For other versions, see Firefox’s official support documentation.)
- Click on the hamburger menu in the upper, right-hand corner of the screen and select Preferences to go to the General screen.
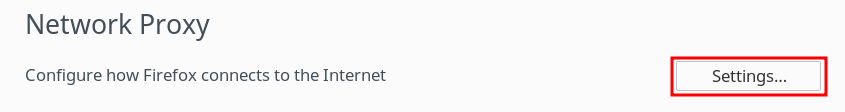
- Scroll to the bottom of the page and locate the Network Proxy section.
- Click on the Settings… button to open the Connection Settings panel.
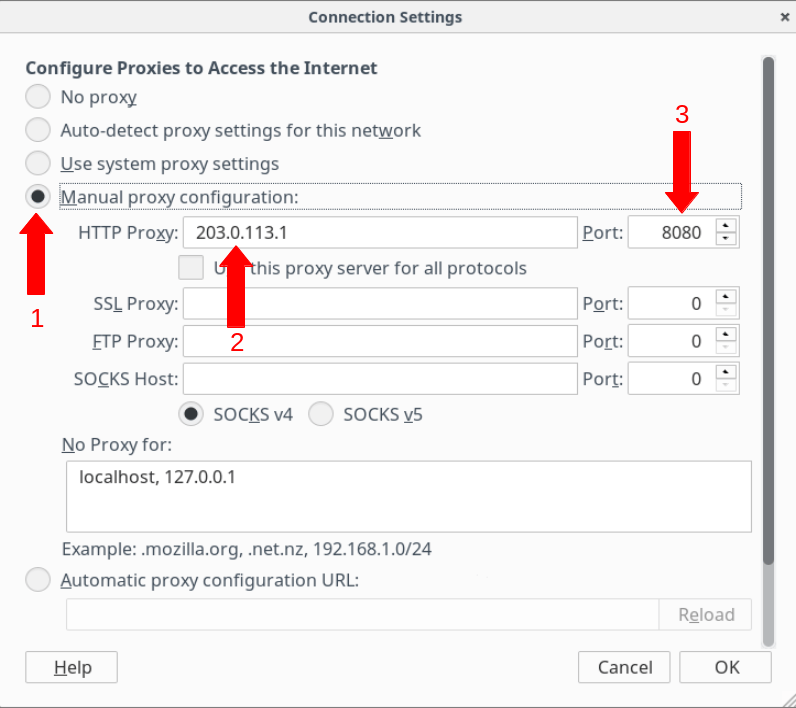
In this panel, configure Firefox to pass all of its requests through the Sproxy server you installed in Step 1.
- Select Manual proxy configuration.
- Enter your Sproxy server’s public IP address in the HTTP Proxy field.
- Set the port number to
8080in the Port field. - Click OK to save the changes.
You have now configured Firefox to use your Sproxy HTTP Proxy server, so you are ready to clear the local cache.
Clearing the Local Cache
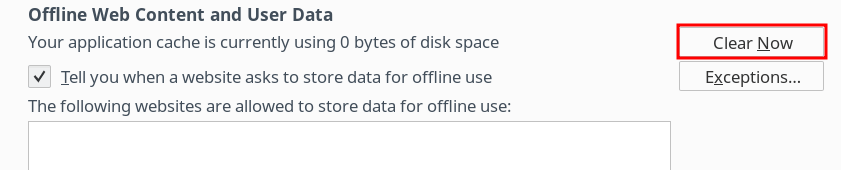
Firefox refers to the local cache as Offline web content. It is found in the Privacy and Security section of Firefox’s Preferences screen.
- Click on the hamburger menu in the upper, right-hand corner of the screen and select Preferences to go to the General screen.
- Click Privacy & Security on the left-hand side of the screen.
- Scroll to the bottom of the page and locate the Offline Web Content and User Data section and press the Clear Now button.
Your web cache is now empty, so the address of every HTTP-based website asset that Firefox encounters will be passed to Sproxy until that asset is re-cached.
Testing the Configuration
Firefox is now configured to route all HTTP-based requests through Sproxy, but you stopped Sproxy with CTRL+C at the end of Step 1. So, you will see an error page if you try to visit a website over an HTTP connection with Firefox right now.
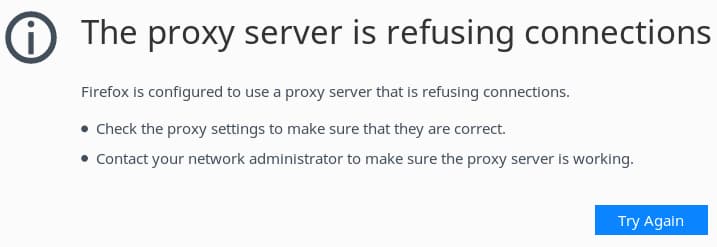
If you do not see this error message, verify that your Firefox settings match the previous screenshots and double-check that you are not connecting to the website over HTTPS.
When you want to use Firefox normally again, re-trace the previous instructions for Modifying the Network Settings, but, this time, select the No proxy option on the Connection Settings panel.
Now that we have configured Firefox to connect to the Internet via Sproxy, we can create a list of URLs by starting Sproxy and browsing the target website with Firefox.
Step 3 — Starting Sproxy and Generating a URL List
In this step, we will start the Sproxy server and use Firefox to browse the target website. Sproxy will record every HTTP-based URL that Firefox requests to a file that we will use later with Siege.
First, change to your home directory and start Sproxy.
- cd ~
- sproxy -v -t 180 -p 8080 -o mixed-urls.txt your_server_ip
-vprints the URLs being requested to the terminal.-tis the number of seconds that Sproxy will wait for a response from a remote host.-pis the port that Sproxy will listen on.-ois the file that Sproxy will write the URLs to.your_server_ipis the IP address that Sproxy will bind to.
The output immediately tells you the version of Sproxy you are running, the port that Sproxy is listening on, the file that Sproxy is writing URLs to, and the amount of time Sproxy will wait for a remote host to respond. Once you start browsing the test website, the output will also include the URLs of the webpages that Sproxy is recording.
Sproxy OutputSPROXY v1.02 listening on port 8080
...appending HTTP requests to: mixed-urls.txt
...default connection timeout: 180 seconds
http://www.example.com/
http://www.example.com/index.html
http://www.example.com/about.html
Note: Sproxy does not support HTTPS connections, so you must browse your test site via HTTP in order to generate the list of URLs. However, Siege does support HTTPS, and, in Step 5, we will explore modifying the HTTP-only URLs list to test your website over both HTTP and HTTPS.
After you have started Sproxy, return to Firefox and begin browsing the target site. Sproxy will write every URL that Firefox requests to the mixed-urls.txt file while simultaneously printing the URLs to the terminal.
Once you have visited all of the webpages you plan to test, stop Sproxy with CTRL+C.
You now have a list in the mixed-urls.txt file of every HTTP-based URL that Firefox encountered on the test website. The next step is to remove any URLs that do not resolve to your website to make sure that you only use Siege against authorized domains.
Step 4 — Sanitizing the URLs File
Modern websites often host content in more than one location. This content may be images hosted on a content delivery network (CDN) or fonts hosted on a third-party service like Google. When we run Siege, we want to ensure that we are only benchmarking domains that we have permission to test. Therefore, we must remove any URLs in the mixed-urls.txt file that do not point to the target website.
Use grep, a utility for searching plain text input against user-specified regular expressions, to find only those URLs that match your test domain and redirect the results to a new file named urls.txt.
- grep -a "^http://www.example.com" mixed-urls.txt > urls.txt
The -a flag tells grep to treat a binary file like a text file. This is necessary because browsers sometimes make POST requests that contain binary data, which Sproxy would then write to mixed-urls.txt. If there is binary data in mixed-urls.txt, grep would fail without the -a flag.
In regular expression terms, the ^ character indicates that strings must start with http://www.example.com to be considered a match.
This command will produce no output in the terminal, but it will create a new file called urls.txt.
Now, open urls.txt to ensure that every line begins with your test website’s domain name and delete any lines that do not.
- nano urls.txt
Save your changes and close the file when you are done editing.
Your URLs list now contains only those URLs that you have permission to test, so we are ready to install Siege. If you would also like to benchmark your website via HTTPS, follow the optional instructions in Step 5 to create a second URL file that contains HTTPS versions of your URLs.
Step 5 — Creating an HTTPS URL File (Optional)
Many websites run over both HTTP and HTTPS or even over HTTPS exclusively, so it is important that you can benchmark your website over HTTPS, too. This is something Siege can do. You only need to give it a list of URLs that start with https.
First, use the cat command to open urls.txt and pass its contents to sed, a utility for parsing and transforming text. sed will replace all instances of http with https and display the results in the terminal.
- cat urls.txt | sed 's|http|https|'
The output will be the same list of URLs you already have in the urls.txt file, except that each of the outputted URLs will begin with https.
Example Outputhttps://www.example.com/
https://www.example.com/index.html
https://www.example.com/about.html
Once you have verified the output, re-run the command, this time writing the output to a new file called urls-https.txt.
- cat urls.txt | sed 's|http|https|' > urls-https.txt
This command will not produce any output to the terminal, since it has all been redirected into urls-https.txt.
Now that we have the updated URLs list, we are ready to install Siege and begin testing.
Step 6 — Benchmarking and Testing with Siege
Before you can begin testing your website, you must first install Siege.
Siege is available from the standard Ubuntu package repositories, so install it with apt-get.
- sudo apt-get install siege
Siege has two modes of operation: internet and benchmark. Internet mode simulates visitors browsing the target website, while benchmark mode makes requests as rapidly as the web server can handle. We will first run Siege in internet mode.
Internet mode is good for slowly building up the load on the server by increasing the number of simultaneous visitors over time. This mode can also create a sustained load for a long period, which is useful if you need to find out what happens to your website’s performance during operations like creating backups.
Change to your home directory and start Siege in internet mode. If you would like to test against HTTP-only addresses, replace urls_file with urls.txt. If you followed Step 5 and would like to test against HTTPS addresses, replace urls_file with urls-https.txt.
- cd ~
- siege --internet --concurrent=5 --time=30S --log="siege-internet.log" --file="urls_file"
--internetsets Siege to internet mode.--concurrentis the number of visitors to simulate. In this example, we told Siege to simulate 5 concurrent users to generate some traffic without overwhelming the server. As you get more familiar with your server’s capabilities, you can increase this number as needed.--timeis how long Siege will run for. This value can be set withSfor seconds,Mfor minutes, andHfor hours. In this example, we told Siege to run for 30 seconds, again, to generate some traffic without overwhelming the server. In the future, you can experiment with different lengths of time to see how your server responds to a sustained load of traffic.--logis the path to the location you want Siege to write its test results to. By default, this location is/var/log/siege.logand requires sudo privileges.--fileis the path to the file containing the URLs that Siege will use for the test.
When you first start Siege, it reports the version number you are using and the number of concurrent users it is simulating. Then, it tells you that the test has begun.
Siege Output at Start of Run** SIEGE 3.0.8
** Preparing 5 concurrent users for battle.
The server is now under siege...
Once Siege has completed its run or is terminated with CTRL+C, it will also display the results of the test along with the location of the results log file.
Siege Output at End of Run...
Lifting the server siege...      done.

Transactions:                    157 hits
Availability:                 100.00 %
Elapsed time:                  29.72 secs
Data transferred:               0.15 MB
Response time:                  0.49 secs
Transaction rate:               5.28 trans/sec
Throughput:                     0.01 MB/sec
Concurrency:                    2.59
Successful transactions:         161
Failed transactions:               0
Longest transaction:            0.74
Shortest transaction:           0.27

FILE: siege-internet.log
You can disable this annoying message by editing
the .siegerc file in your home directory; change
the directive 'show-logfile' to false.
As the statistics included in the output are complex, we will explore them in-depth in Step 7.
Now, let’s run Siege in benchmark mode to discover the maximum number of page requests the site is capable of serving at a time. This is useful information when trying to decide which additional technologies may improve your website’s performance. Additionally, benchmark mode can highlight resource bottlenecks, as you will see when we examine this mode more closely in Step 8.
Start Siege again, this time in benchmark mode, by using --benchmark instead of --internet.
- siege --benchmark --time=30S --log="siege-benchmark.log" --file="urls_file"
The output follows the same format as before, except that this time the results are different because the mode was different.
Siege Output** SIEGE 3.0.8
** Preparing 5 concurrent users for battle.
The server is now under siege...
Lifting the server siege...      done.

Transactions:                    444 hits
Availability:                 100.00 %
Elapsed time:                  29.72 secs
Data transferred:               18.16 MB
Response time:                  0.49 secs
Transaction rate:               105.28 trans/sec
Throughput:                     4.41 MB/sec
Concurrency:                    14.14
Successful transactions:         421
Failed transactions:               0
Longest transaction:            0.74
Shortest transaction:           0.27

FILE: siege-benchmark.log
You can disable this annoying message by editing
the .siegerc file in your home directory; change
the directive 'show-logfile' to false.
As with the statistics from internet mode, the statistics from benchmark mode are complex. We will explore them in-depth in Steps 7 and 8.
Now that we have tested and benchmarked your site with Siege, we can explore the output in greater detail and make practical use of the statistics.
Step 7 — Understanding Siege’s Results
When it comes to understanding your website’s performance, identifying bottlenecks, and deciding where to focus your upgrade efforts, Siege can be a powerful asset. The statistics it provides cover a range of metrics that can give you deep insights into your website’s overall health.
As we saw in Step 6, Siege’s output generally looks like:
Siege Output at End of Run...
Transactions:                    904 hits
Availability:                  97.41 %
Elapsed time:                   4.59 secs
Data transferred:               4.37 MB
Response time:                  0.07 secs
Transaction rate:             196.95 trans/sec
Throughput:                     0.95 MB/sec
Concurrency:                   12.86
Successful transactions:         904
Failed transactions:              24
Longest transaction:            1.95
Shortest transaction:           0.00
...
Specifically, these metrics mean:
Transactionsis the total number of requests that Siege made.Availabilityis the percent of the requests that the web server responded to, including 4xx and 5xx-level HTTP error codes.Elapsed timeis how long the test ran.Data transferredis the total amount of bandwidth Siege used testing the site.Response timeis the average amount of time the web server took to respond to a request.Transaction rateis the average number of transactions per second that the web server served.Throughputis the amount of data per second that the web server served.Concurrencyis the average number of open simultaneous connections.Successful transactionsis the total number of transactions that were responded to with an HTTP status code of less than 400.Failed transactionsis the total number of transactions that were responded to with HTTP status codes greater than 400.Longest transactionis the time that the longest request took to complete.Shortest transactionis the time that the shortest request took to complete.
Transaction rate and the Failed transactions provide the quickest litmus test of your web server’s overall health.
The Transaction rate represents the speed of your website, as it is the number of pages per second that your web server can serve. The higher this number is, the more visitors your website can handle and the faster the visitors will receive each page. If you are using Siege to improve your website’s general responsiveness, this is the number that you want to increase.
The Failed transactions value refers to any response from the web server that contains an error code, such as 503 Service Unavailable. These errors often point to problems like a database that is unable to handle the number of requests it is receiving or a web server that ran out of RAM. If this number is anything other than zero, you should look at your web server’s log files to see exactly which errors have occurred and to get direction about how to resolve the problems.
As you make changes to increase your Transaction rate and reduce your Failed transactions over time, also remember to consult the log file you create with each run of Siege, as it includes all of the same statistics you see in your terminal as well as the date and time of the test. This will help you track the overall trajectory of your efforts.
Now that we’ve examined Siege’s output to determine your web server’s speed and robustness, it’s time to see how we can use this same information to identify and remove performance bottlenecks.
Step 8 — Identifying Performance Bottlenecks
In benchmark mode, Siege makes as many requests per second as the web server is capable of serving. When the server hits the maximum number of pages it can serve, it has reached a resource limit.
The four most likely resources to be affected are:
- RAM
- CPU
- Disk
- Network bandwidth
To get the most out of benchmark mode, you need to run a couple of additional tools at the same time as Siege, so that you can monitor what happens across your system as Siege increases its test load.
You can monitor the first three resources — RAM, CPU, and disk usage — with top, a tool that provides a dynamic, real-time view of system resources.
Ubuntu comes with top by default, so you don’t need to install it. Simply run the command, top.
The information shown in top is split into two sections.
Sample top Outputtop - 21:02:32 up 50 min,  1 user,  load average: 0.07, 0.02, 0.00
Tasks: 102 total,   1 running, 101 sleeping,   0 stopped,   0 zombie
%Cpu(s):  37.3 us,  7.3 sy,  0.0 ni, 99.3 id,  8.3 wa,  0.0 hi,  0.0 si,  0.0 st
KiB Mem :   1015200 total,    63536 free,    431456 used,   520208 buff/cache
KiB Swap:        0 total,        0 free,        0 used.   512308 avail Mem

  PID USER      PR  NI    VIRT    RES    SHR S %CPU %MEM     TIME+ COMMAND
 3249 www-data     20   0   469592   92276   33488 D  24.6  9.1   0:05.01 apache2
 3239 www-data     20   0   442836   75080   41896 S  5.6  7.4   1:31.97 apache2
 3572 www-data     20   0   424372   35272   21164 S  4.0  3.5   0:02.69 apache2
The upper section, made up of the first five lines of output, shows a summary of the current system usage.
The lower section shows a list of the individual server processes currently running on the system along with each process’ identification number, owner, priority, nice value, virtual memory use, physical memory use, shared memory use, status, percent of CPU use, percent of memory use, total time of activity, and name.
While top is a useful tool for managing processes and monitoring CPU use, in this case, we want to see what it can tell us about our system under the duress of a Siege benchmark test.
The CPU usage reads, %Cpu(s): 37.3 us, 7.3 sy,. These values tell us that the user processes are consuming 37.3% of the CPU, and the system processes are consuming 7.3%. If you add these two values together, you will get the total CPU usage.
If your server is running at or near 100% CPU usage, check the top entries in the list of processes to see if one or more are consuming unusually high amounts of CPU. If so, consider reconfiguring or fine-tuning the processes to use less CPU. If that’s not possible, you may need to upgrade the CPU on your server.
Now, let’s examine memory usage.
Sample top Outputtop - 21:02:32 up 51 min,  1 user,  load average: 0.21, 0.47, 0.80
Tasks: 102 total,   1 running, 101 sleeping,   0 stopped,   0 zombie
%Cpu(s):  17.4 us,  3.4 sy,  0.0 ni, 79.2 id,  0.0 wa,  0.0 hi,  0.0 si,  0.0 st
MiB Mem :   991.406 total,    223.914 free,    395.621 used,   371.871 buff/cache
MiB Swap:        0.000 total,        0.000 free,        0.000 used.   526.156 avail Mem

  PID USER      PR  NI    VIRT    RES    SHR S %CPU %MEM     TIME+ COMMAND
 3249 www-data     20   0   469592   92276   33488 D  24.6  9.1   0:05.01 apache2
 3239 www-data     20   0   442836   75080   41896 S  5.6  7.4   1:31.97 apache2
 3572 www-data     20   0   424372   35272   21164 S  4.0  3.5   0:02.69 apache2
By default, RAM usage is displayed in kilobytes on the fourth line. In the preceding example output, we have already pressed SHIFT+E once, converting the value to megabytes to make the numbers easier to work with. Press SHIFT+E a second time to convert the value to gigabytes, and continue pressing SHIFT+E to cycle back to the default kilobytes display.
The total value is the total amount of memory available on the server. Keep in mind that the kernel reserves some memory on boot, so a 1024 MB machine will display 991 MB of memory here.
The avail Mem shows the amount of remaining memory on the system. This number will get smaller as more RAM is used and will eventually hit zero when there is no remaining memory left on the server.
As with CPU usage, if avail Mem is running at or near zero, examine the the list of processes for entries that consume unusually high amounts of memory. If possible, reconfigure or fine-tune those processes to use less memory or upgrade the amount of RAM on your server.
Finally, let’s look at disk usage.
Sample top Outputtop - 21:02:32 up 52 min,  1 user,  load average: 0.21, 0.47, 0.80
Tasks: 102 total,   1 running, 101 sleeping,   0 stopped,   0 zombie
%Cpu(s):  17.4 us,  3.4 sy,  0.0 ni, 79.2 id,  31.6 wa,  0.0 hi,  0.0 si,  0.0 st
KiB Mem :   1015200 total,    63536 free,    431456 used,   520208 buff/cache
KiB Swap:        0 total,        0 free,        0 used.   512308 avail Mem

  PID USER      PR  NI    VIRT    RES    SHR S %CPU %MEM     TIME+ COMMAND
 3249 www-data     20   0   469592   92276   33488 D  24.6  9.1   0:05.01 apache2
 3239 www-data     20   0   442836   75080   41896 S  5.6  7.4   1:31.97 apache2
 3572 www-data     20   0   424372   35272   21164 S  4.0  3.5   0:02.69 apache2
The disk usage that we are interested in, I/O wait, is not how much disk space is available but how much disk access is slowing down the server. Disk access, especially on a server that uses spinning platter hard disks, is very slow, and whenever the server accesses the disks, the CPU must wait for the information to be retrieved.
Top reports this information as the wa value. It indicates the percent of time that the CPU(s) are sitting idle waiting for data from the disk. This number should be as close 0.0 as possible.
In the preceding example, the wa value is 31.6. This means that the CPU is spending a third of its time waiting for data from the disk. This is a large amount of time, and it will severely impact website performance.
I/O wait is often the result of accessing the disk for files or making repeated calls to local databases. If wa is much over 0.0, consider moving static resources to a remote location, like a content delivery network (CDN), or investigate ways to reduce the number of trips your applications make to their related local databases.
Press Q to exit top.
The final resource that we will look at is network usage. To monitor this, we will use the Bandwidth Monitor New Generation tool.
Install this tool with apt-get then run it with the command, bwm-ng.
- sudo apt-get install bwm-ng
- bwm-ng
The top part of the output displays Bandwidth Monitor New Generation’s version number, how often the data is being updated (every .5 seconds by default), the input source being used to determine available network interfaces (/proc/net/dev by default on Linux), and the statstic being displayed (data usage rate by default).
The bottom part of the output includes a table that reports the amount of incoming data (Rx), outgoing data (Tx), and total data (Total) per network interface.
The final row displays the total values across all network interfaces.
Sample bwm-ng Output  bwm-ng v0.6.1 (probing every 0.500s), press 'h' for help
  input: /proc/net/dev type: rate
  -         iface                   Rx                   Tx                Total
  ==============================================================================
               lo:           0.00 KB/s            0.00 KB/s            0.00 KB/s
             eth0:          30.99 KB/s          499.11 KB/s          530.11 KB/s
  ------------------------------------------------------------------------------
            total:          30.99 KB/s          499.11 KB/s          530.11 KB/s
When network bandwidth causes a bottlneck, it is usually because Tx has maxed out. To resolve this problem, get the connection speed of your server from your hosting provider, and compare it to the speeds shown by bwm-ng. If the speed shown by bwm-ng is constantly at, or close to, the maximum bandwidth available to your server, then you will need to consider upgrading your hosting plan or moving to a different provider altogether.
Press CTRL+C to exit Bandwidth Monitor New Generation when you are done testing.
Conclusion
In this guide, we used the Siege benchmarking tool and the Sproxy proxy server to generate a configurable load on a web server and push it to its maximum throughput. These tools are extremely useful for any website deployment, as they help to pinpoint performance issues and plan well-informed upgrades.
For another way to reduce disk I/O and memory bottlenecks, take a look at Varnish HTTP Cache. Varnish is an easy-to-use reverse proxy that stores static website assets, reducing both RAM usage and disk I/O.
If your website uses PHP, consider installing PHP-FPM as an alternative to the standard PHP implementation. PHP-FPM reduces the CPU requirements for serving PHP-based web pages, thereby speeding up your entire website.
Thanks for learning with the DigitalOcean Community. Check out our offerings for compute, storage, networking, and managed databases.
About the author(s)
I have been a Linux Systems Administrator and technical content creator for more than 20 years. I am passionate about using and promoting OSS.
Technical Editor @ DigitalOcean
Still looking for an answer?
This textbox defaults to using Markdown to format your answer.
You can type !ref in this text area to quickly search our full set of tutorials, documentation & marketplace offerings and insert the link!
 This work is licensed under a Creative Commons Attribution-NonCommercial- ShareAlike 4.0 International License.
Become a contributor for community
Get paid to write technical tutorials and select a tech-focused charity to receive a matching donation.

DigitalOcean Documentation
Full documentation for every DigitalOcean product.

Resources for startups and AI-native businesses
The Wave has everything you need to know about building a business, from raising funding to marketing your product.
The developer cloud
Scale up as you grow — whether you're running one virtual machine or ten thousand.

Start building today
From GPU-powered inference and Kubernetes to managed databases and storage, get everything you need to build, scale, and deploy intelligent applications.
