By Chris Skaaning and Caitlin Postal

The author selected the Diversity in Tech Fund to receive a donation as part of the Write for DOnations program.
Introduction
The Diagram as Code tool allows you to create an architecture diagram of your infrastructure. You can reuse code, test, integrate, and automate the process of drawing diagrams, which will enable you to treat documentation as code and to build pipelines for mapping your infrastructure. You can use the diagrams script with many cloud providers and custom-built infrastructure.
In this tutorial, you will create a basic diagram in Python and upload it to an object storage bucket. When finished, you will understand how the diagrams script works, enabling you to create new integrations.
Prerequisites
To follow this tutorial, you will need:
- An Ubuntu 20.04 server with a non-root user, which you can set up by following the Initial Server Setup with Ubuntu 20.04. The examples in this tutorial will be from an Ubuntu 20.04 server running on DigitalOcean.
- Python 3 version 3.6 or higher installed on your machine, which you can set up with Step 1 in How To Install Python 3 and Set Up a Programming Environment on an Ubuntu 20.04 Server.
- A DigitalOcean account. If you do not have one, sign up for a new account.
- A DigitalOcean Space for storing data with access keys, which you can set up by following our Spaces documentation.
Step 1 — Installing Graphviz
In this step, you will install the Graphviz tool. Graphviz is the engine of the diagrams module, and it generates the diagrams themselves.
First, update your server’s packages:
- sudo apt update
Then, install Graphviz with this command:
- sudo apt install -y graphviz
The -y option provides an automatic yes to any additional prompts involved in the installation process. You can also download Graphviz for other distributions.
When the installation finishes, you will have Graphviz installed.
Because you will use Pip3 later in the tutorial to install Python dependencies, you can check that you have the correct version:
- pip3 --version
You should see something like this:
Outputpip 20.0.2 from /usr/lib/python3/dist-packages/pip (python 3.8)
In this step, you updated your server, installed Graphviz, and checked your Pip version. Next, you will build the diagrams script.
Step 2 — Building the Python Script
In this step, you will write an example diagram script in Python.
First, create a folder to work in:
- mkdir ~/my-diagram
After creating the folder for the project, move into it with this command:
- cd ~/my-diagram
Then, create a requirements.txt file to keep track of project dependencies:
- echo -e "diagrams==0.21.1\ngraphviz==0.16" | tee requirements.txt
This command has two keywords: echo will print the string, and the -e option will parse out new lines with the \n insertion to a nicely formatted requirements file.
The | sign indicates a pipe for the results of the echo statement. The tee command takes the input from the pipe and creates a new file from it, named according to the parameter listed: in this case, requirements.txt.
The requirements.txt file in Python provides a list of modules needed to run scripts successfully. For now, this project has two dependencies.
After creating the file, you will see an output like this:
Outputdiagrams=0.21.1
graphviz=0.16
This display indicates the version numbers for the two tools.
Now, you will write the Python script to create the diagram image.
Make sure you’re still in the directory you created:
- cd ~/my-diagram
Next, open a new file using nano or your favorite text editor:
- nano my-diagram.py
Add the following code:
from diagrams import Diagram, Cluster, Edge
This line will import the diagram pieces needed to create the generic diagram elements.
Next, you must import what is necessary to draw the DigitalOcean infrastructure you will build. In this example, you will create a diagram showing two Droplets connected to a database with all hosts sending logs to a Logstash instance.
Add the following lines to import the Droplet, DbaasPrimary, and Logstash icons:
...
from diagrams.digitalocean.compute import Droplet
from diagrams.digitalocean.database import DbaasPrimary
from diagrams.elastic.elasticsearch import Logstash
These lines import the icons needed for this tutorial. You can find all the available DigitalOcean icons in the Mingrammer documentation.
With the icons imported, you can start to build the diagram. This code section will create a diagram called My Diagram: Droplets:
...
with Diagram("My Diagram: Droplets", show=False, filename="my-diagram", direction="LR"):
The show parameter can open it upon creation, but it has been set to False since you are working on a Linux host. The generated file will be named whatever string is assigned to filename. The direction is the direction you want the diagram to be printed. The supported values for direction are TB (Top -> Bottom) and LR (Left -> Right). Selecting the direction can make the diagram easier to read. For this diagram, you will use LR.
Finally, add the icons to the diagram:
...
with Diagram("My Diagram: Droplets", show=False, filename="my-diagram", direction="LR"):
    with Cluster("DigitalOcean"):
        droplet1 = Droplet("My first Droplet")
        droplet2 = Droplet("My second Droplet")

    db = DbaasPrimary("My database")

    logstash = Logstash("Logstash service")
Cluster creates a box around your Droplets in the diagram, showing them a in space called DigitalOcean. Droplet, DbaasPrimary, and Logstash will create icons with the names supplied in strings.
Next, you will create dependencies between the various items in the diagram by adding these lines:
...
    [droplet1, droplet2] >> db >> [droplet1, droplet2]
    [droplet1, droplet2, db] >> Edge(color="firebrick", style="dashed") >> logstash
You connect your Droplets to the DbaasPrimary database created above, both reading and writing. Then, you add a dashed line in the color firebrick to indicate a connection from the Droplets and primary DB to Logstash.
Your final my-diagram.py file will look like this:
from diagrams import Diagram, Cluster, Edge
from diagrams.digitalocean.compute import Droplet
from diagrams.digitalocean.database import DbaasPrimary
from diagrams.elastic.elasticsearch import Logstash

with Diagram("My Diagram: Droplets", show=False, filename="my-diagram", direction="LR"):
    with Cluster("DigitalOcean"):
        droplet1 = Droplet("My first droplet")
        droplet2 = Droplet("My second droplet")

    db = DbaasPrimary("My database")

    logstash = Logstash("Logstash service")

    [droplet1, droplet2] >> db >> [droplet1, droplet2]
    [droplet1, droplet2, db] >> Edge(color="firebrick", style="dashed") >> logstash
Save and close the file.
You now have a file called my-diagram.py and one called requirements.txt in the same folder.
With these two files, you can install the required modules and create the diagram.
Step 3 — Creating the Diagram
With the Python script written, you can run it to create the diagram.
Start by installing the requirements with Pip:
- pip3 install -r requirements.txt
You will see an output like this:
OutputCollecting diagrams==0.21.1
  Using cached diagrams-0.21.1-py3-none-any.whl (23.8 MB)
Collecting graphviz==0.16
  Using cached graphviz-0.16-py2.py3-none-any.whl (19 kB)
Requirement already satisfied: jinja2<4.0,>=2.10 in /usr/lib/python3/dist-packages (from diagrams==0.21.1->-r requirements.txt (line 1)) (2.10.1)
Installing collected packages: graphviz, diagrams
Successfully installed diagrams-0.21.1 graphviz-0.16
When the requirements are installed, run the Python script:
- python3 my-diagram.py
This script will generate a diagram named my-diagram.png, which looks like this:
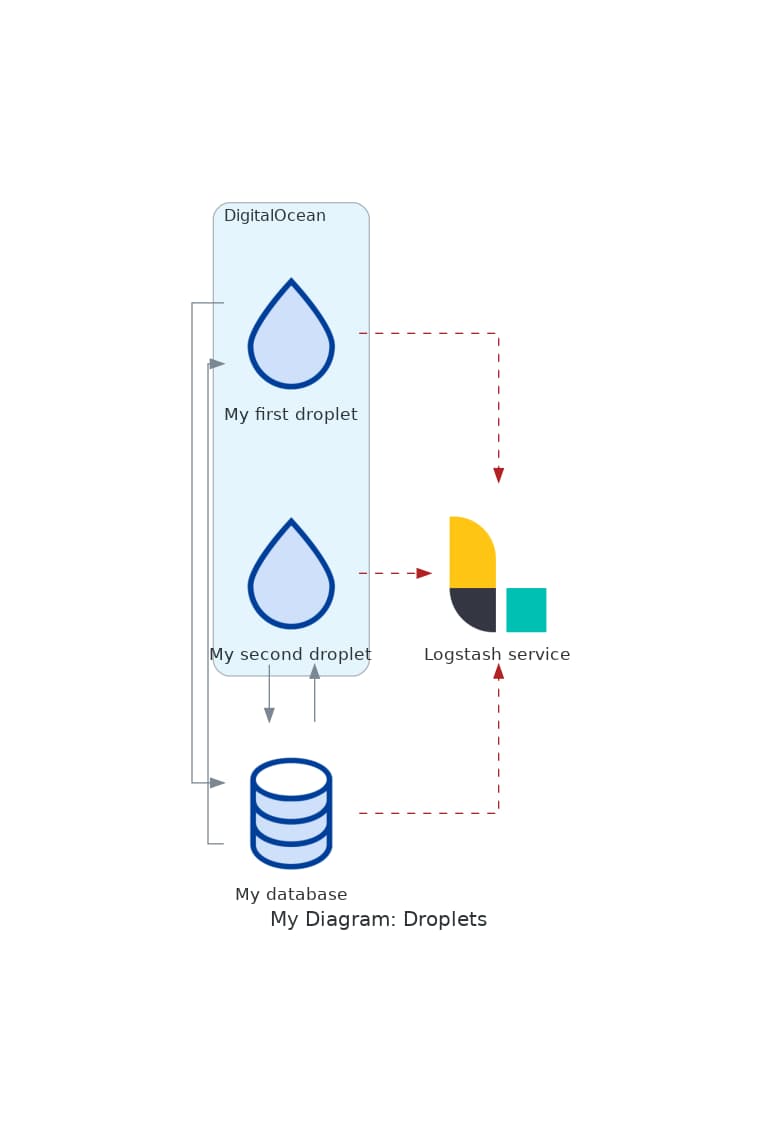
For more information about different types of icons and other ways to use this module, you can read the Mingrammer documentation.
In this step, you created the diagram. Next, you will add it to your object storage so that you can access the .png file.
Step 4 — Uploading Your Diagram to Object Storage
To view your diagram from different places, you will now upload the diagram to object storage. For this tutorial, you will use a DigitalOcean Spaces bucket.
During the prerequisites, you set up a Spaces bucket and created a set of access keys.
Next, install s3cmd, which is a tool for interacting with s3-style APIs from the CLI:
- sudo apt install -y s3cmd
After installation, configure s3cmd:
- s3cmd --configure
You will now set up the configuration using your API credentials and other preferences. Each prompt below will load as its own line, so update the highlighted sections with your information and choices:
OutputHTTP Proxy server name:

New settings:
Access Key: your-access-key
Secret Key: your-secret-key
Default Region: EU
S3 Endpoint: ams3.digitaloceanspaces.com
DNS-style bucket+hostname:port template for accessing a bucket: %(bucket)s.ams3.digitaloceanspaces.com
Encryption password: your-encryption-password
Path to GPG program: /usr/bin/gpg
Use HTTPS protocol: True
HTTP Proxy server name:
HTTP Proxy server port: 0
The S3 Endpoint needs to match the one provided in your Spaces settings, with the DNS-style in a similar format. The sample above uses ams3 because this Spaces bucket is hosted on Amsterdam datacenter 3. Update yours accordingly.
Once you have set your preferences, select Y to test the credentials:
OutputTest access with supplied credentials? [Y/n] Y
The test will run. If it fails, you can supply new credentials for the configuration and try again. Once it succeeds, you will see the following display:
OutputPlease wait, attempting to list all buckets...
Success. Your access key and secret key worked fine :-)

Now verifying that encryption works...
Success. Encryption and decryption worked fine :-)
Now you can upload the file by running the s3cmd command:
- s3cmd put my-diagram.png s3://your_space_name/my-diagram.png
When your diagram has finished uploading, you will see a display like this:
Outputupload: 'my-diagram.png' -> 's3://your-space-name/my-diagram.png'  [1 of 1]
 43672 of 43672   100% in    0s  1516.98 kB/s  done
If your bucket is publicly accessible or you have made the diagram public, you can visit
https://your-space-name.ams3.digitaloceanspaces.com/my-diagram.png to view your diagram. Be sure to update the URL with the name of your bucket and its datacenter.
If your bucket is not publicly accessible, you can change the file permissions to make it public or you can download the image from your bucket to your local computer.
If you do not need to keep the servers and object storage created during this tutorial, you can follow the documentation on removing Droplets and destroying Spaces.
Conclusion
You have created a diagram using Python, which you can modify for all your future diagram creation needs. You will no longer need to drag boxes to create a diagram manually. You also uploaded the newly created diagram to a Spaces bucket on DigitalOcean.
To see what else you can do with the Diagrams tool, visit the Diagram as Code getting started documentation.
You can also explore your DigitalOcean infrastructure with our API reference documentation.
Thanks for learning with the DigitalOcean Community. Check out our offerings for compute, storage, networking, and managed databases.
About the author(s)
Still looking for an answer?
This textbox defaults to using Markdown to format your answer.
You can type !ref in this text area to quickly search our full set of tutorials, documentation & marketplace offerings and insert the link!
Really nice info @caitlinpostal @cscubadiver. I have a docker setup aiming to consolidate all the diagramming tools mentioned here and also adds support for the C4 model - https://github.com/nosahama/docker-c4-uml-diagrams
 This work is licensed under a Creative Commons Attribution-NonCommercial- ShareAlike 4.0 International License.
Become a contributor for community
Get paid to write technical tutorials and select a tech-focused charity to receive a matching donation.

DigitalOcean Documentation
Full documentation for every DigitalOcean product.

Resources for startups and AI-native businesses
The Wave has everything you need to know about building a business, from raising funding to marketing your product.
The developer cloud
Scale up as you grow — whether you're running one virtual machine or ten thousand.

Start building today
From GPU-powered inference and Kubernetes to managed databases and storage, get everything you need to build, scale, and deploy intelligent applications.
