By Jeff Fan and Anish Singh Walia
")
Introduction
Large language models (LLMs) are powering a new generation of AI applications, but running them efficiently at scale requires robust, distributed infrastructure. DigitalOcean Kubernetes (DOKS) provides a flexible, cloud-native platform for deploying and managing these workloads.
In this tutorial, you’ll learn how to deploy llm-d—a distributed LLM inference framework—on DigitalOcean Kubernetes using automated deployment scripts. Whether you’re a DevOps engineer, ML engineer, or platform architect, this tutorial will help you establish a scalable, production-ready LLM inference service on Kubernetes.
Estimated Deployment Time: 15-20 minutes
This tutorial focuses on basic llm-d deployment on DigitalOcean Kubernetes with automated scripts.
Key Takeaways
- llm-d is an advanced, open-source distributed LLM (Large Language Model) inference framework purpose-built for Kubernetes environments. It enables scalable, production-grade AI inference by separating prefill (context processing) and decode (token generation) stages, optimizing GPU utilization, and supporting multi-node, multi-GPU deployments. Its disaggregated serving architecture and intelligent resource management allow for efficient, cost-effective, and high-throughput LLM serving—ideal for real-time generative AI applications and large-scale inference workloads.
- DigitalOcean Kubernetes (DOKS) offers a fully managed, cloud-native Kubernetes platform that simplifies the deployment, scaling, and management of containerized AI/ML workloads. With built-in support for GPU nodes (including NVIDIA RTX 4000 Ada, RTX 6000 Ada, and L40S), DOKS provides the infrastructure foundation required for high-performance distributed LLM inference.
- This tutorial provides a step-by-step guide to deploying llm-d on DigitalOcean Kubernetes using automated deployment scripts. You’ll learn how to provision GPU-enabled clusters, configure the NVIDIA device plugin, deploy llm-d components, and validate distributed LLM inference—all with best practices for reliability, scalability, and future extensibility.
- By following this tutorial, you’ll be able to quickly launch a production-ready, scalable LLM inference service on Kubernetes, leverage GPU acceleration, and integrate with your own AI applications using an OpenAI-compatible API endpoint.
Prerequisites
- DigitalOcean account with GPU quota enabled.
- doctl CLI installed and authenticated.
- kubectl installed.
- helm installed.
What is llm-d?
llm-d is an advanced, open-source distributed inference framework purpose-built for serving large language models (LLMs) at scale in Kubernetes environments. It is designed to maximize GPU utilization, throughput, and reliability for production AI workloads, and is especially well-suited for multi-node, multi-GPU clusters.
Key Features and Capabilities:
-
Disaggregated LLM Inference Pipeline
llm-d separates the LLM inference process into two distinct stages—prefill (context processing) and decode (token generation)—which can be distributed across different GPU nodes. This disaggregation enables highly parallelized prefill computation and efficient, sequential decode execution, allowing for better resource allocation and higher throughput compared to monolithic serving approaches. -
Intelligent GPU Resource Management
The framework automatically detects and allocates available GPU resources, supporting a range of NVIDIA GPUs (including RTX 4000 Ada, RTX 6000 Ada, and L40S). It dynamically assigns workloads based on GPU memory, compute requirements, and current cluster load, ensuring optimal utilization and minimizing bottlenecks. -
Kubernetes-Native, Cloud-Ready Architecture
llm-d is designed from the ground up for Kubernetes, leveraging native constructs for service discovery, scaling, and fault tolerance. It supports automated deployment, rolling updates, and seamless integration with Kubernetes-native monitoring and logging tools. -
OpenAI-Compatible API
llm-d exposes an OpenAI-compatible API endpoint, making it easy to integrate with existing AI applications, SDKs, and tools that expect the OpenAI API format. -
Scalability and High Availability
The architecture supports horizontal scaling of both prefill and decode nodes, enabling you to independently scale different parts of the inference pipeline based on workload patterns. Built-in health checks and failover mechanisms ensure robust, production-grade reliability. -
Advanced KV Cache Management
llm-d implements efficient key-value (KV) cache sharing and management, which reduces redundant computation and memory usage across requests—critical for high-throughput, low-latency LLM serving. -
Observability and Monitoring
The framework integrates with popular observability stacks (such as Prometheus and Grafana), providing real-time metrics on GPU utilization, request latency, throughput, and error rates.
llm-d represents a next-generation distributed LLM inference platform, specifically designed for Kubernetes environments. Unlike traditional single-node solutions, llm-d brings distributed computing capabilities to LLM inference.
Why Use llm-d on DigitalOcean Kubernetes?
llm-d represents a next-generation distributed LLM inference platform, specifically designed for Kubernetes environments. Unlike traditional single-node solutions, llm-d brings distributed computing capabilities to LLM inference.
llm-d is designed to be a modern, cloud-native distributed LLM inference platform, specifically for Kubernetes environments. Unlike traditional single-node solutions, llm-d brings distributed computing capabilities to LLM inference.
Deploying llm-d on DigitalOcean Kubernetes (DOKS) allows you to take advantage of managed GPU infrastructure, automated scaling, and a developer-friendly cloud platform. This combination empowers teams to:
- Serve large models (e.g., Llama, Mistral, Falcon, or custom LLMs) efficiently and cost-effectively.
- Rapidly iterate and deploy new models or configurations.
- Integrate distributed LLM inference into production AI applications with minimal operational overhead.
In summary, llm-d brings modern, cloud-native distributed systems engineering to LLM inference, making it possible to deliver high-performance, scalable, and reliable AI services on Kubernetes with ease.
Understanding Disaggregated LLM Inference
Think of the difference between fast fashion retail and bespoke tailoring - this perfectly captures the fundamental differences between traditional web applications and LLM inference:
Traditional Web Applications vs. LLM Inference:
| Comparison Aspect | Traditional Web Apps (Fast Fashion) | LLM Inference (Bespoke Tailoring Workshop) |
|---|---|---|
| Service Process | Store displays S·M·L standard sizes, customers grab and checkout | Measurement → Pattern Making → Fitting → Alterations → Delivery |
| Request Lifespan | Milliseconds to seconds (instant checkout) | Seconds to minutes (stitch by stitch execution) |
| Resource Requirements | Similar fabric and manufacturing time per item | Vastly different fabric usage and handcraft time per suit |
| Statefulness | Staff don’t remember your previous purchases | Tailor remembers your measurements and preferences |
| Cost | Low unit price, mass production | High unit price, precision handcraft |
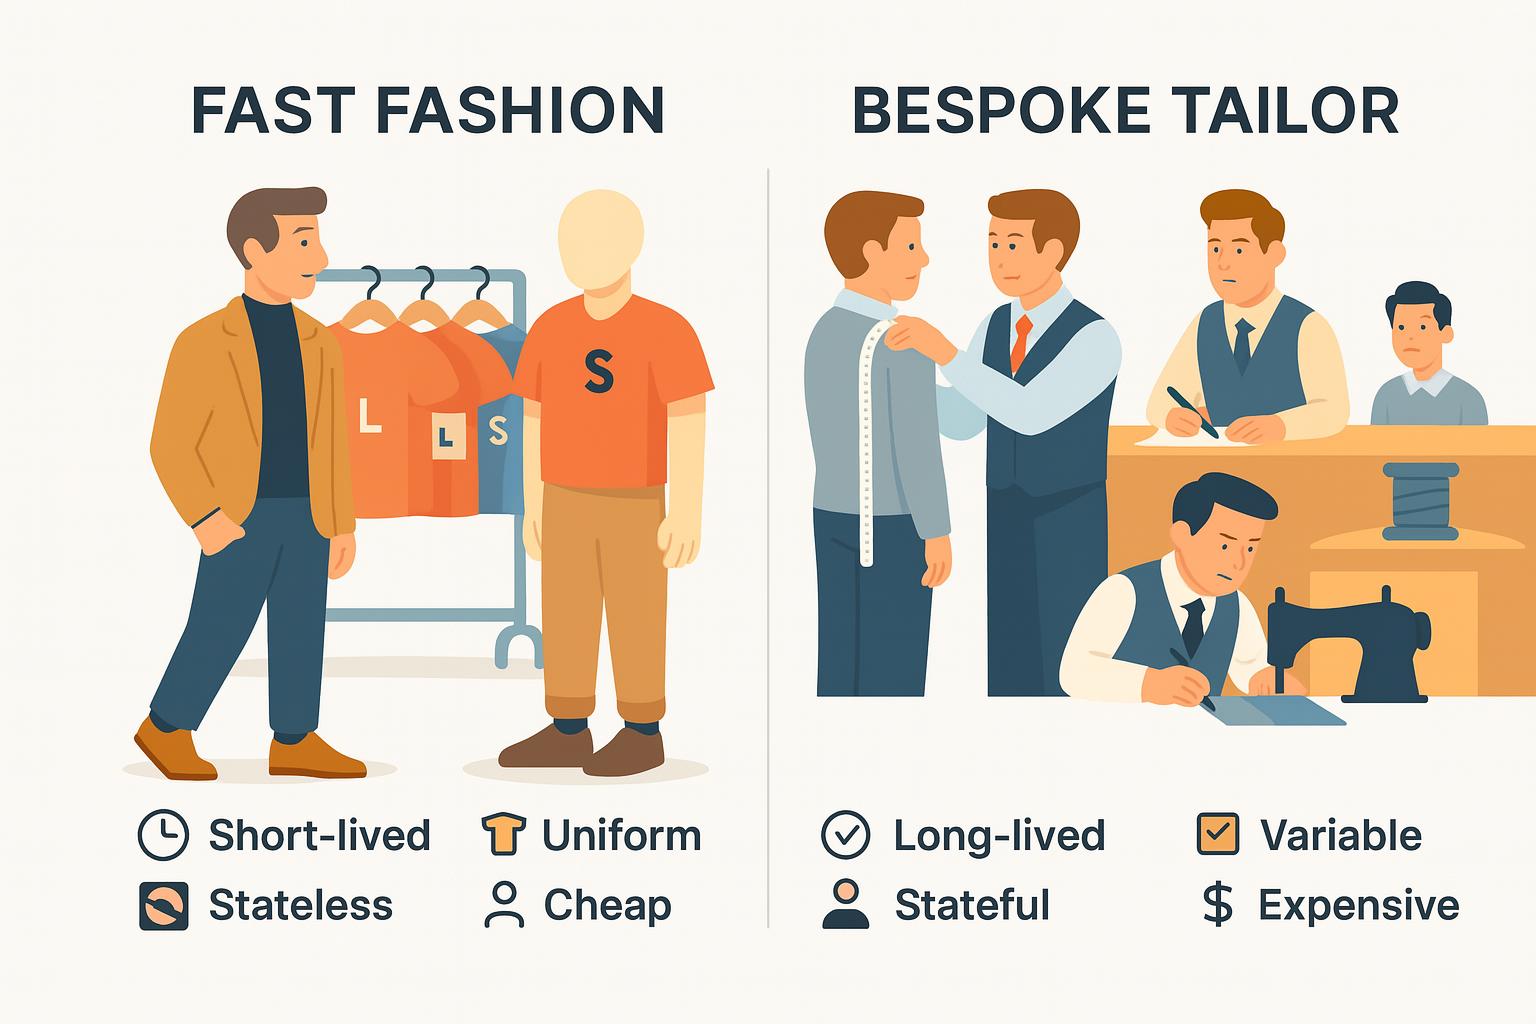
Traditional LLM Serving = “One-Person-Does-Everything Tailor”
Problems with this approach:
- Resource Imbalance: Some customers need simple hem adjustments, others want full custom suits - workload varies dramatically
- Fabric Waste: Each customer monopolizes a pile of fabric, no sharing of leftover pieces
- Queue Blocking: Complex orders in front block quick alterations behind
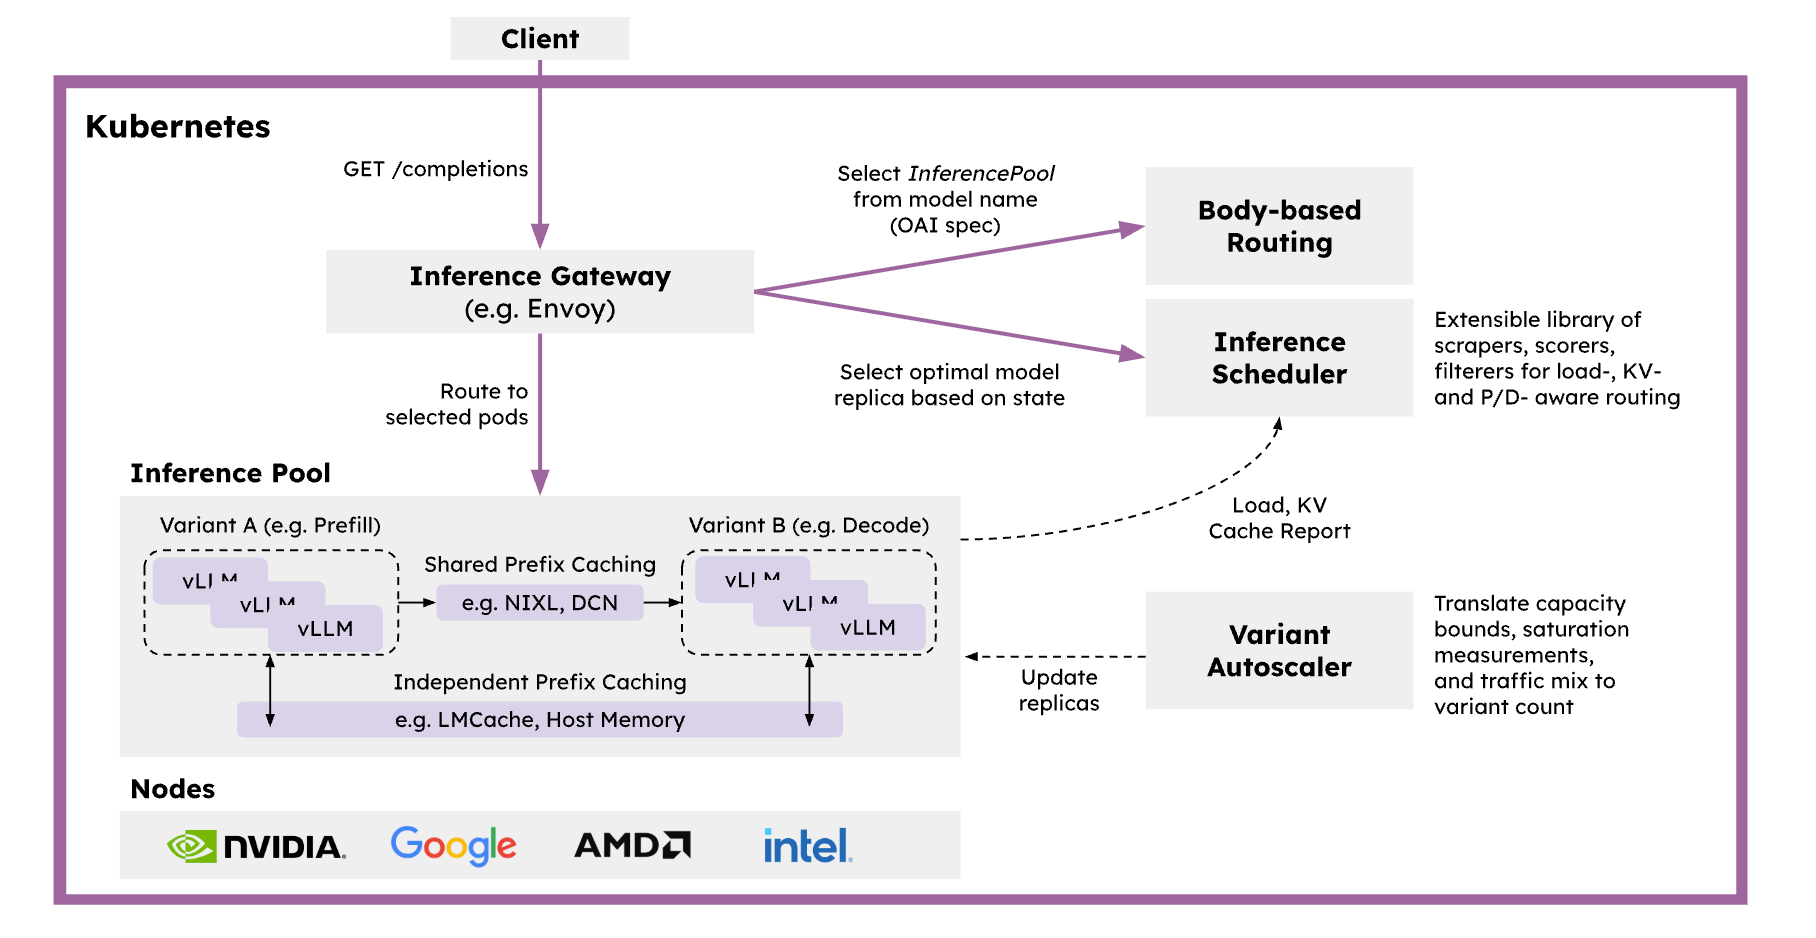
llm-d’s Disaggregated Approach = “Modern Bespoke Tailoring Production Line”
| Station | Process Analogy | Specialized Optimization |
|---|---|---|
| Prefill Station | Measurement + Pattern Making Room | High parallel computation, CPU/GPU collaboration |
| Decode Station | Sewing Room | Sequential output focus, maximum memory bandwidth |
| Smart Gateway | Master Tailor Manager | Dynamic order assignment based on KV Cache and load |
Benefits Achieved:
- Fabric (KV Cache) Sharing: Similar pattern orders concentrated for high hit rates
- Request Shape Optimization: Hem alterations express lane, formal wear slow lane - each takes its own path
- Independent Scaling: Add more pattern makers during measurement season, more sewers during delivery season
- GPU Memory Efficiency: Measurement phase needs compute-heavy/memory-light; sewing phase needs the opposite - separation allows each to take what it needs
To summarize, Fast fashion emphasizes “grab and go”; bespoke tailoring pursues “measured perfection”. llm-d separates measurement from sewing, with intelligent master tailor coordination, making AI inference both personalized and efficient.
Step 1 - Clone the Repository and Setup Environment
First, let’s get the llm-d deployer repository and set up our environment:
# Clone the llm-d deployer repository
git clone https://github.com/iambigmomma/llm-d-deployer.git
cd llm-d-deployer/quickstart/infra/doks-digitalocean
Set Required Environment Variables
# Set your HuggingFace token (required for model downloads)
export HF_TOKEN=hf_your_token_here

# Verify doctl is authenticated
doctl auth list
Important: Model Access Requirements
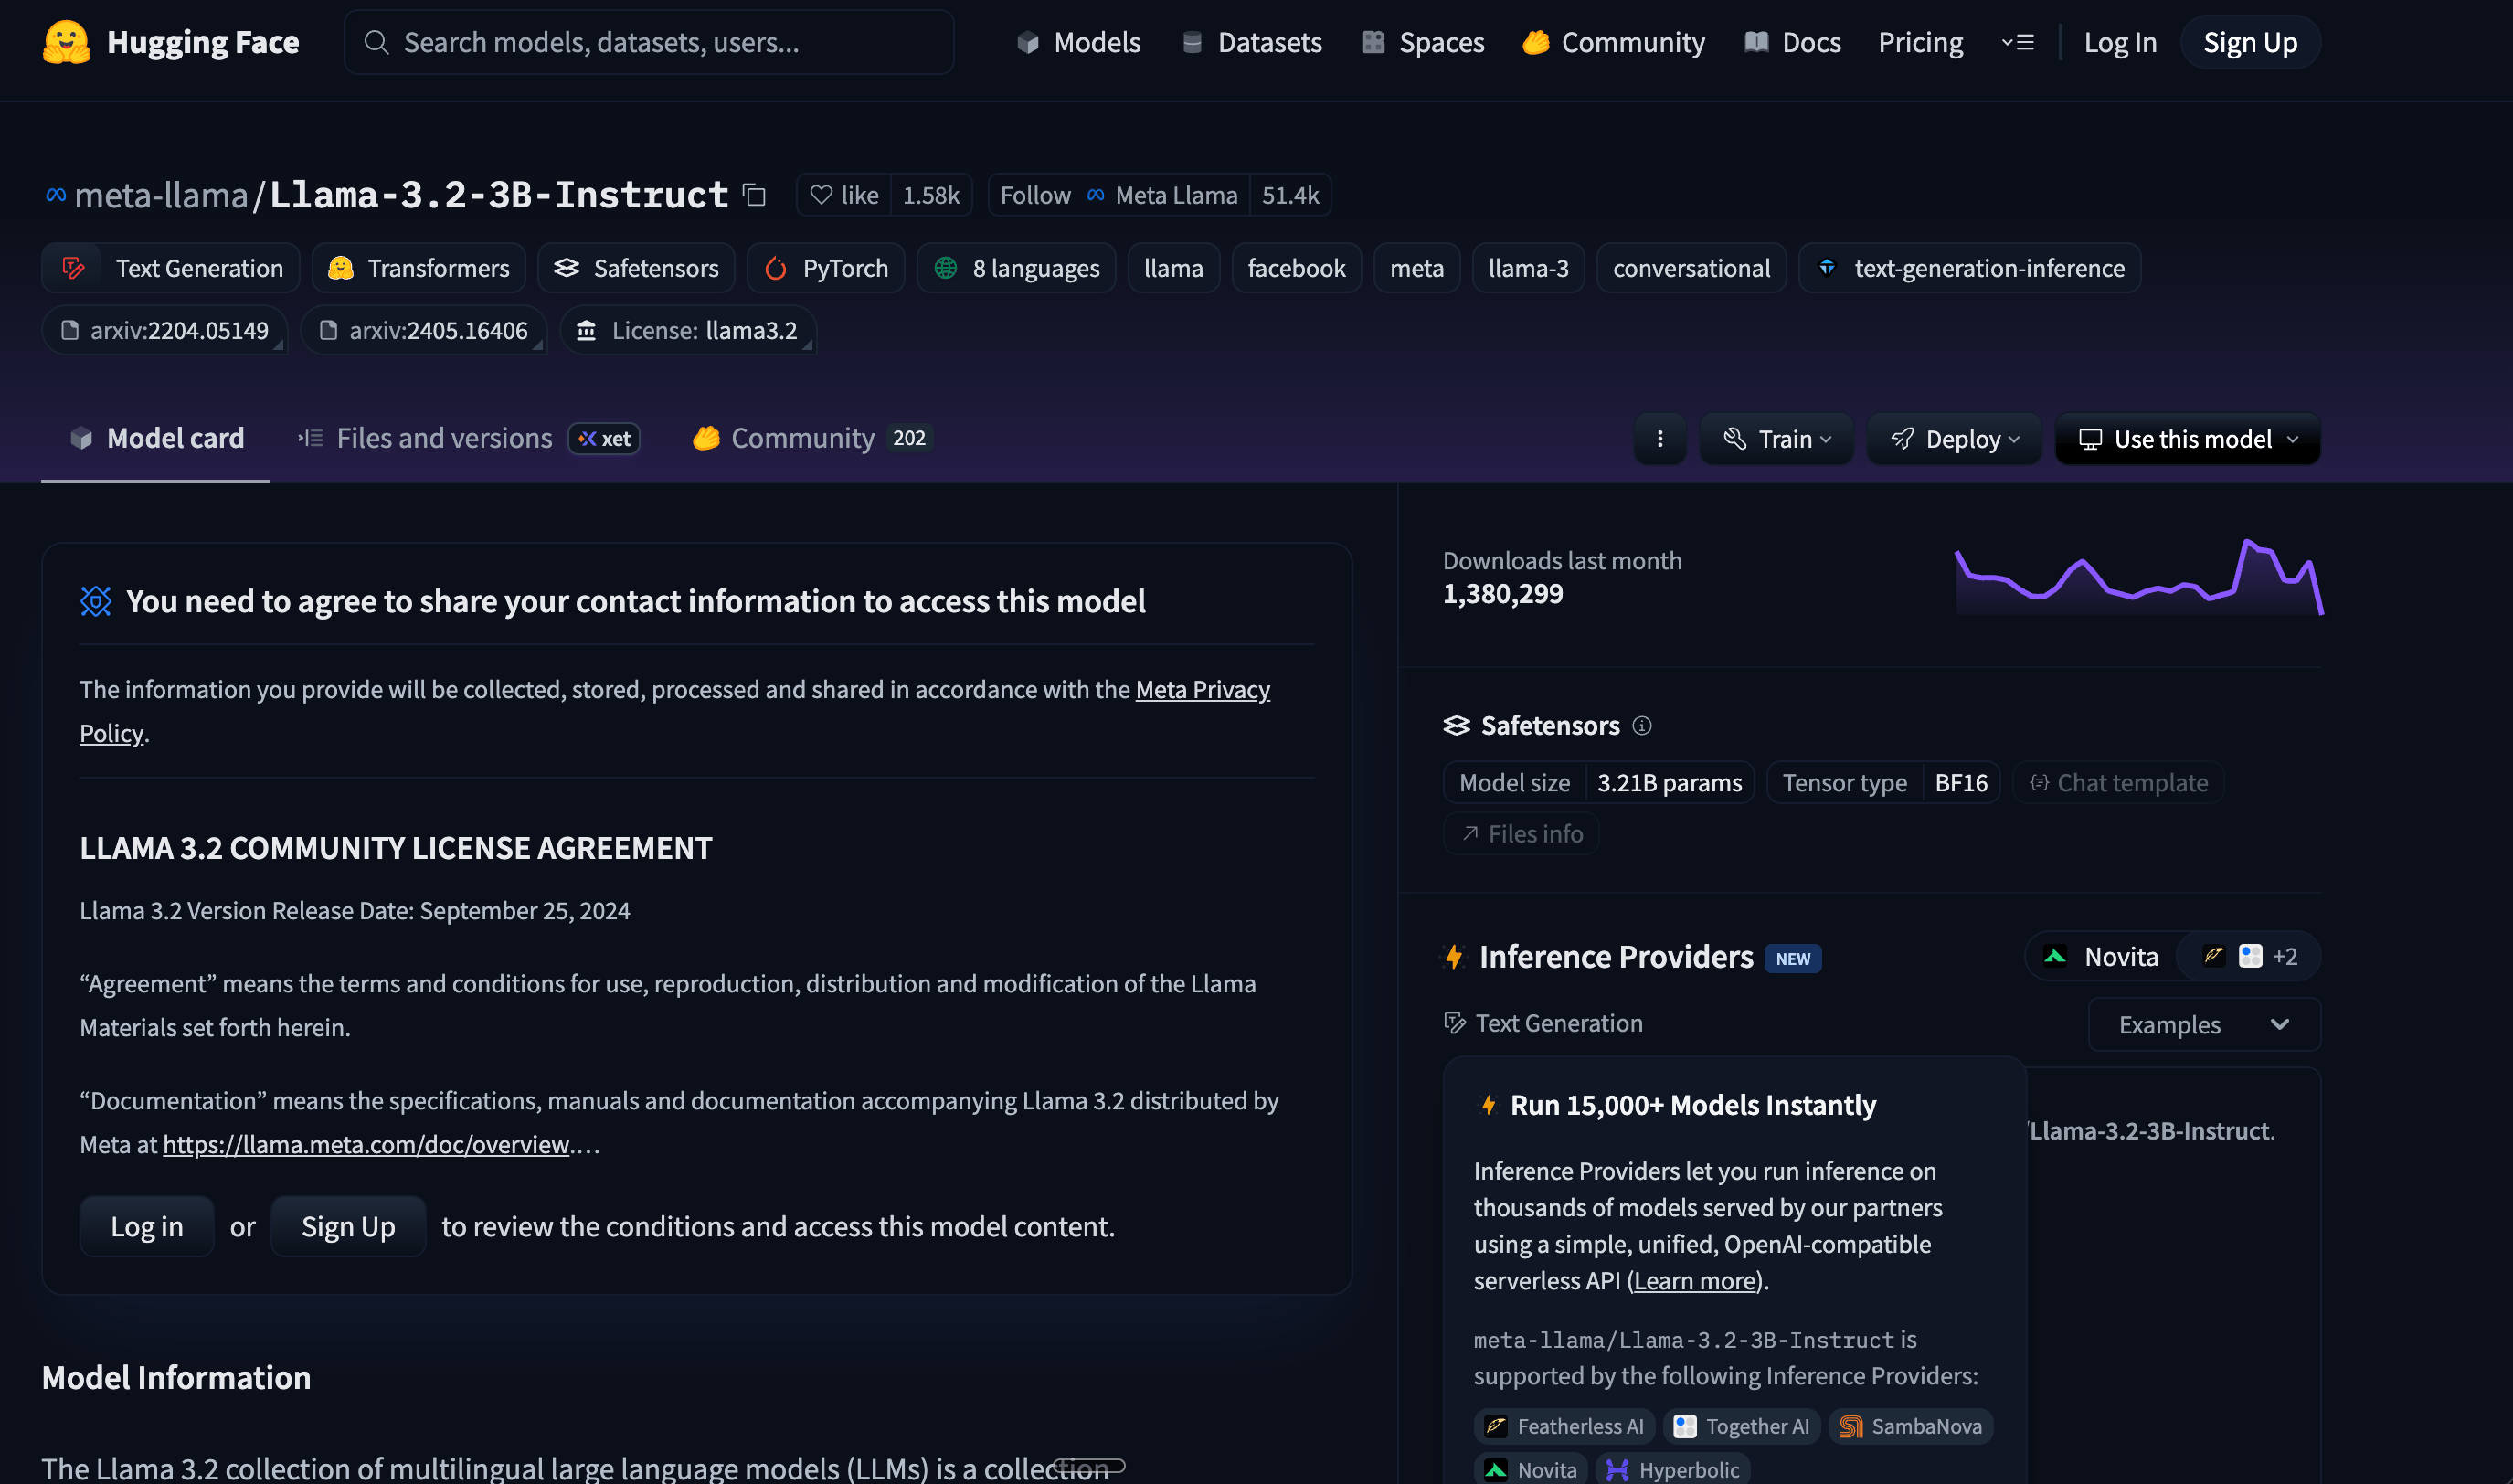
For Meta Llama Models (Llama-3.2-3B-Instruct):
The meta-llama/Llama-3.2-3B-Instruct model used in this tutorial requires special access:
- HuggingFace Account Required: You must have a HuggingFace account.
- Model Access Request: Visit Llama-3.2-3B-Instruct on HuggingFace
- Accept License Agreement: Click “Agree and access repository” and complete the license agreement
- Wait for Approval: Access approval is usually granted within a few hours
- Generate Access Token: Create a HuggingFace access token with “Read” permissions from your Settings > Access Tokens
Alternative Open Models (No License Required):
If you prefer to avoid the approval process, consider these open alternatives:
google/gemma-2b-it- Google’s open instruction-tuned modelQwen/Qwen2.5-3B-Instruct- Alibaba’s multilingual modelmicrosoft/Phi-3-mini-4k-instruct- Microsoft’s efficient small model
To use alternative models, you’ll need to modify the deployment configuration files accordingly.
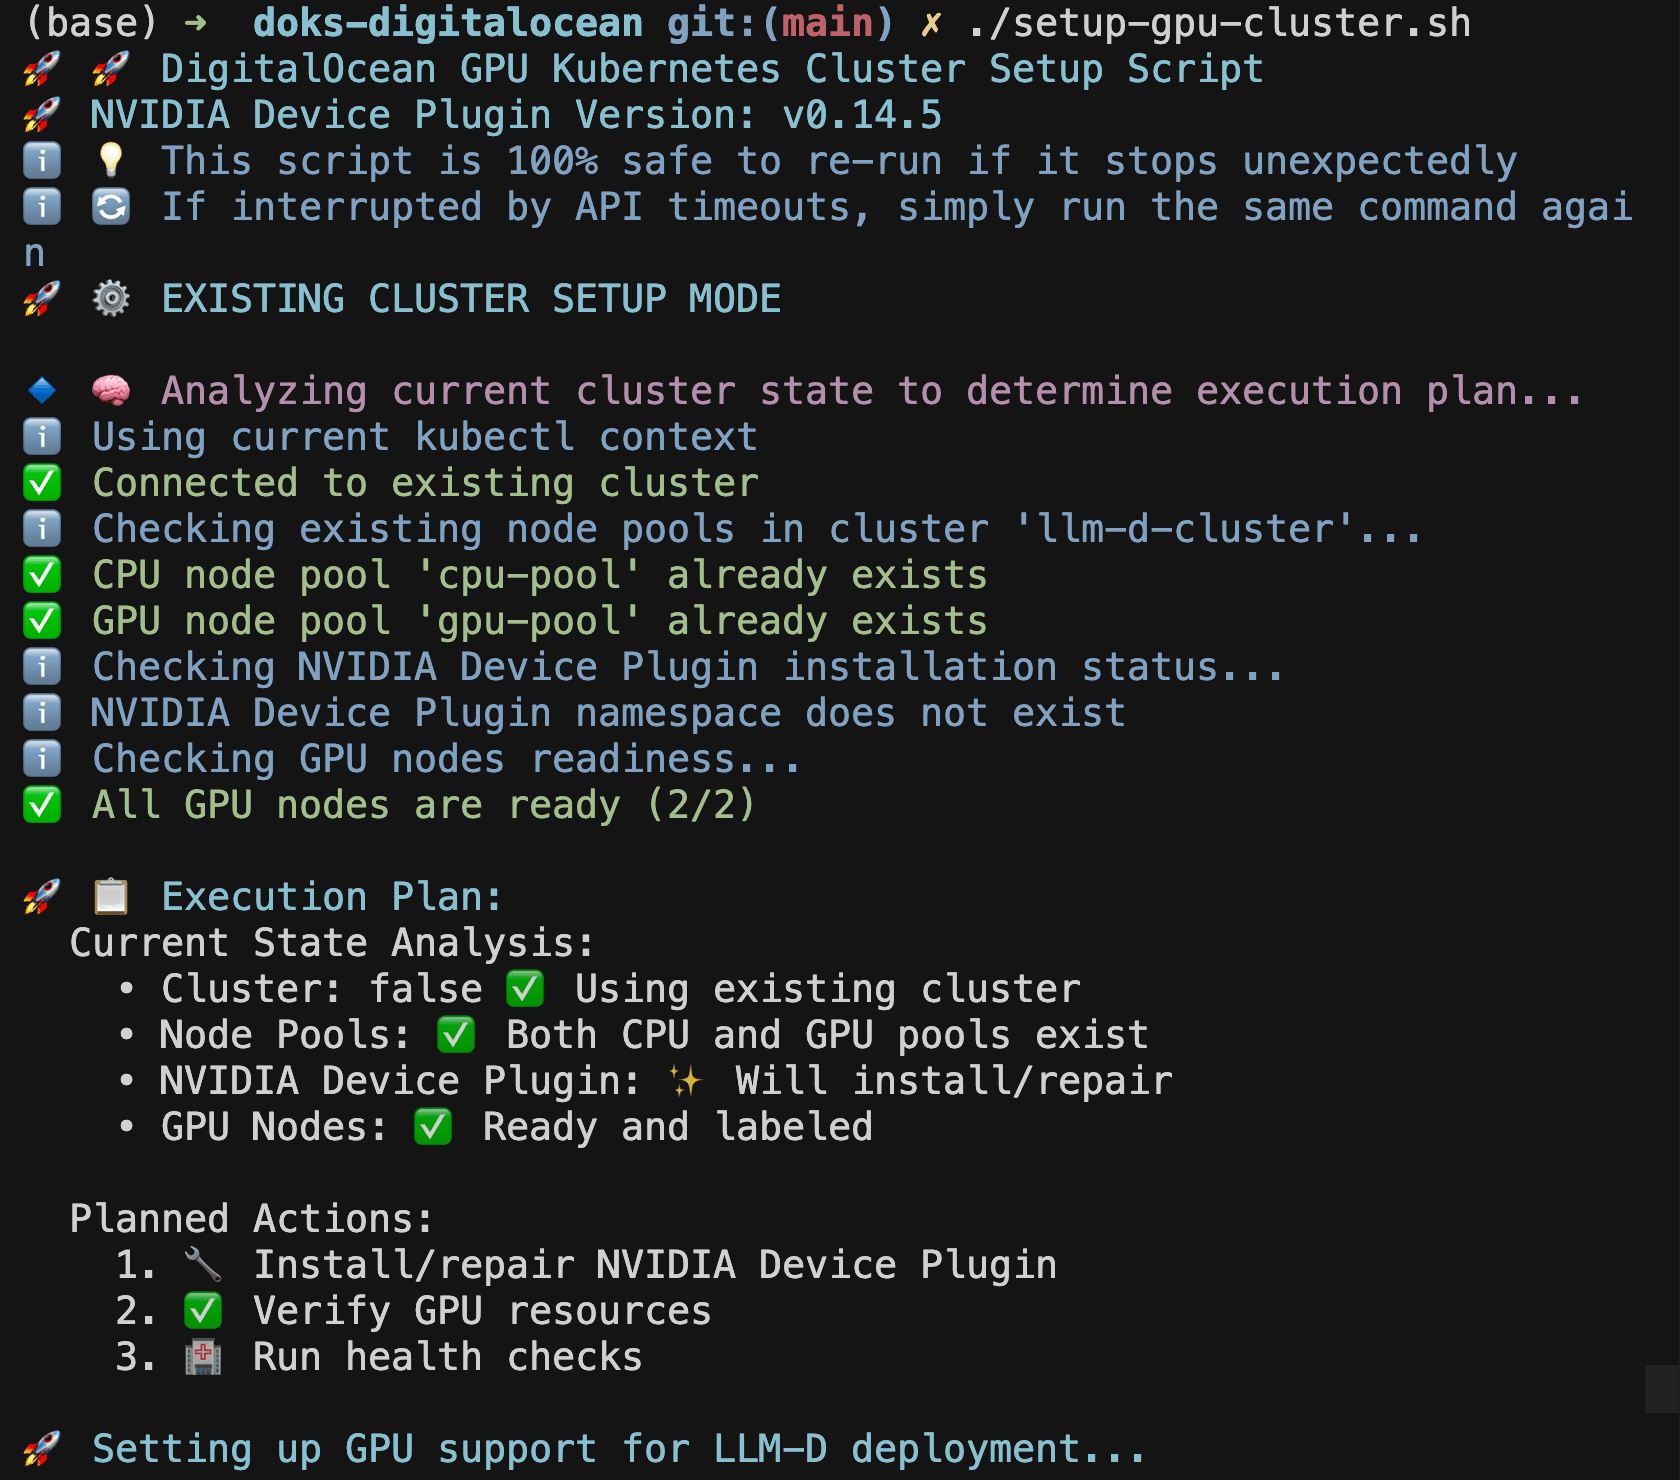
Step 2 - Create DOKS Cluster with GPU Nodes
Our automated script will create a complete DOKS cluster with both CPU and GPU nodes:
# Run the automated cluster setup script
./setup-gpu-cluster.sh -c
The script will:
- Create a new DOKS cluster with CPU nodes
- Add a GPU node pool with your chosen GPU type
- Install NVIDIA Device Plugin for GPU support
- Configure proper node labeling and GPU resource management
Choose Your GPU Type
When prompted, select your preferred GPU type:
- RTX 4000 Ada: Cost-effective for smaller models (7B-13B parameters)
- RTX 6000 Ada: Balanced performance for medium models (13B-34B parameters)
- L40S: Maximum performance for large models (70B+ parameters)
Verify Cluster Setup
# Check cluster status
kubectl get nodes

# Verify GPU nodes are ready
kubectl get nodes -l doks.digitalocean.com/gpu-brand=nvidia

# Check GPU resources are available
kubectl describe nodes -l doks.digitalocean.com/gpu-brand=nvidia | grep nvidia.com/gpu
You should see output similar to:
NAME                   STATUS   ROLES    AGE   VERSION
pool-gpu-xxxxx         Ready    <none>   3m    v1.31.1
pool-gpu-yyyyy         Ready    <none>   3m    v1.31.1
If the Setup Script Stops Unexpectedly
This is completely normal! DigitalOcean API calls may occasionally timeout during node provisioning. If you see the script stop after creating the GPU node pool:
-
Wait 30 seconds for the API operations to complete
-
Re-run the same command:
./setup-gpu-cluster.sh -
The script will automatically detect existing components and continue from where it left off
-
No duplicate resources will be created - the script is designed to be safely re-run
The script has intelligent state detection and will skip already completed steps, making it completely safe to re-run multiple times.
Step 3 - Deploy llm-d Infrastructure
Now let’s deploy llm-d using our automated deployment scripts. This is a two-step process for better reliability and troubleshooting:
Step 3A - Deploy llm-d Core Components
First, let’s deploy the core llm-d inference services:
# Deploy llm-d with your chosen GPU configuration
./deploy-llm-d.sh -g rtx-6000-ada -t your_hf_token
What Gets Deployed:
- Prefill Service: Handles context processing on GPU pods
- Decode Service: Manages token generation with GPU optimization
- Gateway Service: Routes requests and manages load balancing
- Redis Service: Provides KV cache storage
Step 3B - Setup Monitoring (Optional)
After llm-d is running, optionally setup comprehensive monitoring:
# Navigate to monitoring directory
cd monitoring

# Setup Prometheus, Grafana, and llm-d dashboards
./setup-monitoring.sh
Monitoring Components:
- Prometheus: Metrics collection and storage
- Grafana: Visualization dashboards and alerts
- llm-d Dashboard: Custom inference performance dashboard
- ServiceMonitor: Automatic llm-d metrics discovery
Monitor Deployment Progress
# Watch llm-d deployment progress
kubectl get pods -n llm-d -w

# Check all components are running
kubectl get all -n llm-d
Wait until all pods show Running status:
NAME                                           READY   STATUS    RESTARTS   AGE
meta-llama-llama-3-2-3b-instruct-decode-xxx    1/1     Running   0          3m
meta-llama-llama-3-2-3b-instruct-prefill-xxx   1/1     Running   0          3m
llm-d-inference-gateway-xxx                    1/1     Running   0          3m
redis-xxx                                      1/1     Running   0          3m
Monitor Setup Progress (If Step 3B was completed)
# Check monitoring stack status
kubectl get pods -n llm-d-monitoring

# Access Grafana dashboard
kubectl port-forward -n llm-d-monitoring svc/prometheus-grafana 3000:80
Step 4 - Test Your llm-d Deployment
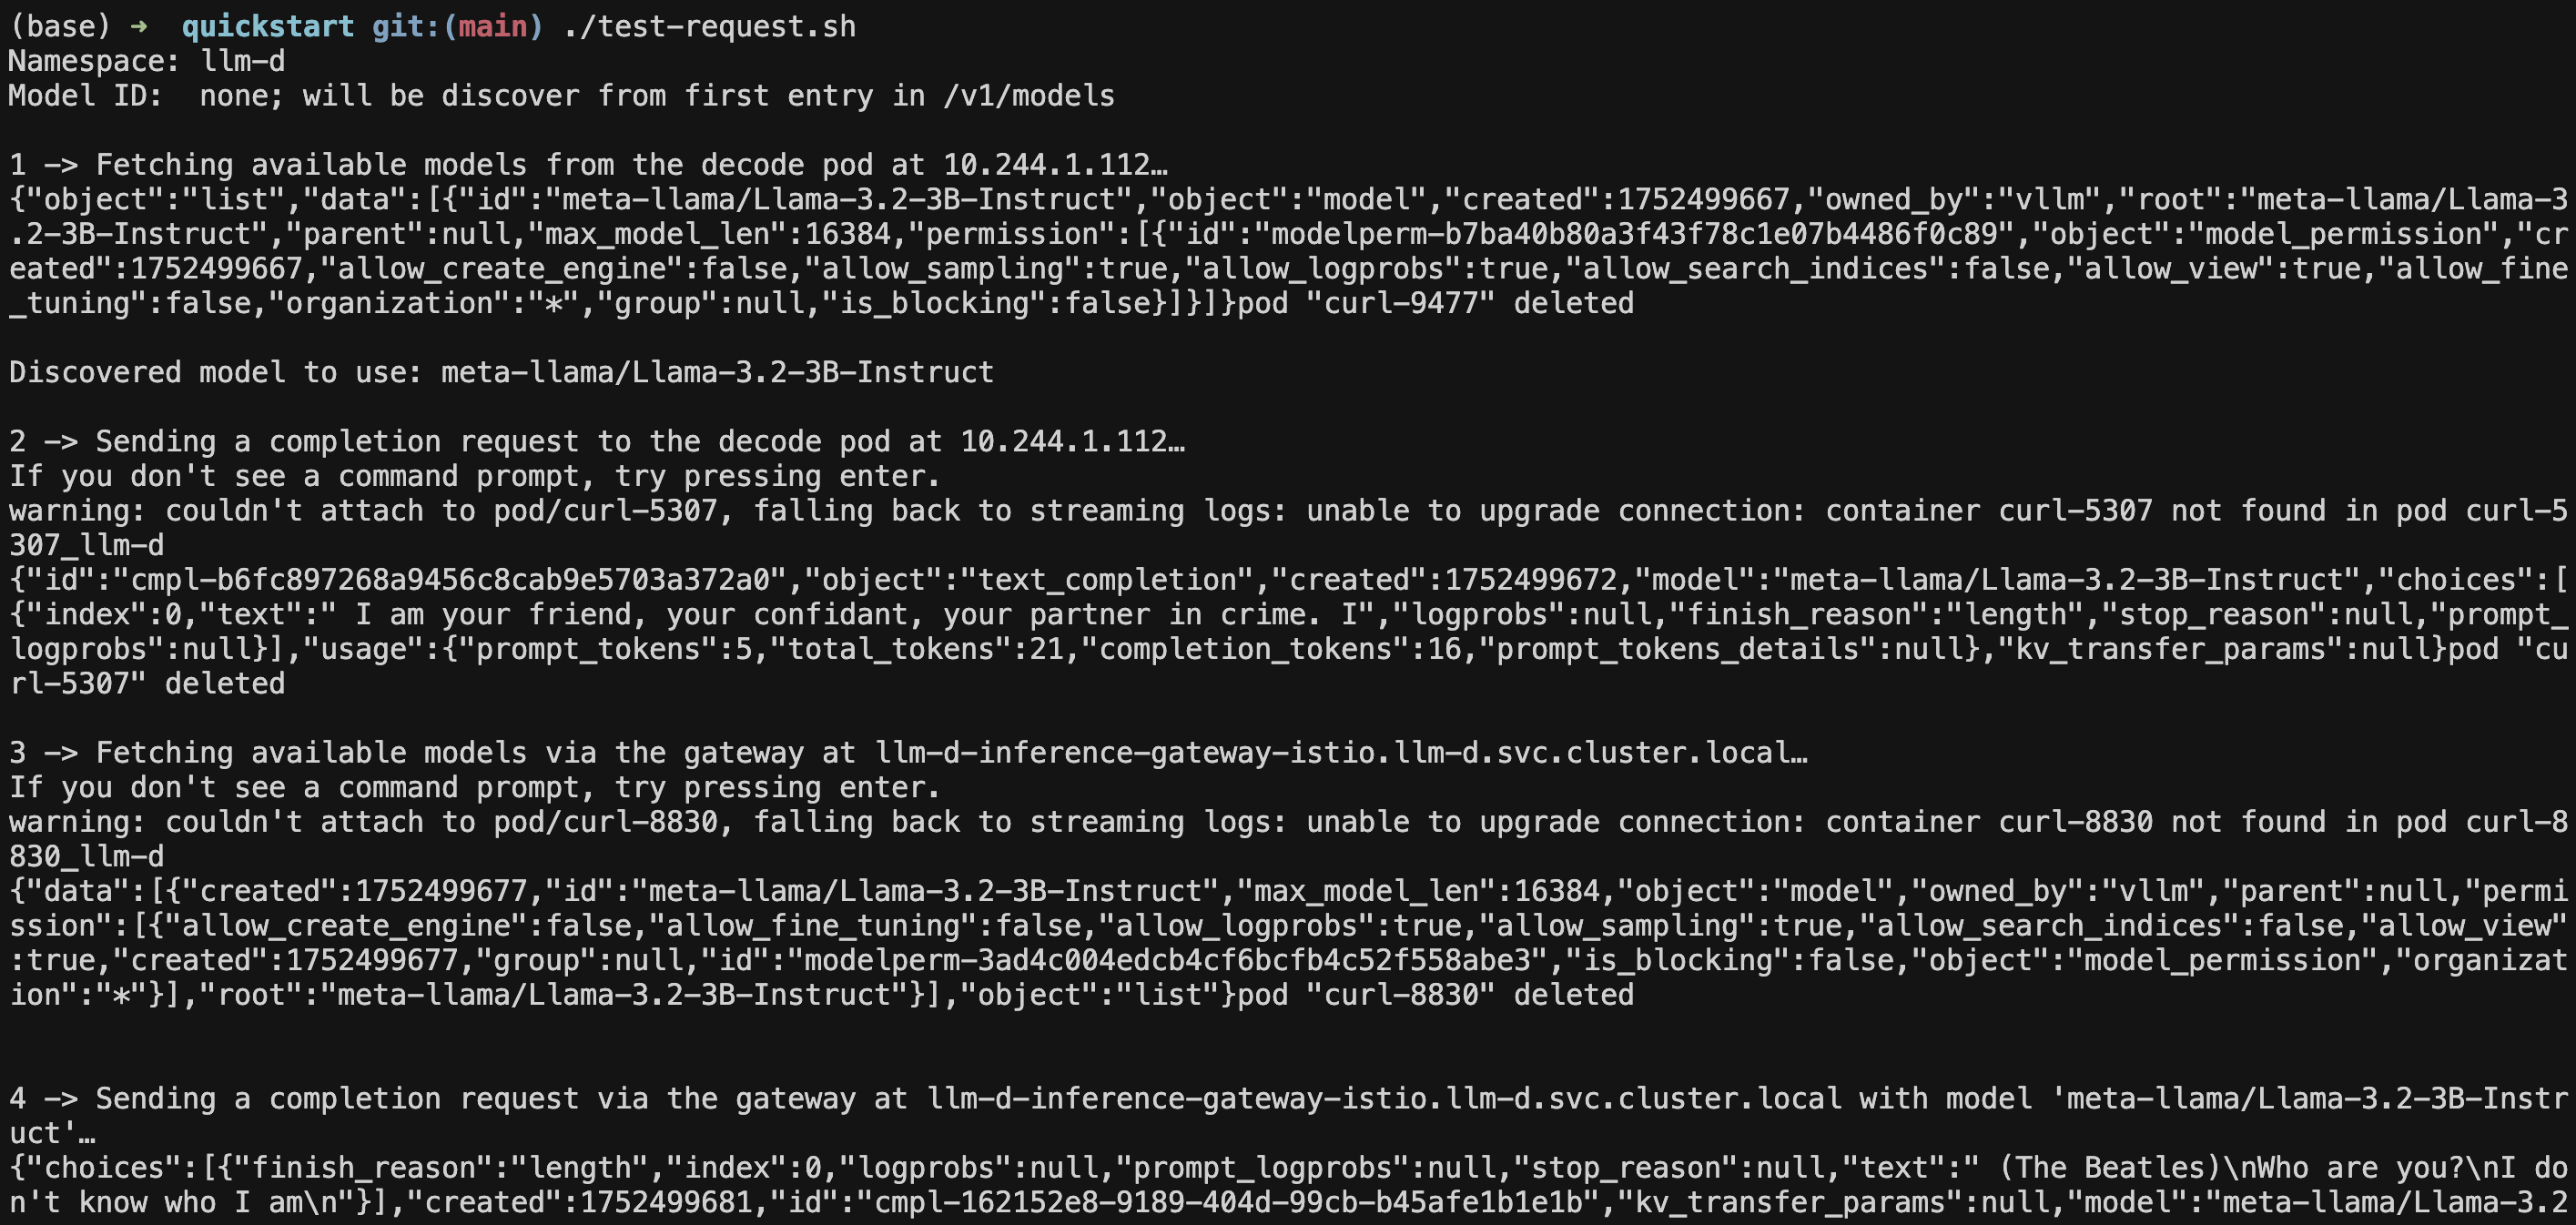
Now let’s test that everything is working correctly using our test script:
# Navigate to the test directory
cd /path/to/llm-d-deployer/quickstart

# Run the automated test
./test-request.sh
Manual Testing (Alternative)
If you prefer to test manually:
# Port-forward to the gateway service
kubectl port-forward -n llm-d svc/llm-d-inference-gateway-istio 8080:80 &

# Test the API with a simple request
curl localhost:8080/v1/chat/completions \
  -H "Content-Type: application/json" \
  -d '{
    "model": "meta-llama/Llama-3.2-3B-Instruct",
    "messages": [
      {"role": "user", "content": "Explain Kubernetes in simple terms"}
    ],
    "max_tokens": 150,
    "stream": false
  }' | jq
Expected Response
You should see a successful JSON response like:
{
  "choices": [
    {
      "finish_reason": "length",
      "index": 0,
      "logprobs": null,
      "message": {
        "content": "Kubernetes (also known as K8s) is an open-source container orchestration system for automating the deployment, scaling, and management of containerized applications...",
        "reasoning_content": null,
        "role": "assistant",
        "tool_calls": []
      },
      "stop_reason": null
    }
  ],
  "created": 1752523066,
  "id": "chatcmpl-76c2a86b-5460-4752-9f20-03c67ca5b0ba",
  "kv_transfer_params": null,
  "model": "meta-llama/Llama-3.2-3B-Instruct",
  "object": "chat.completion",
  "prompt_logprobs": null,
  "usage": {
    "completion_tokens": 150,
    "prompt_tokens": 41,
    "prompt_tokens_details": null,
    "total_tokens": 191
  }
}
Step 5: Access Monitoring and Dashboard
If you completed Step 3B (monitoring setup), you can access the comprehensive monitoring dashboard:
# Port-forward to Grafana
kubectl port-forward -n llm-d-monitoring svc/prometheus-grafana 3000:80

# Get admin password
kubectl get secret prometheus-grafana -n llm-d-monitoring -o jsonpath="{.data.admin-password}" | base64 -d
Grafana Access: http://localhost:3000
Username: admin
Password: (from command above)
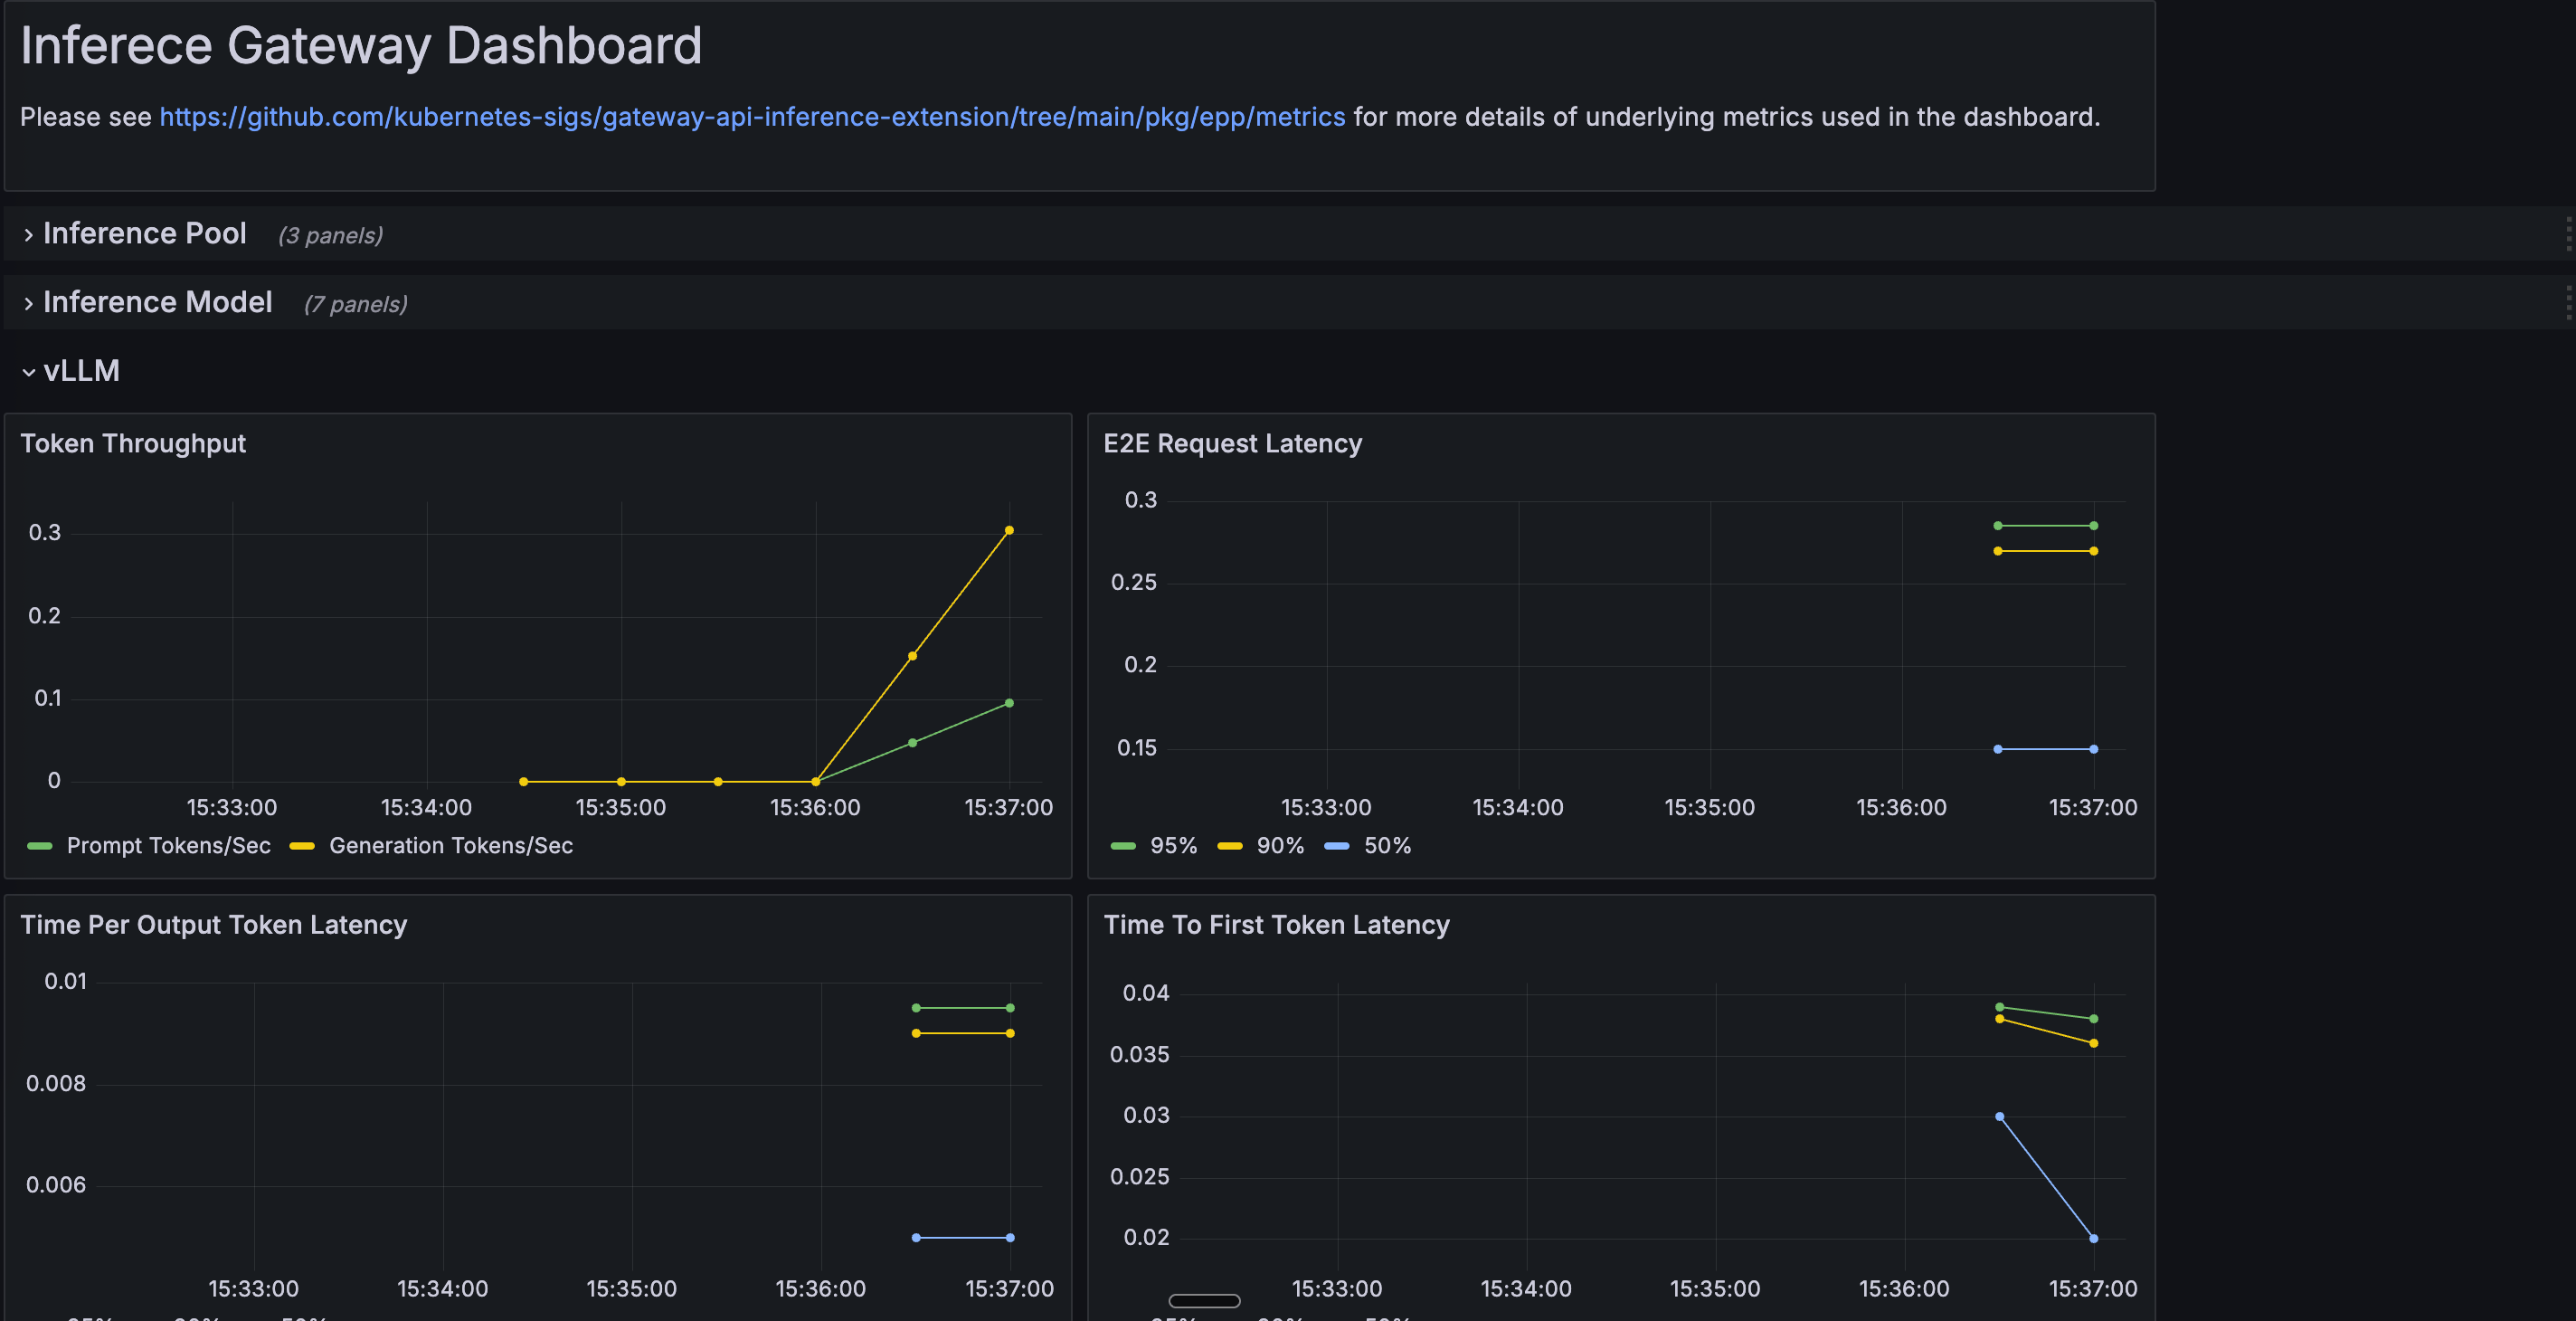
llm-d Dashboard and Key Metrics
After monitoring setup, you’ll find:
- Dashboard Location: Look for “llm-d” folder in Grafana
- Dashboard Name: “llm-d Inference Gateway”
The dashboard may take 1-2 minutes to appear as it’s loaded by Grafana’s sidecar.
Important Metrics to Monitor
Request Performance Metrics:
- Time to First Token (TTFT): Critical for user experience - measures how quickly the first response token is generated
- Inter-Token Latency (ITL): Speed of subsequent token generation - affects perceived responsiveness
- Requests per Second (RPS): Overall system throughput
- Request Duration: End-to-end request completion time
Resource Utilization Metrics:
- GPU Memory Usage: Monitor GPU memory consumption across prefill and decode pods
- GPU Utilization: Actual compute usage percentage of GPUs
- KV Cache Hit Rate: Percentage of requests benefiting from cached computations
- Queue Depth: Number of pending requests waiting for processing
llm-d Specific Metrics:
- Prefill vs Decode Load Distribution: Balance between processing phases
- Cache-Aware Routing Effectiveness: Success rate of intelligent request routing
- Model Loading Time: Time to load models into GPU memory
- Token Generation Rate: Tokens produced per second per GPU
Kubernetes Metrics:
- Pod Autoscaling Events: HPA scaling decisions and timing
- Node Resource Pressure: CPU, memory, and GPU pressure on nodes
- Network Throughput: Inter-pod communication for disaggregated serving
Performance Optimization Indicators:
- Batch Size Utilization: How well requests are batched for efficiency
- Context Length Distribution: Understanding of typical request patterns
- Failed Request Rate: Error rates and their causes
These metrics help you:
- Optimize Performance: Identify bottlenecks in prefill vs decode stages
- Right-Size Resources: Balance cost and performance based on actual usage
- Troubleshoot Issues: Quickly identify problems with specific components
- Plan Capacity: Predict future resource needs based on traffic patterns
What are the Common Issues and Solutions?
Setup Script Stops After GPU Node Pool Creation
Symptoms: Script terminates after “GPU node pool created successfully” Cause: DigitalOcean API response delays during node provisioning (this is normal!) Solution:
# Wait 30 seconds, then re-run the script
./setup-gpu-cluster.sh

# The script will automatically continue from where it left off
# No duplicate resources will be created
GPU Pod Scheduling Issues
Symptoms: Pods stuck in Pending state
Solution: Check GPU node availability and resource requests
kubectl describe pods -n llm-d | grep -A 5 "Events:"
Model Download Failures
Symptoms: Pods showing download errors Solution: Verify HF_TOKEN is set correctly
kubectl logs -n llm-d -l app=decode
Service Connectivity Issues
Symptoms: API requests failing Solution: Check all pods are running and services are available
kubectl get pods -n llm-d
kubectl get svc -n llm-d
Dashboard Not Appearing in Grafana
Symptoms: llm-d dashboard not visible in Grafana after running monitoring setup Solution: Check dashboard ConfigMap and Grafana sidecar
# Check if dashboard ConfigMap exists
kubectl get configmap llm-d-dashboard -n llm-d-monitoring

# Check ConfigMap labels
kubectl get configmap llm-d-dashboard -n llm-d-monitoring -o yaml | grep grafana_dashboard

# If missing, re-run monitoring setup
cd monitoring && ./setup-monitoring.sh
Next Steps
Congratulations! You now have a working llm-d deployment on DigitalOcean Kubernetes. Your deployment includes:
- DOKS Cluster: With CPU and GPU nodes properly configured
- llm-d Services: Prefill, decode, gateway, and Redis running
- GPU Support: NVIDIA Device Plugin configured for GPU scheduling
- Working API: Tested and confirmed LLM inference capability
What You Can Do Next
- Scale Your Deployment: Add more GPU nodes or increase pod replicas
- Deploy Different Models: Use different model configurations
- Monitor Performance: Use Grafana dashboards to track metrics
- Integrate with Applications: Use the OpenAI-compatible API in your applications
Cleanup (Optional)
When you’re done experimenting, you have two cleanup options:
Option 1: Remove Only llm-d Components (Keep Cluster)
If you want to keep your DOKS cluster but remove llm-d components:
# Navigate back to the deployment directory
cd /path/to/llm-d-deployer/quickstart/infra/doks-digitalocean

# Remove llm-d components using the uninstall flag
./deploy-llm-d.sh -u

# Optionally remove monitoring (if installed)
# kubectl delete namespace llm-d-monitoring
This will:
- Remove all llm-d pods and services
- Delete the llm-d namespace
- Keep monitoring components (if installed separately)
- Keep your DOKS cluster and GPU nodes intact for future use
Option 2: Delete Entire Cluster
If you want to remove everything including the cluster:
# Delete the cluster (this will remove all resources)
doctl kubernetes cluster delete llm-d-cluster
Tip: Use Option 1 if you plan to experiment with different llm-d configurations or other Kubernetes workloads on the same cluster. Use Option 2 for complete cleanup when you’re finished with all experiments.
Conclusion
By following this tutorial, you have learned how to deploy llm-d—a powerful, distributed LLM inference framework—on DigitalOcean Kubernetes (DOKS) with GPU support. You set up a production-ready cluster, configured GPU resources, deployed llm-d components, and validated distributed LLM inference using an OpenAI-compatible API. This approach enables you to efficiently serve large language models at scale, optimize GPU utilization, and build robust, scalable AI services on a cloud-native platform.
With your deployment in place, you can now scale resources, experiment with different models, monitor performance, and integrate LLM inference into your own applications. Whether you are building real-time generative AI products or supporting large-scale inference workloads, llm-d on DOKS provides a flexible and cost-effective foundation.
Resources
- How to Deploy NVIDIA Dynamo for LLM Inference
- llm-d Documentation: Official llm-d Docs
- DigitalOcean Kubernetes: DOKS Documentation
- GPU Droplet Pricing: DigitalOcean GPU Pricing
- LLM Inference Optimization
- Getting Started with Llama
Happy deploying with llm-d on Kubernetes!
Thanks for learning with the DigitalOcean Community. Check out our offerings for compute, storage, networking, and managed databases.
About the author(s)
I’m a Senior Solutions Architect in Munich with a background in DevOps, Cloud, Kubernetes and GenAI. I help bridge the gap for those new to the cloud and build lasting relationships. Curious about cloud or SaaS? Let’s connect over a virtual coffee! ☕
Anish is a Sr Technical Content Strategist and Team Lead at DigitalOcean with 7+ years of experience as an DevOps SRE at Nutanix and Cloud consultant at AMEX, and technical writing at DOCN, and shipping deep infra and AI inference tutorials that help developers deploy production‑ready applications on DigitalOcean.
Still looking for an answer?
 This work is licensed under a Creative Commons Attribution-NonCommercial- ShareAlike 4.0 International License.
Become a contributor for community
Get paid to write technical tutorials and select a tech-focused charity to receive a matching donation.

DigitalOcean Documentation
Full documentation for every DigitalOcean product.

Resources for startups and AI-native businesses
The Wave has everything you need to know about building a business, from raising funding to marketing your product.
The developer cloud
Scale up as you grow — whether you're running one virtual machine or ten thousand.

Start building today
From GPU-powered inference and Kubernetes to managed databases and storage, get everything you need to build, scale, and deploy intelligent applications.
