By Vadym Kalsin and Brian Hogan

Introduction
Zabbix is a great monitoring tool that collects data from servers, virtual machines, and other kinds of network devices so you can analyze it for trends or problems. It has feature-rich notifications on emerging issues, but the built-in tools for data analysis and visualization are not easy to use. You can combine graphs into dashboards, but first you need to create them, and there is practically no easy way to create graphs that display real-time data. Also,to there is no way to collect data from different hosts onto a single graph. While the situation is getting better with each new release, it is far from ideal.
Grafana is a good alternative to Zabbix’s dashboards. It lets you create graphs and dashboards based on data from various monitoring systems, and it specializes in the display and analysis of this data. It is lightweight, easy to install, and it looks beautiful.
In this tutorial, you’ll install Grafana and configure it to display data from Zabbix, and you’ll learn how to compose your own custom dashboard that monitors CPU and file usage.
Prerequisites
To follow this tutorial, you will need:
- Two CentOS 7 servers configured with sudo non-root users, with Zabbix installed on one server, and the Zabbix client installed on the other server. Follow the tutorial How To Install and Configure Zabbix to Securely Monitor Remote Servers on CentOS 7 and its prerequisites to configure these servers.
Step 1 — Installing Grafana
Before we can use Grafana, we need to install it. We’ll use the same server we used for the Zabbix server. Log in to your Zabbix server with your non-root user:
- ssh sammy@your_zabbix_server_ip_address
Grafana isn’t available through the package manager by default, so we will set up the repository configuration file. First, create a new repository file for Grafana:
- sudo vi /etc/yum.repos.d/grafana.repo
Paste the following configuration data into the file:
[grafana]
name=grafana
baseurl=https://packagecloud.io/grafana/stable/el/6/$basearch
repo_gpgcheck=1
enabled=1
gpgcheck=1
gpgkey=https://packagecloud.io/gpg.key https://grafanarel.s3.amazonaws.com/RPM-GPG-KEY-grafana
sslverify=1
sslcacert=/etc/pki/tls/certs/ca-bundle.crt
Then save and exit the text editor and run the following command to install Grafana:
- sudo yum install grafana
During the installation process you will be asked to import a GPG key. Confirm that you wish to import this key so the installation can continue.
Once the installation completes, start the Grafana service:
- sudo systemctl daemon-reload
- sudo systemctl start grafana-server
Then check whether the Grafana service is running properly:
- sudo systemctl status grafana-server
You will see the following status:
Output● grafana-server.service - Starts and stops a single grafana instance on this system
   Loaded: loaded (/usr/lib/systemd/system/grafana-server.service; enabled; vendor preset: disabled)
   Active: active (running) since Mon 2016-11-07 06:18:27 UTC; 1 day 4h ago
     Docs: http://docs.grafana.org
 Main PID: 16639 (grafana-server)
  ...
Finally, enable the service to start at boot time:
- sudo systemctl enable grafana-server
Grafana is running, so let’s install the component that lets Grafana pull data from Zabbix.
Step 2 — Installing the Zabbix Plugin for Grafana
You can extend Grafana’s functionality by installing plugins. You can explore the available plugins here. There are three types of plugins:
- Panels: new blocks that can be used on the dashboard, such as pie charts or histograms.
- Data sources: new storage backends for your time series data, so you can pull data from other sources.
- Apps: complex plugins that bundle data sources and panels within a single package.
We will use the Zabbix app plugin, which includes a Zabbix data source, a triggers panel, a Zabbix server dashboard, and a template to view data.
The easiest way to install plugins is by using the CLI tool grafana-cli which is bundled with Grafana. Run the following command to install the Zabbix App plugin:
- sudo grafana-cli plugins install alexanderzobnin-zabbix-app
You will see the following output, indicating that the plugin was installed:
Output✔ Installed alexanderzobnin-zabbix-app successfully
Whenever you add or modify plugins, you must restart grafana-server for the changes to take effect.
- sudo systemctl restart grafana-server
With the plugin installed, you can log in to Grafana and configure it to talk to Zabbix.
Step 3 — Configuring the Zabbix Plugin
Log in to the Grafana web interface by navigating to the address http://your_zabbix_server_ip_address:3000.
Note: Grafana listens for incoming connections on port 3000. If you have a firewall configured, you’ll need to open this port. Review this tutorial to learn about the firewall in CentOS if you run into issues.
The default login credentials are admin/admin. You can change your password on the Profile page once you log in. When you log in, you’ll be greeted by the Home dashboard.
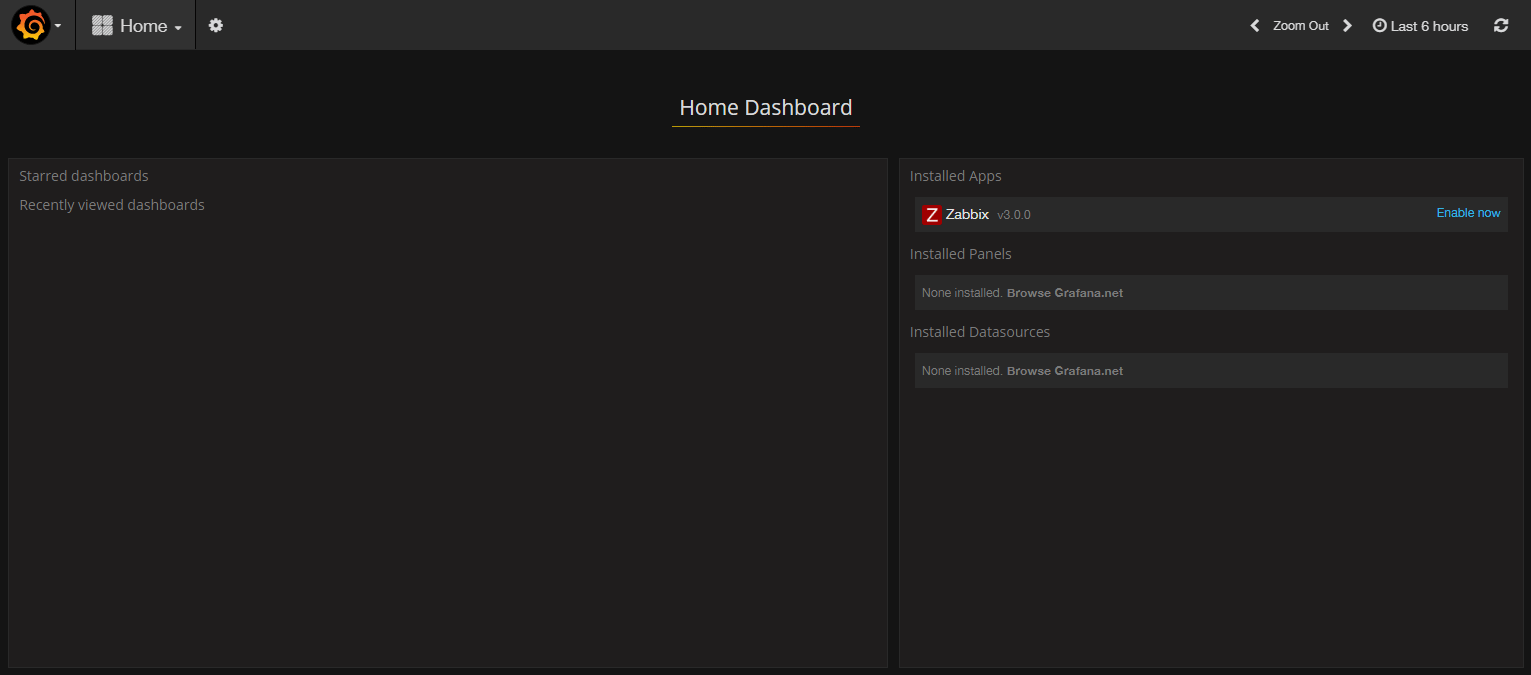
Access Grafana’s main menu by clicking on the Grafana logo in the top left corner of the user interface. Then select Plugins. Then select the Apps tab. Then click on the Zabbix app and enable it by pressing the Enable button.
Now you can add a new data source. Select the Grafana logo again and navigate to Data sources. Then click the Add data source button. You will see the configuration page for the data source:
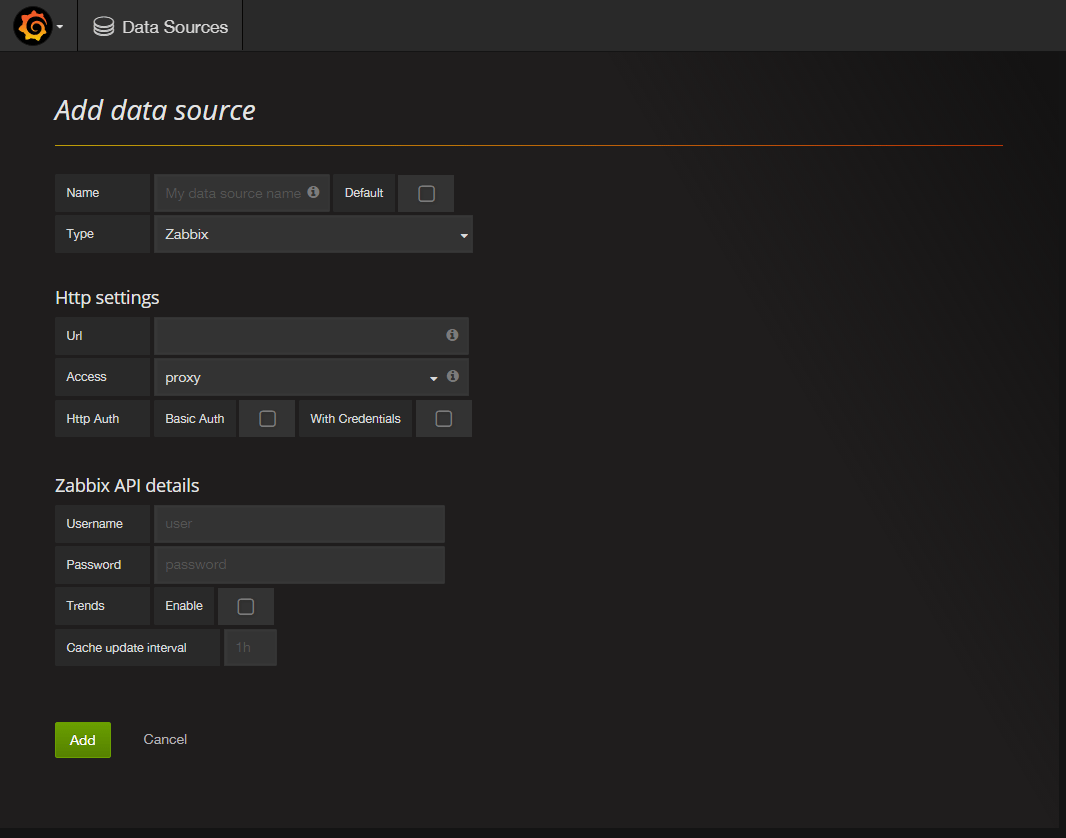
Configure the data source as follows:
- Enter a name for this new data source in the Name field.
- Check the Default option so this data source will be preselected in new panels you create.
- Select Zabbix from the Type drop down list.
- Fill in the Url field with the full path to the Zabbix API, which will be
http://your_zabbix_server_ip_address/zabbix/api_jsonrpc.php. - Fill in the Username and Password fields with the username and password for Zabbix. The default username is
adminand the default password iszabbix. - Enable the Trends option; it will increase Grafana’s performance when displaying long time periods.
You can leave the other options at their default values.
Click the Add button to test and save the configuration. You’ll see a success message that looks like the following:
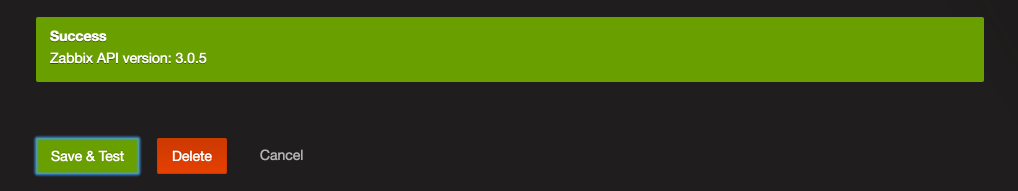
If you do not see this message, check your credentials and test again.
Now let’s look at the Zabbix dashboard that came with the plugin. Select Zabbix server Dashboard from the dropdown list at the top of the screen. When you select it, the dashboard displays information about your Zabbix server:

This dashboard is pretty informative, but you can create your own custom dashboard from scratch.
Step 4 — Creating a Custom Zabbix Dashboard
Let’s create a dashboard for Zabbix that shows us CPU usage and file system information in real-time.
Open the drop-down list on the top of the screen and click the Create New button. A new empty dashboard will be created.
Each dashboard consists of rows which contain blocks. When you create a new dashboard, you automatically get one row. Click on the green menu on the left of the row to access the row’s action menu. Here you can add new panels, set the row’s height, move it, collapse it, or delete it.
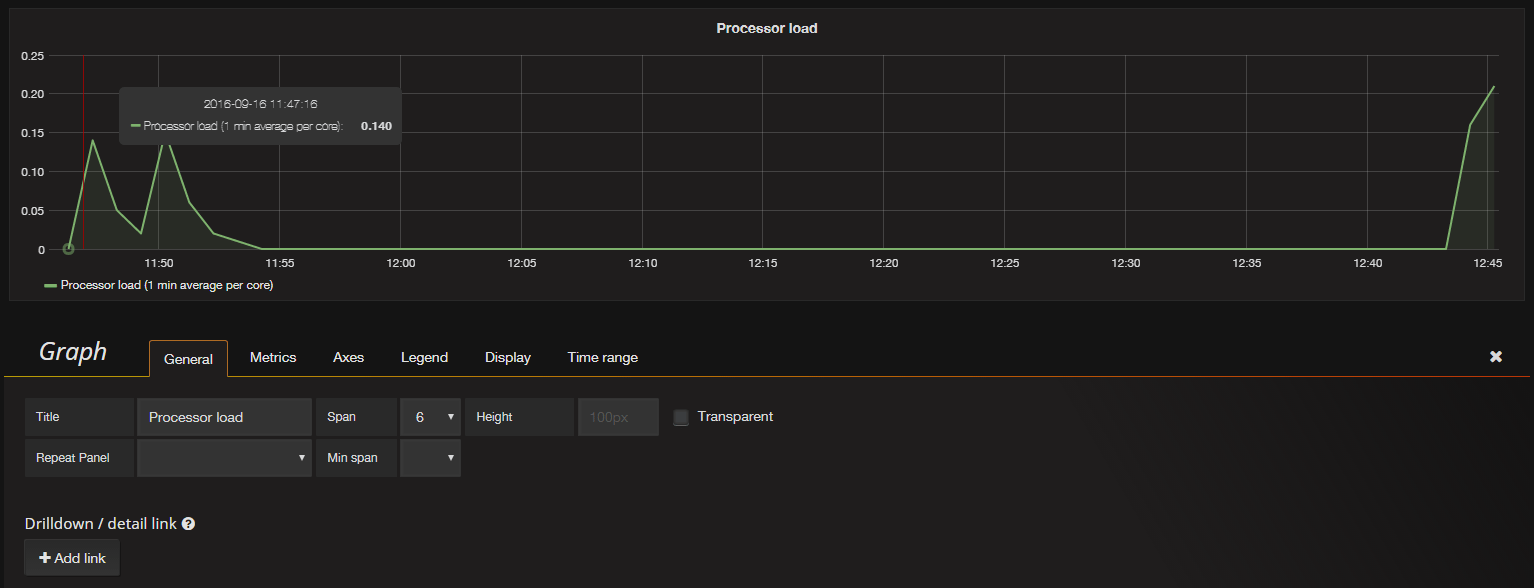
First we will create a graph that displays the CPU usage of our Zabbix server. Select the Add Panel item and then click Graph to insert a new graph into the row.
You’ll be greeted with a form with several tabs, with the Metrics tab selected. Since we’ve set our Zabbix data source as the default, a new query was added for you. You just have to specify the following options:
- Set Host Group to
Zabbix servers. - Set Host to
Zabbix server. - Set Application to
CPU. - Set Item to
Processor load (1 min average per core).
You will see you current processor load on the graph.
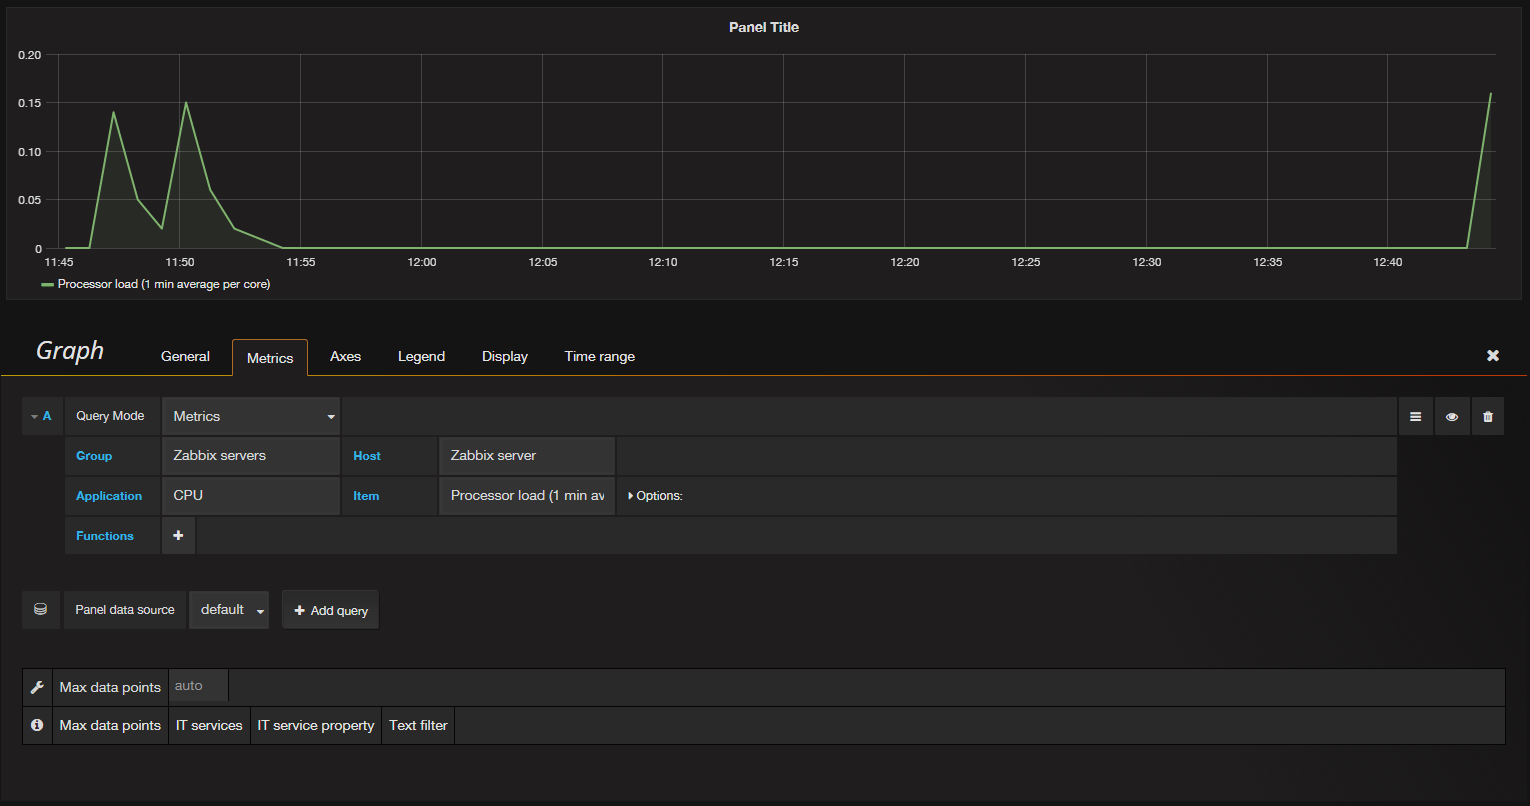
Then navigate to the General tab and set the Title field to Processor load and set the Span option to 6. One row can contain up to 12 blocks, so setting this value to 6 makes the panel take up half of the screen.
Now you can click on Back to dashboard to see the result:
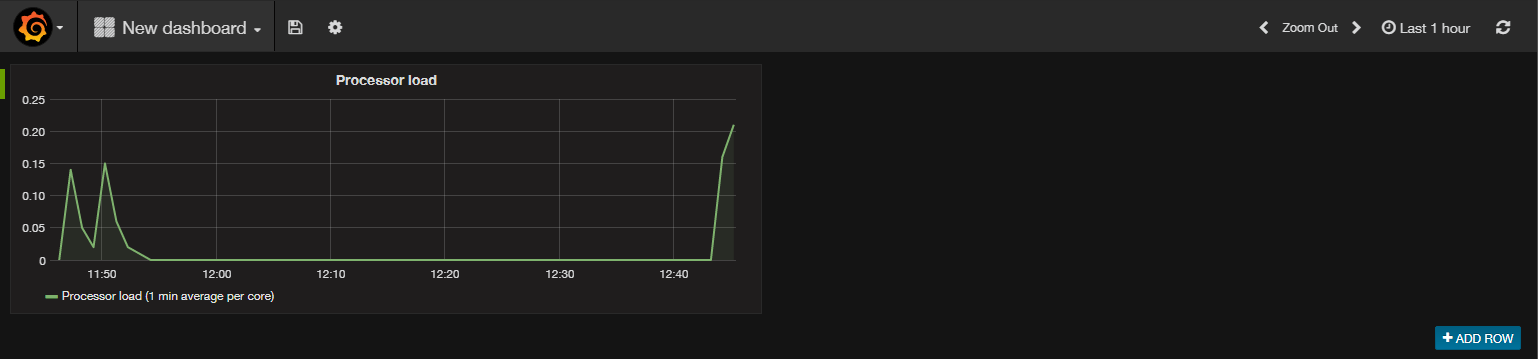
Note: If you don’t see any data, you may be zoomed out too far. Click the clock icon in the upper right of the interface and choose *Last 1 hour from the list of options.
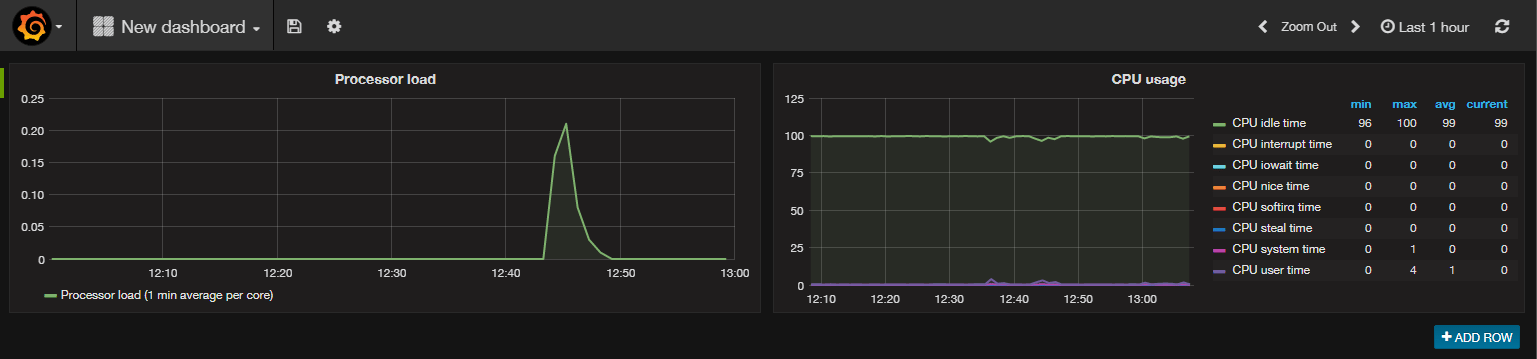
Let’s add another chart. To do this, you can repeat the previous steps or duplicate the existing graph. To duplicate the existing graph, select the panel title and click Duplicate. Then select the new graph’s title and select the Edit option. Then apply the following settings:
- Change Title to
CPU usage. - Select the Metrics tab and change the Item field to
/CPU.*/.
You can use Regular Expression patterns for host or metric names. Just be sure to wrap the pattern in forward slashes (/).
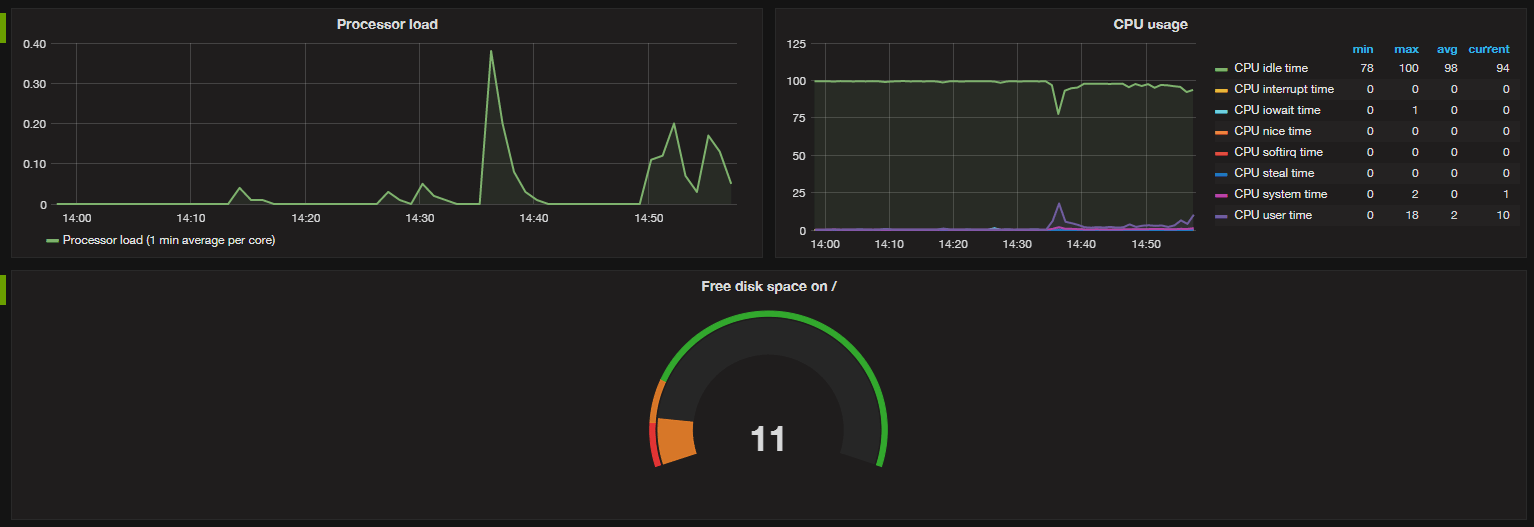
You can also show summary statistics. Select the Legend tab and you’ll see some options and values you can select.
- Under Options, check As table and To The right.
- Under Values, select Min, Max, Avg, and Current.
Now click Back to dashboard to see the result, which will look like this:
Next, add a Singlestat panel to show a single value for a particular metric. Create a new row by clicking Add row button and then select the row’s menu, choose Add panel, and select the Singlestat item.
Set the Metrics options as follows:
- Set Host Group to
Zabbix servers. - Set Host to
Zabbix server. - Set Application to
Filesystems. - Set Item to
Free disk space on / (percentage).
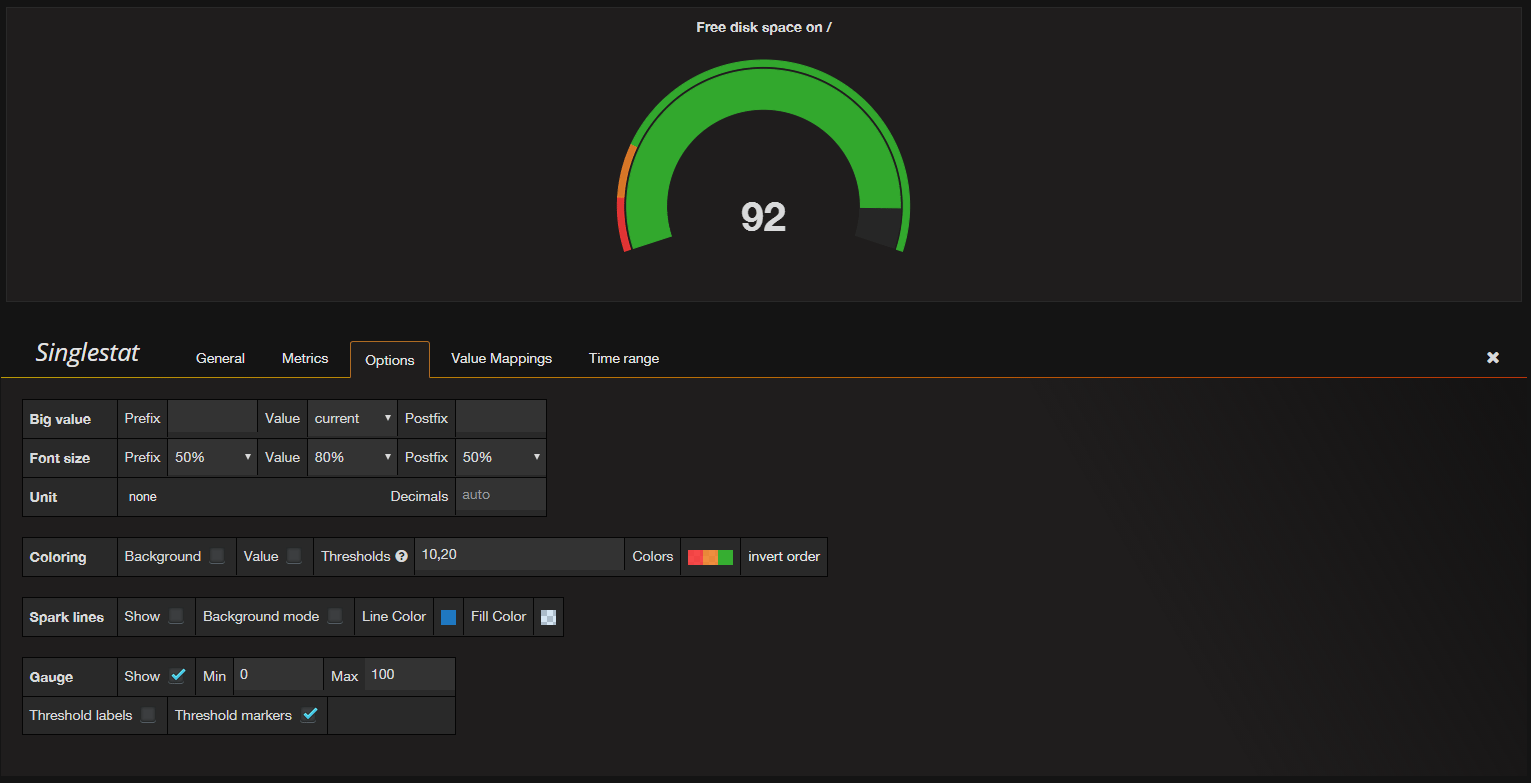
Next, switch to the General tab and set the Title field to Free disk space on /.
Then switch to the Options tab and configure these options:
- Enable the
Showoption for Gauge. - Set Thresholds to
10,20. This will display these thresholds on the gauge. - Select the
currentoption from the Value drop-down list.
The gauge now looks like this:
Return to the dashboard and press CTRL+S to save it.
Now let’s test how this gauge responds to real-time events. To do so we will manually reduce free space on the disk and see what the dashboard displays.
Log in to your Zabbix server if you’re not logged in currently:
- ssh sammy@your_zabbix_server_ip_address
Once logged in, determine how much free space is available on the file system. You can do this with the df command:
- df -h
You will see the following output:
OutputFilesystem      Size  Used Avail Use% Mounted on
/dev/vda1        20G  1.5G   18G   8% /
devtmpfs        236M     0  236M   0% /dev
tmpfs           245M     0  245M   0% /dev/shm
tmpfs           245M  8.3M  237M   4% /run
tmpfs           245M     0  245M   0% /sys/fs/cgroup
tmpfs            49M     0   49M   0% /run/user/0
In this case, there’s 18 GB of free space. The amount of free space on your server will vary. Reduce the free space on the root partition below the 20% threshold by using the fallocate command to create one big temporary file:
- fallocate -l 15G /tmp/test.img
Set the file size depending on the amount of free space on your server.
Then give Zabbix a couple of minutes to update its data. Refresh the dashboard and you’ll see that the gauge changed its color to reflect the free space issue:
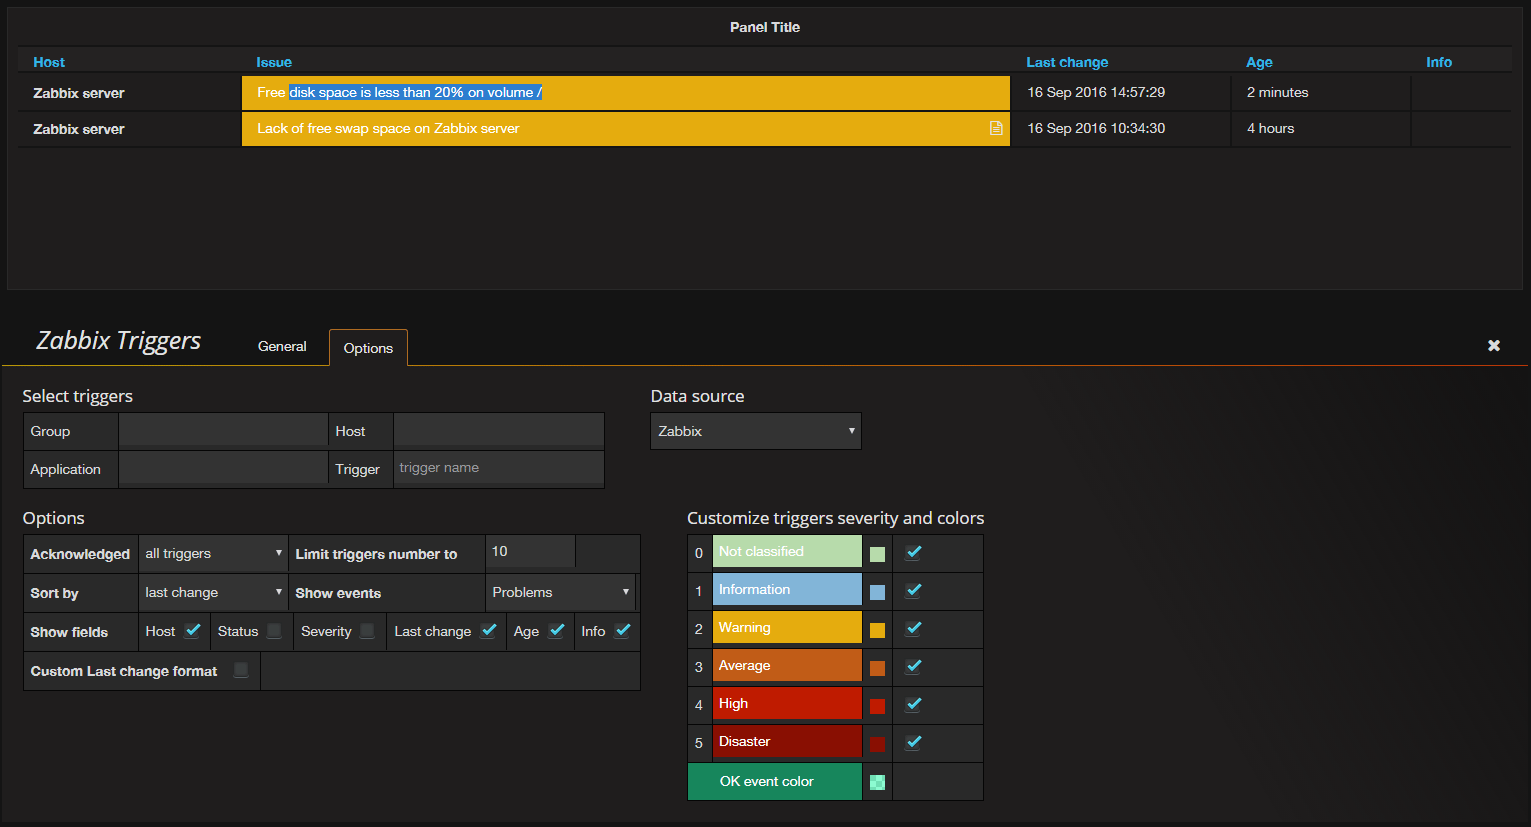
Finally, let’s show active Zabbix triggers on the dashboard. Create a new row and then select the row’s menu, select Add panel, and choose the Zabbix Triggers item.
You will see the active trigger notifying you about the lack of free space on the server.
Select Back to dashboard and save the dashboard with CTRL+S. Your dashboard will now look like this:
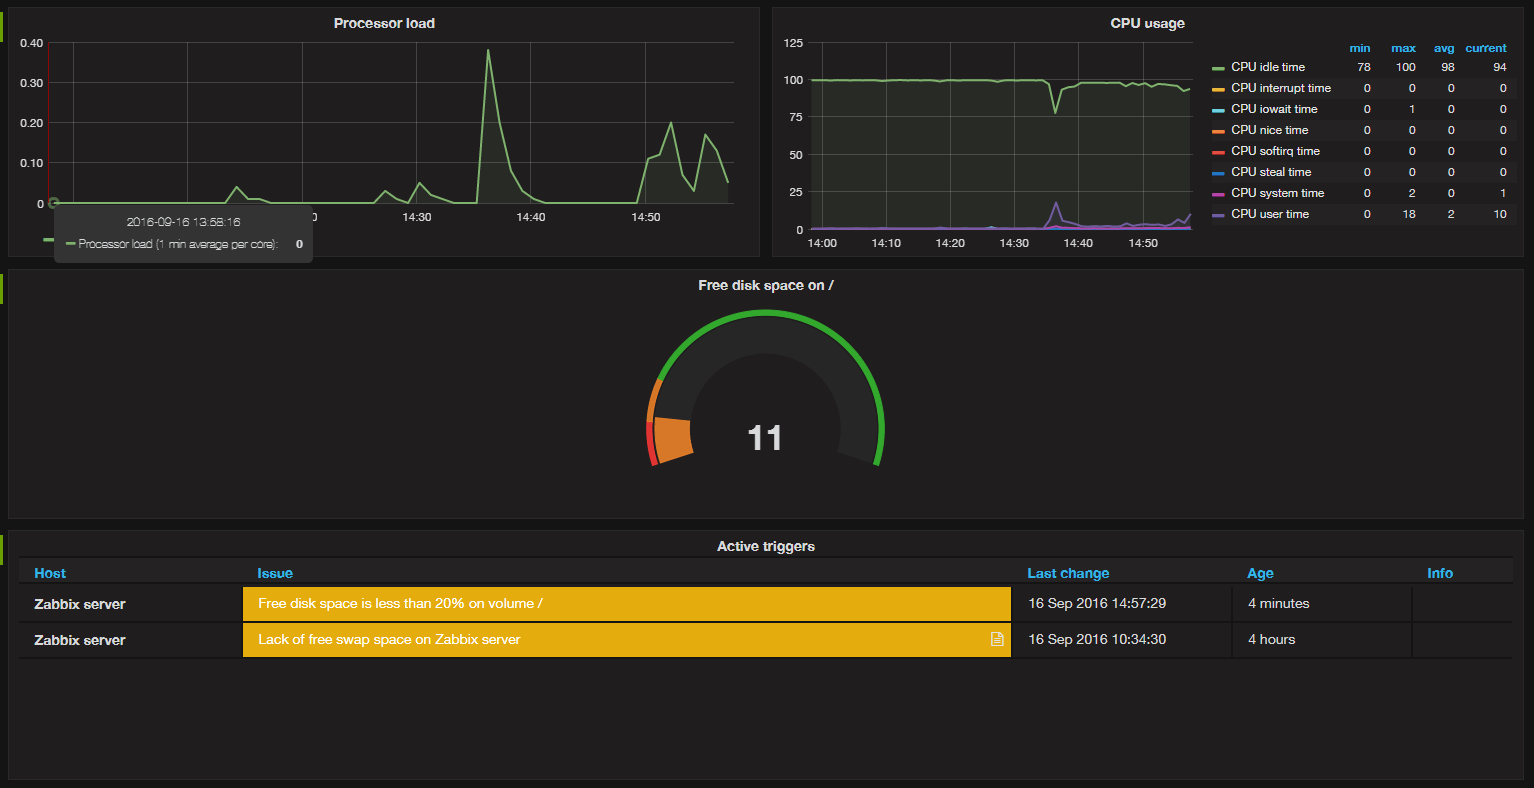
You can now use this simple dashboard to get a quick look at the current state of your server.
Don’t forget to remove the temporary file you created to free up space on your disk. On your Zabbix server, issue the command:
- rm /tmp/test.img
This will remove the test.img file. In a few minutes, the dashboard will update again to reflect the changes on the file system.
Conclusion
In this tutorial, you learned how to install and configure Grafana, and you created a custom dashboard with panels that displayed data from Zabbix. You can show these dashboards on desktops or even large screens to allow administrators to see the state of your IT infrastructure. Each panel on a dashboard can display data from a different server, and you can use Grafana to filter the data in many useful ways. It’s difficult to describe all of Grafana’s features in one tutorial, so explore, experiment, and build your own beautiful dashboards.
Thanks for learning with the DigitalOcean Community. Check out our offerings for compute, storage, networking, and managed databases.
About the author(s)
Monitoring engineer
Managed the Write for DOnations program, wrote and edited community articles, and makes things on the Internet. Expertise in DevOps areas including Linux, Ubuntu, Debian, and more.
Still looking for an answer?
This textbox defaults to using Markdown to format your answer.
You can type !ref in this text area to quickly search our full set of tutorials, documentation & marketplace offerings and insert the link!
Thank you very much for this much needed article. I was able to flawlessly configure Grafana for Zabbix. I will look for you other articles for the same domain.
Why do i get this error when i try to install grafana:
[root@zabbix yum.repos.d]# yum -y install grafana Loaded plugins: fastestmirror Loading mirror speeds from cached hostfile
- base: ftp.sh.cvut.cz
- extras: ftp.sh.cvut.cz
- updates: ftp.sh.cvut.cz base | 3.6 kB 00:00:00 extras | 3.4 kB 00:00:00 grafana/x86_64/signature | 836 B 00:00:00 Retrieving key from https://packagecloud.io/gpg.key Importing GPG key 0xEBFF1218: Userid : “packagecloud ops (production key) ops@packagecloud.io” Fingerprint: 6a03 7bb5 2df7 d46d 99dc 59c1 0166 6247 ebff 1218 From : https://packagecloud.io/gpg.key Retrieving key from https://grafanarel.s3.amazonaws.com/RPM-GPG-KEY-grafana grafana/x86_64/signature | 1.0 kB 00:00:00 !!! https://packagecloud.io/grafana/stable/el/6/x86_64/repodata/repomd.xml: [Errno -1] repomd.xml signature could not be verified for grafana Trying other mirror.
One of the configured repositories failed (grafana), and yum doesn’t have enough cached data to continue. At this point the only safe thing yum can do is fail. There are a few ways to work “fix” this:
 1. Contact the upstream for the repository and get them to fix the problem.

 2. Reconfigure the baseurl/etc. for the repository, to point to a working
    upstream. This is most often useful if you are using a newer
    distribution release than is supported by the repository (and the
    packages for the previous distribution release still work).

 3. Run the command with the repository temporarily disabled
        yum --disablerepo=grafana ...

 4. Disable the repository permanently, so yum won't use it by default. Yum
    will then just ignore the repository until you permanently enable it
    again or use --enablerepo for temporary usage:

        yum-config-manager --disable grafana
    or
        subscription-manager repos --disable=grafana

 5. Configure the failing repository to be skipped, if it is unavailable.
    Note that yum will try to contact the repo. when it runs most commands,
    so will have to try and fail each time (and thus. yum will be be much
    slower). If it is a very temporary problem though, this is often a nice
    compromise:

        yum-config-manager --save --setopt=grafana.skip_if_unavailable=true
failure: repodata/repomd.xml from grafana: [Errno 256] No more mirrors to try. https://packagecloud.io/grafana/stable/el/6/x86_64/repodata/repomd.xml: [Errno -1] repomd.xml signature could not be verified for grafana [root@zabbix yum.repos.d]# cat /etc/yum.repos.d/grafana.repo [grafana] name=grafana baseurl=https://packagecloud.io/grafana/stable/el/6/$basearch repo_gpgcheck=1 enabled=1 gpgcheck=1 gpgkey=https://packagecloud.io/gpg.key https://grafanarel.s3.amazonaws.com/RPM-GPG-KEY-grafana sslverify=1 sslcacert=/etc/pki/tls/certs/ca-bundle.crt
Any ideas are much apreciated
 This work is licensed under a Creative Commons Attribution-NonCommercial- ShareAlike 4.0 International License.
Become a contributor for community
Get paid to write technical tutorials and select a tech-focused charity to receive a matching donation.

DigitalOcean Documentation
Full documentation for every DigitalOcean product.

Resources for startups and AI-native businesses
The Wave has everything you need to know about building a business, from raising funding to marketing your product.
The developer cloud
Scale up as you grow — whether you're running one virtual machine or ten thousand.

Start building today
From GPU-powered inference and Kubernetes to managed databases and storage, get everything you need to build, scale, and deploy intelligent applications.
