By Scarlz and Sharon Campbell

Introduction
GoAccess allows you to monitor web server logs in real time, using a simple command-line dashboard, in order to quickly view and analyze traffic metrics. It runs entirely in a terminal with statistics organized into separate panels on one scrollable dashboard. It is also possible to use GoAccess to generate HTML, JSON, and CSV web traffic reports.
This tutorial shows how to install the software from source, and then demonstrates how to use, view, and navigate the program on the command line.
GoAccess will work with log files from almost any other web server. However, the log file’s specific formatting must be defined in GoAccess for it to function properly.
This guide will focus on using Apache as the chosen web server, with or without virtual hosts configured.
Prerequisites
Please complete these prerequisites before starting this tutorial.
-
VPS with Debian 7 as its operating system
-
User account on the VPS with sudo elevation privileges.
-
Apache web server installed with active or previously active HTTP traffic
The more web traffic the VPS handles the more data GoAccess has to work with – more is better in this case.
Step 1 — Update System Packages
To begin, ssh into your server as a user that has sudo elevation privileges. Then follow the steps below.
ssh sammy@your_server_ip
This command updates the apt-get package manager’s database.
sudo apt-get update
Step 2 — Upgrade System Packages
Install any new updates to the Debian system packages.
sudo apt-get upgrade
Confirm when prompted about updating new packages by entering y for yes.
Step 3 — Install the build-essential Package
The build essential package provides several very important subsidiary packages such as make that are required to compile software in Debian and Linux. These are a necessity for the installation stages of GoAccess later on in the guide.
Here is how to install the package using apt-get:
sudo apt-get install build-essential
Step 4 — Install GoAccess Dependencies
Here are the dependencies needed to install and use GoAccess on your VPS. Acquire them using the apt-get package manager.
sudo apt-get install libncursesw5-dev libglib2.0-dev libgeoip-dev libtokyocabinet-dev
Step 5 — Set Up the Build Directory
Now that we have the necessary system packages in place, we can obtain and build GoAccess.
The /usr/local/src directory is a suitable place to build the GoAccess software. Give your current Debian user account ownership of this directory by running:
sudo chown $USER /usr/local/src
Then give the directory read, write, and execute permissions for this same user via the command:
sudo chmod u+rwx /usr/local/src
Change to this directory with the cd command:
cd /usr/local/src
Step 6 — Download and Extract GoAccess Source Code
GoAccess is in release version 0.8.5 for its stable build at the time of writing. To download it, use the wget command below.
wget http://tar.goaccess.io/goaccess-0.8.5.tar.gz
Now the tar command can be used to extract and unpack the downloaded .tar.gz file and its contents.
tar -zxvf goaccess-0.8.5.tar.gz
##Step 7 — Compile and Install the Source Code
Change into the newly unpacked directory like so.
cd goaccess-0.8.5/
Run the configure script found inside this directory with the two prefixes shown in the next command:
./configure —enable-geoip —enable-utf8
Use the make command to build the makefile required for installing GoAccess.
make
The following command will install GoAccess (using the previously created makefile) to system directories, making it executable via Debian.
sudo make install
Step 8 — Edit the GoAccess Config File
There are several lines commented out in GoAccess’s main configuration file that we need to uncomment in order to use some advanced features of the program later on in the tutorial.
We’ll edit the file using the vi text editor in the following way:
sudo vi /usr/local/etc/goaccess.conf
A comment in this configuration is denoted by a # and means the server will ignore the subsequent information on the same line after it. In this file we need to remove a total of two # symbols to uncomment two lines.
The first is the date-format setting and it appears here like this.
# Apache log date format. The following date format works with any
# of the Apache's log formats below.
#
#date-format %d/%b/%Y
To remove the comment symbol (#) press j multiple times to drop your cursor down to the line we want to edit, which is the date-format %d/%b/%Yline. Once it reaches the line and is selecting the # press x to delete and remove it.
If done correctly your amendment should now look like this:
# Apache log date format. The following date format works with any
# of the Apache's log formats below.
#
date-format %d/%b/%Y
Note: You can press
ESCand type:q, thenENTERto quit the file without saving your changes, if you think you have made any mistakes or accidental alterations.
The second line that needs to be uncommented is one of the log-format lines, and the exact line depends your Apache setup. Choose the first option if you are running just one Apache host, and the second if you have virtual hosts set up. If you’re not sure, you should probably follow the “Non-Virtual Hosts Setup” section.
Warning: Uncomment only one of these lines.
For Non-Virtual Host Setups
For a setup without virtual hosts, remove the following line’s hash (#) symbol in the same way as before.
# NCSA Combined Log Format
#
log-format %h %^[%d:%^] "%r" %s %b "%R" "%u"
#
For Virtual Host Setups
For a setup with virtual hosts, remove the following line’s hash (#) symbol in the same way as before.
# NCSA Combined Log Format with Virtual Host
#
log-format %^:%^ %h %^[%d:%^] "%r" %s %b "%R" "%u"
#
After uncommenting one of the log-format lines, press ESC. Then type :wq and press ENTER. This will write the changes we have made to the file and quit the vi text editor.
We can now run GoAccess on any plain-text Apache log files that meet the supported formatting criteria.
Step 9 — Add Your User to the “adm” Group
Let’s add our current user to the administrator group (adm) in Debian so we can run these commands without needing the sudo prefix for root user permissions.
usermod can change our user’s properties by including the -g argument and the group name we wish to add to (adm), followed by the user in question (in this case sammy). Make sure to replace sammy in the next command with your own Linux username.
sudo usermod -g adm sammy
After running the above command, disconnect from your VPS by typing exit and then ENTER. Then log back in to the VPS with your sudo user. This is so the changes we made earlier to the user with usermod take effect.
exit
ssh sammy@your_server_ip
You should now have the correct permissions to run GoAccess as this user without using sudo, and also have access to the Apache logs directory.
Now we’ll locate the logs directory.
Step 10 — Locate the Log Files
Web servers in general record all incoming and processed HTTP requests to log files.
We need to find where Apache stores its logs so we can make use of them. By default, on Debian systems Apache log files are stored in:
/var/log/apache2
To see the contents of this directory you can make use of the list command like so:
ls /var/log/apache2
Here you will find the log files described previously, some of which are compressed into .gz files if your server has been running long enough. The most recent one that is currently being written to and handled by the web server is the one that is uncompressed named access.log.
For a setup with virtual hosts configured, you may have to cd into sub-directories from within /apache2 to locate each individual host’s log files.
If you have found the log files here, then move on to the next step (Step 11).
Further Searching
You only need to read this further information if you are having trouble locating your log files.
The location of these access logs are controlled by the CustomLog directive in Apache’s config. If you altered this setting, you may find your your Apache access logs in a different directory.
To find the CustomLog directive and what it is set to, you can use grep on one of the Apache config files, as shown in the next command.
This will output any custom directories added in the apache2.conf file.
grep CustomLog /etc/apache2/apache2.conf
Alternatively you can run this command, which may take a while if you have a lot of files on your server:
sudo find / -name access.log
This will show all files on the system named access.log.
##Step 11 — Run GoAccess
Once the directory with your Apache server log files is located, you can run GoAccess on them with the next command. In this command, make sure to replace /var/log/apache2/access.log with your own log file directory path, if it is different from the standard Apache one.
goaccess -f /var/log/apache2/access.log -a
Once you run this command, you’ll see the GoAccess dashboard.
The -f argument tells the program to use the supplied directory path, and the -a argument enables all recorded statistics for each host agent parsed.
Optional: Extract Archived Logs
If you want to run GoAccess on older logs — the compressed .gz type files — they must be extracted and unpacked. The program will not run on these compressed files with the command shown above.
You can do this extracting with the gunzip program in Debian if desired.
For example:
sudo gunzip /var/log/apache2/access.log.10.gz
The access.log.10.gz file name at the end of the command here will need to match the compressed file name you want to extract.
Step 12 — Navigate GoAccess
This is the GoAccess dashboard.

Here’s how to interact with the dashboard:
-
Pressing
F1orhwill bring up a small help window, listing the keys and their functions found here in this section, as well as provide some other helpful information. -
0-9orSHIFT + 0-9selects the respectively numbered module and sets it to active. The corresponding numbers can be seen on the dashboard for each section. -
oorENTERis used for expanding the currently selected module on the dashboard. Modules are explained in the next section. -
jwill scroll down within an expanded active module, andkwill scroll back up within an expanded active module. -
sshows the sort options available for the active module. -
Finally, pressing
qwill quit the program or current window, or collapse an active module, depending upon your current level of depth in the dashboard.
More interaction can be achieved through the following keys:
-
Pressing the
TABkey on your keyboard will move forward through the modules in order. -
Pressing
SHIFT+TABtogether will do the opposite of the last action, and iterate backward through the modules. -
F5can be pressed to refresh and redraw the dashboard. -
cwhen pressed sets and alters the current color scheme in use on the Dashboard. -
gmoves the focus onto the first item and back to the top of the dashboard screen. -
Gscrolls to the last item or bottom of the dashboard screen.
Step 13 — Understand Modules
Now that you can move around the interface, let’s take a look at what each module actually contains. The sections here correspond to the numbered modules and titles in the program. All “Hit” values displayed are based on the total amount of requests found in the supplied log file or files respectively (unless stated otherwise).
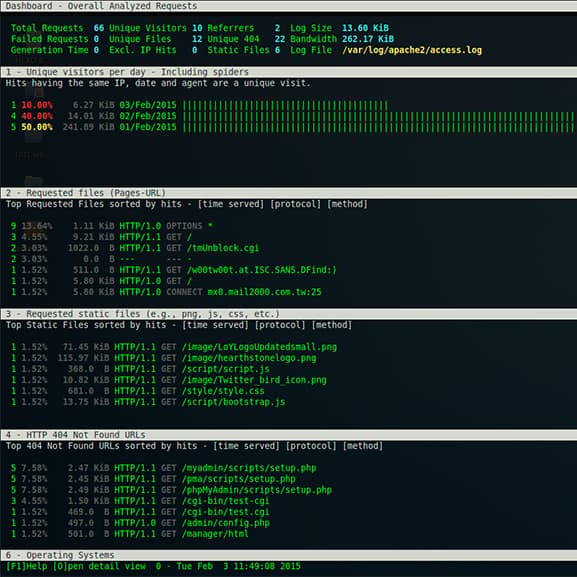
Dashboard — Overall Analyzed Requests
The dashboard shows the number of: valid requests, invalid requests, time taken to analyze the data provided, unique visitors to the server, uniquely requested files, unique static files (usually images file types), unique HTTP referrers (URLs), unique 404 not found errors, the size of the parsed log file, and lastly any bandwidth consumed.
1 — Unique Visitors
This module is listed by day with dates included. HTTP requests possessing the same IP, the same date, and the same agent are considered as a unique visit. This includes web crawlers/spiders.
2 — Requested Files
Requested Files shows the most highly requested files on your web server, and displays said hits as a number, and percentage, along with the time the host was served for (bandwidth), what protocol was used, and what request type was used.
3 — Requested Static Files
Includes only static files requested most frequently such as: jpg, css, swf, js, gif, and png file types, with the same metrics as the last module provided for each occurrence.
4 — HTTP 404 URLs
Ranked like previous modules with the same statistics, this module lists the top recurrent HTTP 404: Not Found Error requests, and the URL that is being requested.
5 — Hosts
Hosts has more detailed information on the hosts themselves that connect to your web server, such as number of connections, their global IP addresses, and some of the same repeated metrics types.
The expanded module here can display even more information like a host’s reverse DNS lookup result, and country of origin, if the -a argument from earlier is enabled. A list of user agents can displayed through selecting the desired IP address, and then pressing ENTER.
6 — Operating Systems
Here the host’s operating system is shown, and OS usage is ranked. This is based on unique visits, unlike most of the other module data.
7 — Browsers
The Browser module follows the same concept as the last module, except in this case the host’s browser type used to connect a session is ranked instead. Again, this is based on unique visitors, and not total requests overall.
8 — Referrer URLs
If the host in question accessed the site via another resource, or was linked/diverted to you from another host, the URL they were referred from will be provided here in this module.
9 — Referring Sites
This module is nearly identical the the last one (Referrer URLs); the only difference being that the general site address is displayed, and not the exact point of origin for a referral.
10 — Keyphrases
Reports key words used on Google search, Google cache, and Google translate that have lead to your web server handling a host. At present this only supports Google and no other search engines.
11 — Geo Location
This module contains a summary of geographical locations ascertained from visiting host IP addresses. If it’s unable to determine the this, it will be marked as location unknown.
12 — HTTP Status Codes
HTTP Status Codes contains statistics on the the values of overall status codes in HTTP requests, given as an amount and percentage.
(Optional) Further GoAccess Usage
Move to your user’s home directory with cd and ~ to continue through these extra commands. The secondary pwd command prints your current working directory, so you can confirm you have changed over to it correctly.
cd ~
pwd
HTML Reports
It’s possible to generate an HTML report by redirecting (>) the standard output of GoAccess to an HTML file of any name you choose.
In this example the file is named report.html and includes all (-a) statistics available from the chosen log file.
goaccess -f /var/log/apache2/access.log -a > report.html
The newly generated html file is created inside our user’s home directory.
JSON Reports
You can create a JSON type report by adding the -o and json arguments to the command. Here the output file has the .json extension.
goaccess -f /var/log/apache2/access.log -a -o json > report.json
CSV Reports
To generate a CSV file, follow the same method as before; just append the csv argument to the command, and change the file extension to .csv
goaccess -f /var/log/apache2/access.log -a -o csv > report.csv
Running Compressed Files
To get compressed files to run through GoAccess you can pipe the output of the zcat command to the goaccess command. The next command shows all compressed .gz files being read in without manually extracting them first.
zcat /var/log/apache2/access.log.*.gz | goaccess -a
Filtering by Start Date
To filter from a specified starting date, you can use the structure of the next command. This will ensure parsing of HTTP requests from the 20th of January, 2015 until the end of the log file contents.
sed '/20\/Jan\/2015/,$ p' /var/log/apache2/access.log | goaccess -a
Be aware this will only work if the date you are inputting is actually contained within the passed log file.
Filtering on Days
You can single out a specific date, and filter to show the traffic on just that day. This time we’ll use grep to do so.
grep '20/Jan/2015' /var/log/apache2/access.log | goaccess -a
Excluding Hosts
Exclude a specific IP address with this command, replacing 111.111.111.111 with the desired IP address.
goaccess —exclude-ip=111.111.111.111 -f /var/log/apache2/access.log -a
Remote Use
If GoAccess is installed on a remote machine, such as your local workstation, instead of VPS, it is possible to SSH to your VPS and then read the Apache log files remotely, through piping.
ssh sammy@your_server_ip 'cat /var/log/apache2/access.log' | goaccess -a
Conclusion
After completing this guide, you should know how to install GoAccess, make use of its core functionality, and be able to use several other features that make GoAccess more flexible to work with.
Here is a full recap of what has been covered:
- Obtaining and updating the necessary Debian system packages.
- Installing and building GoAccess with its source code.
- Running GoAccess with Apache web server log files.
- Interacting and navigating through GoAccess on the command line.
- Understanding modules in the GoAccess dashboard.
- Creating different report types from Apache web server logs with redirection.
- Piping other command outputs into GoAccess.
Thanks for learning with the DigitalOcean Community. Check out our offerings for compute, storage, networking, and managed databases.
About the author(s)
Current fan and former Editorial Manager at DigitalOcean. Hi! Expertise in areas including Ubuntu, Docker, Rails, and more.
Still looking for an answer?
This textbox defaults to using Markdown to format your answer.
You can type !ref in this text area to quickly search our full set of tutorials, documentation & marketplace offerings and insert the link!
My server is configured in nginx as reverse proxy cache put in front of a apache server. How GoAccess to gather both web server log ?
This is great! I used the official debian repo:
$ echo "deb http://deb.goaccess.io $(lsb_release -cs) main" | sudo tee -a /etc/apt/sources.list
$ wget -O - http://deb.goaccess.io/gnugpg.key | sudo apt-key add -
$ sudo apt-get update
$ sudo apt-get install goaccess
Warning: this blog software is typographically correcting dashdash to emdash, which means you’ll have to manually change that if you’re cut and pasting. Friend just took an hour of my time while we puzzled over why his configure state didn’t work.
instead of doing: sudo usermod -g adm <username> you should: sudo usermod -aG adm <username>
So we append the ‘adm’ group to the list of groups the user belongs to. Using the -g option will change the main group the user belongs to, which could cause problem with permissions, as we’re no longer part of the main group for our own user.
in step 7:
./configure —enable-geoip —enable-utf8
change the mdash to dashdash
./configure --enable-geoip --enable-utf8
On Debian 7, at step:
./configure —enable-geoip —enable-utf8
I got the error:
configure: error: *** Missing development libraries for ncurses
This was fixed by instructions here: Why can I not install ncurses development package?
Hello everyone, I installed goaccess with the help of digitalocean on a recent debian 8, but when I start the software, it tells me [quote] Fatal error has occurred Error occured at: goaccess.c - main – 832 Nothing valid to process. [/quote] I goggled the error message but the solutions did not telp me. Is there a way to get it run on debian 8?
 This work is licensed under a Creative Commons Attribution-NonCommercial- ShareAlike 4.0 International License.
Become a contributor for community
Get paid to write technical tutorials and select a tech-focused charity to receive a matching donation.

DigitalOcean Documentation
Full documentation for every DigitalOcean product.

Resources for startups and AI-native businesses
The Wave has everything you need to know about building a business, from raising funding to marketing your product.
The developer cloud
Scale up as you grow — whether you're running one virtual machine or ten thousand.

Start building today
From GPU-powered inference and Kubernetes to managed databases and storage, get everything you need to build, scale, and deploy intelligent applications.
