By Marko Mudrinić and Dave Rankin

Introduction
Prometheus is a powerful, open-source monitoring system that collects metrics from your services and stores them in a time-series database. It offers a multi-dimensional data model, a flexible query language, and diverse visualization possibilities through tools like Grafana.
By default, Prometheus only exports metrics about itself (e.g. the number of requests it’s received, its memory consumption, etc.). But, you can greatly expand Prometheus by installing exporters, optional programs that generate additional metrics.
Exporters — both the official ones that the Prometheus team maintains as well as the community-contributed ones — provide information about everything from infrastructure, databases, and web servers to messaging systems, APIs, and more.
Some of the most popular choices include:
- node_exporter - This produces metrics about infrastructure, including the current CPU, memory and disk usage, as well as I/O and network statistics, such as the number of bytes read from a disk or a server’s average load.
- blackbox_exporter - This generates metrics derived from probing protocols like HTTP and HTTPS to determine endpoint availability, response time, and more.
- mysqld_exporter - This gathers metrics related to a MySQL server, such as the number of executed queries, average query response time, and cluster replication status.
- rabbitmq_exporter - This outputs metrics about the RabbitMQ messaging system, including the number of messages published, the number of messages ready to be delivered, and the size of all the messages in the queue.
- nginx-vts-exporter - This provides metrics about an Nginx web server using the Nginx VTS module, including the number of open connections, the number of sent responses (grouped by response codes), and the total size of sent or received requests in bytes.
You can find a more complete list of both official and community-contributed exporters on Prometheus’ website.
In this tutorial, you’ll install, configure, and secure Prometheus and Node Exporter to generate metrics that will make it easier to monitor your server’s performance.
Prerequisites
Before following this tutorial make sure you have:
- One Ubuntu 16.04 Droplet, set up by following the Initial Server Setup with Ubuntu 16.04 tutorial, including a sudo non-root user and a firewall.
- Nginx installed by following the first two steps of the How To Install Nginx on Ubuntu 16.04 tutorial.
Step 1 — Creating Service Users
For security purposes, we’ll begin by creating two new user accounts, prometheus and node_exporter. We’ll use these accounts throughout the tutorial to isolate the ownership on Prometheus’ core files and directories.
Create these two users, and use the --no-create-home and --shell /bin/false options so that these users can’t log into the server.
- sudo useradd --no-create-home --shell /bin/false prometheus
- sudo useradd --no-create-home --shell /bin/false node_exporter
Before we download the Prometheus binaries, create the necessary directories for storing Prometheus’ files and data. Following standard Linux conventions, we’ll create a directory in /etc for Prometheus’ configuration files and a directory in /var/lib for its data.
- sudo mkdir /etc/prometheus
- sudo mkdir /var/lib/prometheus
Now, set the user and group ownership on the new directories to the prometheus user.
- sudo chown prometheus:prometheus /etc/prometheus
- sudo chown prometheus:prometheus /var/lib/prometheus
With our users and directories in place, we can now download Prometheus and then create the minimal configuration file to run Prometheus for the first time.
Step 2 — Downloading Prometheus
First, download and unpack the current stable version of Prometheus into your home directory. You can find the latest binaries along with their checksums on the Prometheus download page.
- cd ~
- curl -LO https://github.com/prometheus/prometheus/releases/download/v2.0.0/prometheus-2.0.0.linux-amd64.tar.gz
Next, use the sha256sum command to generate a checksum of the downloaded file:
- sha256sum prometheus-2.0.0.linux-amd64.tar.gz
Compare the output from this command with the checksum on the Prometheus download page to ensure that your file is both genuine and not corrupted.
Outpute12917b25b32980daee0e9cf879d9ec197e2893924bd1574604eb0f550034d46 prometheus-2.0.0.linux-amd64.tar.gz
If the checksums don’t match, remove the downloaded file and repeat the preceding steps to re-download the file.
Now, unpack the downloaded archive.
- tar xvf prometheus-2.0.0.linux-amd64.tar.gz
This will create a directory called prometheus-2.0.0.linux-amd64 containing two binary files (prometheus and promtool), consoles and console_libraries directories containing the web interface files, a license, a notice, and several example files.
Copy the two binaries to the /usr/local/bin directory.
- sudo cp prometheus-2.0.0.linux-amd64/prometheus /usr/local/bin/
- sudo cp prometheus-2.0.0.linux-amd64/promtool /usr/local/bin/
Set the user and group ownership on the binaries to the prometheus user created in Step 1.
- sudo chown prometheus:prometheus /usr/local/bin/prometheus
- sudo chown prometheus:prometheus /usr/local/bin/promtool
Copy the consoles and console_libraries directories to /etc/prometheus.
- sudo cp -r prometheus-2.0.0.linux-amd64/consoles /etc/prometheus
- sudo cp -r prometheus-2.0.0.linux-amd64/console_libraries /etc/prometheus
Set the user and group ownership on the directories to the prometheus user. Using the -R flag will ensure that ownership is set on the files inside the directory as well.
- sudo chown -R prometheus:prometheus /etc/prometheus/consoles
- sudo chown -R prometheus:prometheus /etc/prometheus/console_libraries
Lastly, remove the leftover files from your home directory as they are no longer needed.
- rm -rf prometheus-2.0.0.linux-amd64.tar.gz prometheus-2.0.0.linux-amd64
Now that Prometheus is installed, we’ll create its configuration and service files in preparation of its first run.
Step 3 — Configuring Prometheus
In the /etc/prometheus directory, use nano or your favorite text editor to create a configuration file named prometheus.yml. For now, this file will contain just enough information to run Prometheus for the first time.
- sudo nano /etc/prometheus/prometheus.yml
Warning: Prometheus’ configuration file uses the YAML format, which strictly forbids tabs and requires two spaces for indentation. Prometheus will fail to start if the configuration file is incorrectly formatted.
In the global settings, define the default interval for scraping metrics. Note that Prometheus will apply these settings to every exporter unless an individual exporter’s own settings override the globals.
global:
  scrape_interval: 15s
This scrape_interval value tells Prometheus to collect metrics from its exporters every 15 seconds, which is long enough for most exporters.
Now, add Prometheus itself to the list of exporters to scrape from with the following scrape_configs directive:
...
scrape_configs:
  - job_name: 'prometheus'
    scrape_interval: 5s
    static_configs:
      - targets: ['localhost:9090']
Prometheus uses the job_name to label exporters in queries and on graphs, so be sure to pick something descriptive here.
And, as Prometheus exports important data about itself that you can use for monitoring performance and debugging, we’ve overridden the global scrape_interval directive from 15 seconds to 5 seconds for more frequent updates.
Lastly, Prometheus uses the static_configs and targets directives to determine where exporters are running. Since this particular exporter is running on the same server as Prometheus itself, we can use localhost instead of an IP address along with the default port, 9090.
Your configuration file should now look like this:
global:
  scrape_interval: 15s

scrape_configs:
  - job_name: 'prometheus'
    scrape_interval: 5s
    static_configs:
      - targets: ['localhost:9090']
Save the file and exit your text editor.
Now, set the user and group ownership on the configuration file to the prometheus user created in Step 1.
- sudo chown prometheus:prometheus /etc/prometheus/prometheus.yml
With the configuration complete, we’re ready to test Prometheus by running it for the first time.
Step 4 — Running Prometheus
Start up Prometheus as the prometheus user, providing the path to both the configuration file and the data directory.
- sudo -u prometheus /usr/local/bin/prometheus \
- --config.file /etc/prometheus/prometheus.yml \
- --storage.tsdb.path /var/lib/prometheus/ \
- --web.console.templates=/etc/prometheus/consoles \
- --web.console.libraries=/etc/prometheus/console_libraries
The output contains information about Prometheus’ loading progress, configuration file, and related services. It also confirms that Prometheus is listening on port 9090.
Outputlevel=info ts=2017-11-17T18:37:27.474530094Z caller=main.go:215 msg="Starting Prometheus" version="(version=2.0.0, branch=HEAD, re
vision=0a74f98628a0463dddc90528220c94de5032d1a0)"
level=info ts=2017-11-17T18:37:27.474758404Z caller=main.go:216 build_context="(go=go1.9.2, user=root@615b82cb36b6, date=20171108-
07:11:59)"
level=info ts=2017-11-17T18:37:27.474883982Z caller=main.go:217 host_details="(Linux 4.4.0-98-generic #121-Ubuntu SMP Tue Oct 10 1
4:24:03 UTC 2017 x86_64 prometheus-update (none))"
level=info ts=2017-11-17T18:37:27.483661837Z caller=web.go:380 component=web msg="Start listening for connections" address=0.0.0.0
:9090
level=info ts=2017-11-17T18:37:27.489730138Z caller=main.go:314 msg="Starting TSDB"
level=info ts=2017-11-17T18:37:27.516050288Z caller=targetmanager.go:71 component="target manager" msg="Starting target manager...
"
level=info ts=2017-11-17T18:37:27.537629169Z caller=main.go:326 msg="TSDB started"
level=info ts=2017-11-17T18:37:27.537896721Z caller=main.go:394 msg="Loading configuration file" filename=/etc/prometheus/promethe
us.yml
level=info ts=2017-11-17T18:37:27.53890004Z caller=main.go:371 msg="Server is ready to receive requests."
If you get an error message, double-check that you’ve used YAML syntax in your configuration file and then follow the on-screen instructions to resolve the problem.
Now, halt Prometheus by pressing CTRL+C, and then open a new systemd service file.
- sudo nano /etc/systemd/system/prometheus.service
The service file tells systemd to run Prometheus as the prometheus user, with the configuration file located in the /etc/prometheus/prometheus.yml directory and to store its data in the /var/lib/prometheus directory. (The details of systemd service files are beyond the scope of this tutorial, but you can learn more at Understanding Systemd Units and Unit Files.)
Copy the following content into the file:
[Unit]
Description=Prometheus
Wants=network-online.target
After=network-online.target

[Service]
User=prometheus
Group=prometheus
Type=simple
ExecStart=/usr/local/bin/prometheus \
    --config.file /etc/prometheus/prometheus.yml \
    --storage.tsdb.path /var/lib/prometheus/ \
    --web.console.templates=/etc/prometheus/consoles \
    --web.console.libraries=/etc/prometheus/console_libraries

[Install]
WantedBy=multi-user.target
Finally, save the file and close your text editor.
To use the newly created service, reload systemd.
- sudo systemctl daemon-reload
You can now start Prometheus using the following command:
- sudo systemctl start prometheus
To make sure Prometheus is running, check the service’s status.
- sudo systemctl status prometheus
The output tells you Prometheus’ status, main process identifier (PID), memory use, and more.
If the service’s status isn’t active, follow the on-screen instructions and re-trace the preceding steps to resolve the problem before continuing the tutorial.
Output● prometheus.service - Prometheus
   Loaded: loaded (/etc/systemd/system/prometheus.service; disabled; vendor preset: enabled)
   Active: active (running) since Fri 2017-07-21 11:40:40 UTC; 3s ago
 Main PID: 2104 (prometheus)
    Tasks: 7
   Memory: 13.8M
      CPU: 470ms
   CGroup: /system.slice/prometheus.service
...
When you’re ready to move on, press Q to quit the status command.
Lastly, enable the service to start on boot.
- sudo systemctl enable prometheus
Now that Prometheus is up and running, we can install an additional exporter to generate metrics about our server’s resources.
Step 5 — Downloading Node Exporter
To expand Prometheus beyond metrics about itself only, we’ll install an additional exporter called Node Exporter. Node Exporter provides detailed information about the system, including CPU, disk, and memory usage.
First, download the current stable version of Node Exporter into your home directory. You can find the latest binaries along with their checksums on Prometheus’ download page.
- cd ~
- curl -LO https://github.com/prometheus/node_exporter/releases/download/v0.15.1/node_exporter-0.15.1.linux-amd64.tar.gz
Use the sha256sum command to generate a checksum of the downloaded file:
- sha256sum node_exporter-0.15.1.linux-amd64.tar.gz
Verify the downloaded file’s integrity by comparing its checksum with the one on the download page.
Output7ffb3773abb71dd2b2119c5f6a7a0dbca0cff34b24b2ced9e01d9897df61a127 node_exporter-0.15.1.linux-amd64.tar.gz
If the checksums don’t match, remove the downloaded file and repeat the preceding steps.
Now, unpack the downloaded archive.
- tar xvf node_exporter-0.15.1.linux-amd64.tar.gz
This will create a directory called node_exporter-0.15.1.linux-amd64 containing a binary file named node_exporter, a license, and a notice.
Copy the binary to the /usr/local/bin directory and set the user and group ownership to the node_exporter user that you created in Step 1.
- sudo cp node_exporter-0.15.1.linux-amd64/node_exporter /usr/local/bin
- sudo chown node_exporter:node_exporter /usr/local/bin/node_exporter
Lastly, remove the leftover files from your home directory as they are no longer needed.
- rm -rf node_exporter-0.15.1.linux-amd64.tar.gz node_exporter-0.15.1.linux-amd64
Now that you’ve installed Node Exporter, let’s test it out by running it before creating a service file for it so that it starts on boot.
Step 6 — Running Node Exporter
The steps for running Node Exporter are similar to those for running Prometheus itself. Start by creating the Systemd service file for Node Exporter.
- sudo nano /etc/systemd/system/node_exporter.service
This service file tells your system to run Node Exporter as the node_exporter user with the default set of collectors enabled.
Copy the following content into the service file:
[Unit]
Description=Node Exporter
Wants=network-online.target
After=network-online.target

[Service]
User=node_exporter
Group=node_exporter
Type=simple
ExecStart=/usr/local/bin/node_exporter

[Install]
WantedBy=multi-user.target
Collectors define which metrics Node Exporter will generate. You can see Node Exporter’s complete list of collectors — including which are enabled by default and which are deprecated — in the Node Exporter README file.
If you ever need to override the default list of collectors, you can use the --collectors.enabled flag, like:
...
ExecStart=/usr/local/bin/node_exporter --collectors.enabled meminfo,loadavg,filesystem
...
The preceding example would tell Node Exporter to generate metrics using only the meminfo, loadavg, and filesystem collectors. You can limit the collectors to however few or many you need, but note that there are no blank spaces before or after the commas.
Save the file and close your text editor.
Finally, reload systemd to use the newly created service.
- sudo systemctl daemon-reload
You can now run Node Exporter using the following command:
- sudo systemctl start node_exporter
Verify that Node Exporter’s running correctly with the status command.
- sudo systemctl status node_exporter
Like before, this output tells you Node Exporter’s status, main process identifier (PID), memory usage, and more.
If the service’s status isn’t active, follow the on-screen messages and re-trace the preceding steps to resolve the problem before continuing.
Output● node_exporter.service - Node Exporter
   Loaded: loaded (/etc/systemd/system/node_exporter.service; disabled; vendor preset: enabled)
   Active: active (running) since Fri 2017-07-21 11:44:46 UTC; 5s ago
 Main PID: 2161 (node_exporter)
    Tasks: 3
   Memory: 1.4M
      CPU: 11ms
   CGroup: /system.slice/node_exporter.service
Lastly, enable Node Exporter to start on boot.
- sudo systemctl enable node_exporter
With Node Exporter fully configured and running as expected, we’ll tell Prometheus to start scraping the new metrics.
Step 7 — Configuring Prometheus to Scrape Node Exporter
Because Prometheus only scrapes exporters which are defined in the scrape_configs portion of its configuration file, we’ll need to add an entry for Node Exporter, just like we did for Prometheus itself.
Open the configuration file.
- sudo nano /etc/prometheus/prometheus.yml
At the end of the scrape_configs block, add a new entry called node_exporter.
...
  - job_name: 'node_exporter'
    scrape_interval: 5s
    static_configs:
      - targets: ['localhost:9100']
Because this exporter is also running on the same server as Prometheus itself, we can use localhost instead of an IP address again along with Node Exporter’s default port, 9100.
Your whole configuration file should look like this:
global:
  scrape_interval: 15s

scrape_configs:
  - job_name: 'prometheus'
    scrape_interval: 5s
    static_configs:
      - targets: ['localhost:9090']
  - job_name: 'node_exporter'
    scrape_interval: 5s
    static_configs:
      - targets: ['localhost:9100']
Save the file and exit your text editor when you’re ready to continue.
Finally, restart Prometheus to put the changes into effect.
- sudo systemctl restart prometheus
Once again, verify that everything is running correctly with the status command.
- sudo systemctl status prometheus
If the service’s status isn’t set to active, follow the on screen instructions and re-trace your previous steps before moving on.
Output● prometheus.service - Prometheus
   Loaded: loaded (/etc/systemd/system/prometheus.service; disabled; vendor preset: enabled)
   Active: active (running) since Fri 2017-07-21 11:46:39 UTC; 6s ago
 Main PID: 2219 (prometheus)
    Tasks: 6
   Memory: 19.9M
      CPU: 433ms
   CGroup: /system.slice/prometheus.service
We now have Prometheus and Node Exporter installed, configured, and running. As a final precaution before connecting to the web interface, we’ll enhance our installation’s security with basic HTTP authentication to ensure that unauthorized users can’t access our metrics.
Step 8 — Securing Prometheus
Prometheus does not include built-in authentication or any other general purpose security mechanism. On the one hand, this means you’re getting a highly flexible system with fewer configuration restraints; on the other hand, it means it’s up to you to ensure that your metrics and overall setup are sufficiently secure.
For simplicity’s sake, we’ll use Nginx to add basic HTTP authentication to our installation, which both Prometheus and its preferred data visualization tool, Grafana, fully support.
Start by installing apache2-utils, which will give you access to the htpasswd utility for generating password files.
- sudo apt-get update
- sudo apt-get install apache2-utils
Now, create a password file by telling htpasswd where you want to store the file and which username you’d like to use for authentication.
Note: htpasswd will prompt you to enter and re-confirm the password you’d like to associate with this user. Also, make note of both the username and password you enter here, as you’ll need them to log into Prometheus in Step 9.
- sudo htpasswd -c /etc/nginx/.htpasswd sammy
The result of this command is a newly-created file called .htpasswd, located in the /etc/nginx directory, containing the username and a hashed version of the password you entered.
Next, configure Nginx to use the newly-created passwords.
First, make a Prometheus-specific copy of the default Nginx configuration file so that you can revert back to the defaults later if you run into a problem.
- sudo cp /etc/nginx/sites-available/default /etc/nginx/sites-available/prometheus
Then, open the new configuration file.
- sudo nano /etc/nginx/sites-available/prometheus
Locate the location / block under the server block. It should look like:
...
	location / {
		try_files $uri $uri/ =404;
	}
...
As we will be forwarding all traffic to Prometheus, replace the try_files directive with the following content:
...
	location / {
		auth_basic "Prometheus server authentication";
		auth_basic_user_file /etc/nginx/.htpasswd;
		proxy_pass http://localhost:9090;
		proxy_http_version 1.1;
		proxy_set_header Upgrade $http_upgrade;
		proxy_set_header Connection 'upgrade';
		proxy_set_header Host $host;
		proxy_cache_bypass $http_upgrade;
	}
...
These settings ensure that users will have to authenticate at the start of each new session. Additionally, the reverse proxy will direct all requests handled by this block to Prometheus.
When you’re finished making changes, save the file and close your text editor.
Now, deactivate the default Nginx configuration file by removing the link to it in the /etc/nginx/sites-enabled directory, and activate the new configuration file by creating a link to it.
- sudo rm /etc/nginx/sites-enabled/default
- sudo ln -s /etc/nginx/sites-available/prometheus /etc/nginx/sites-enabled/
Before restarting Nginx, check the configuration for errors using the following command:
- sudo nginx -t
The output should indicate that the syntax is ok and the test is successful. If you receive an error message, follow the on-screen instructions to fix the problem before proceeding to the next step.
Output of Nginx configuration testsnginx: the configuration file /etc/nginx/nginx.conf syntax is ok
nginx: configuration file /etc/nginx/nginx.conf test is successful
Then, reload Nginx to incorporate all of the changes.
- sudo systemctl reload nginx
Verify that Nginx is up and running.
- sudo systemctl status nginx
If your output doesn’t indicate that the service’s status is active, follow the on-screen messages and re-trace the preceding steps to resolve the issue before continuing.
● nginx.service - A high performance web server and a reverse proxy server
   Loaded: loaded (/lib/systemd/system/nginx.service; enabled; vendor preset: en
   Active: active (running) since Mon 2017-07-31 21:20:57 UTC; 12min ago
  Process: 4302 ExecReload=/usr/sbin/nginx -g daemon on; master_process on; -s r
 Main PID: 3053 (nginx)
    Tasks: 2
   Memory: 3.6M
      CPU: 56ms
   CGroup: /system.slice/nginx.service
At this point, we have a fully-functional and secured Prometheus server, so we can log into the web interface to begin looking at metrics.
Step 9 — Testing Prometheus
Prometheus provides a basic web interface for monitoring the status of itself and its exporters, executing queries, and generating graphs. But, due to the interface’s simplicity, the Prometheus team recommends installing and using Grafana for anything more complicated than testing and debugging.
In this tutorial, we’ll use the built-in web interface to ensure that Prometheus and Node Exporter are up and running, and we’ll also take a look at simple queries and graphs.
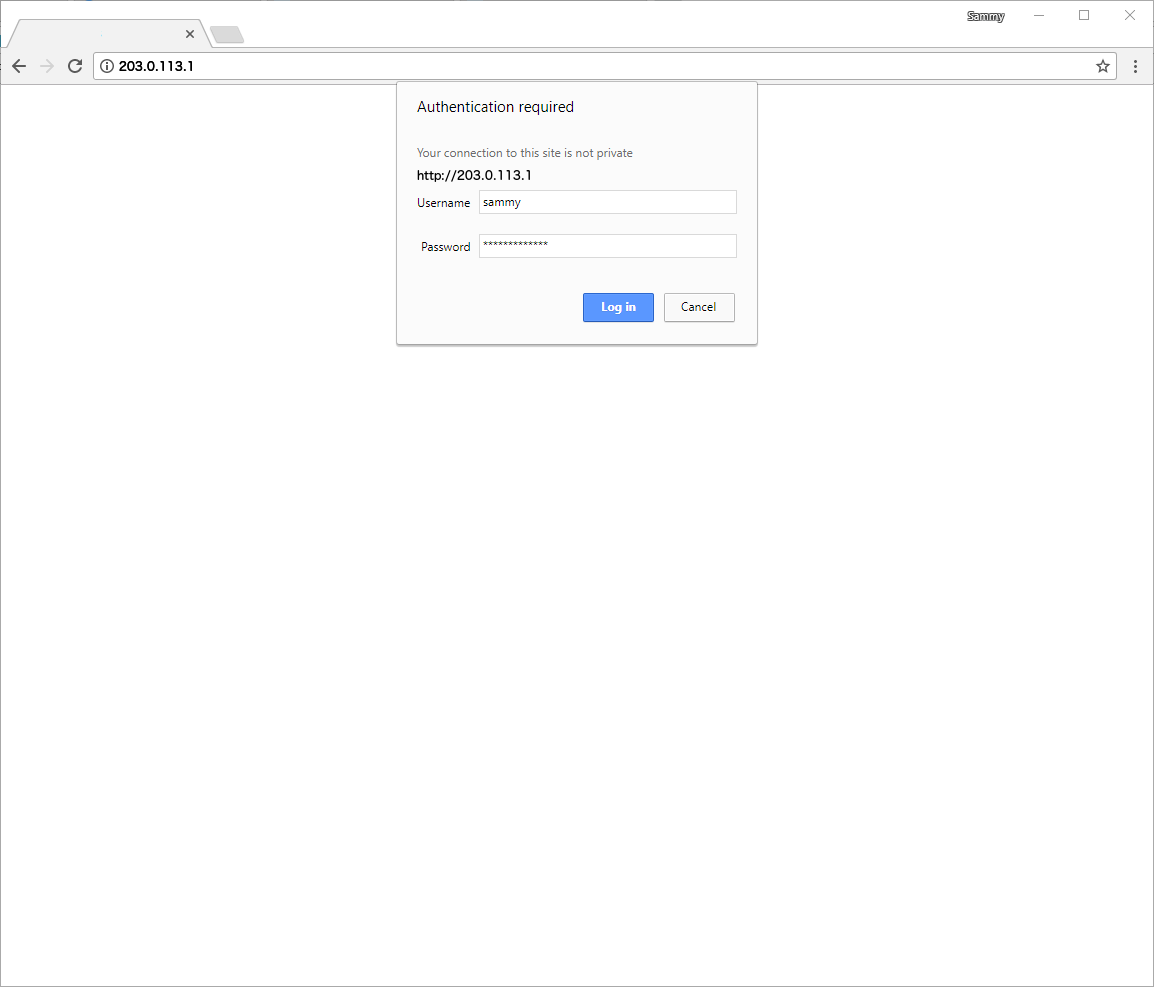
To begin, point your web browser to http://your_server_ip.
In the HTTP authentication dialogue box, enter the username and password you chose in Step 8.
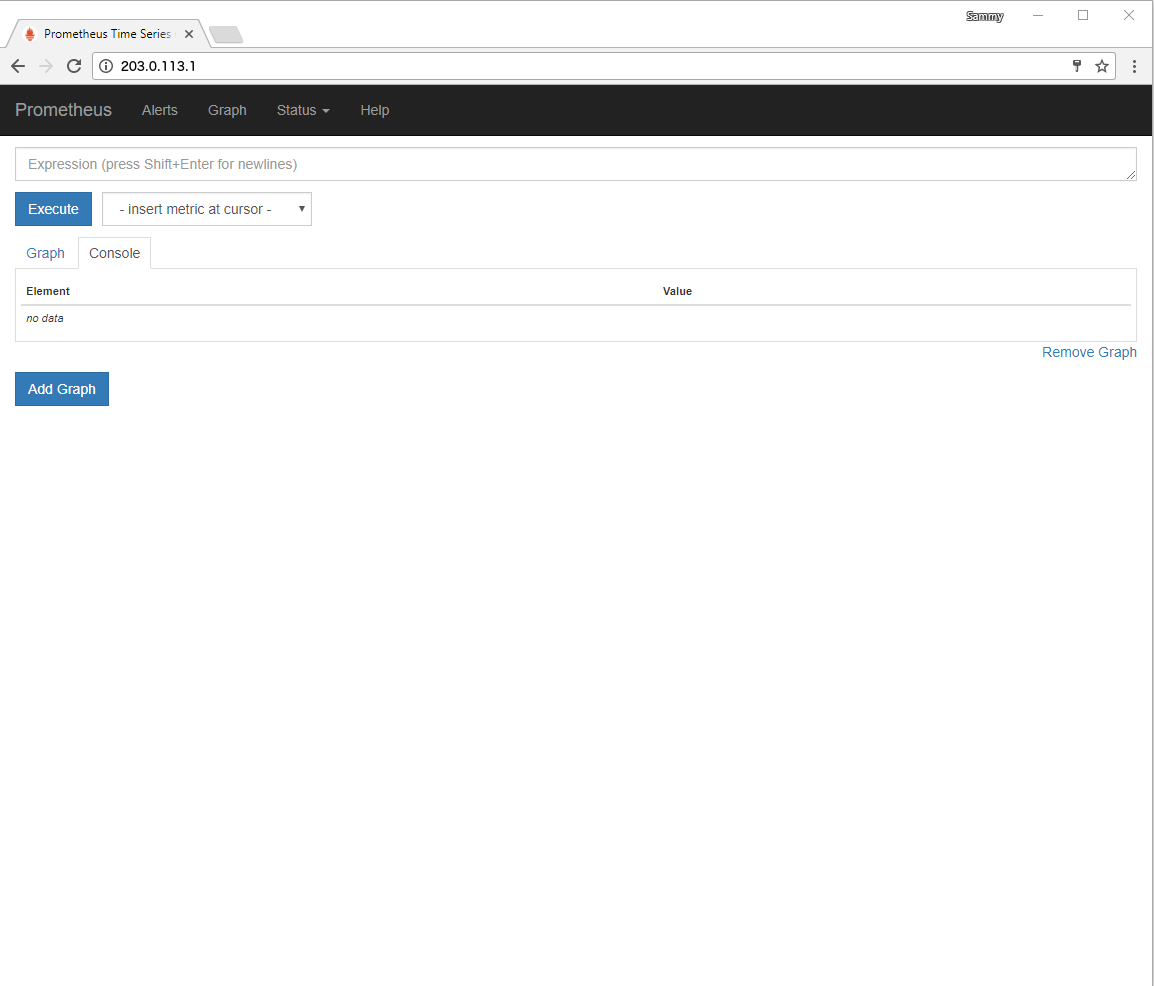
Once logged in, you’ll see the Expression Browser, where you can execute and visualize custom queries.
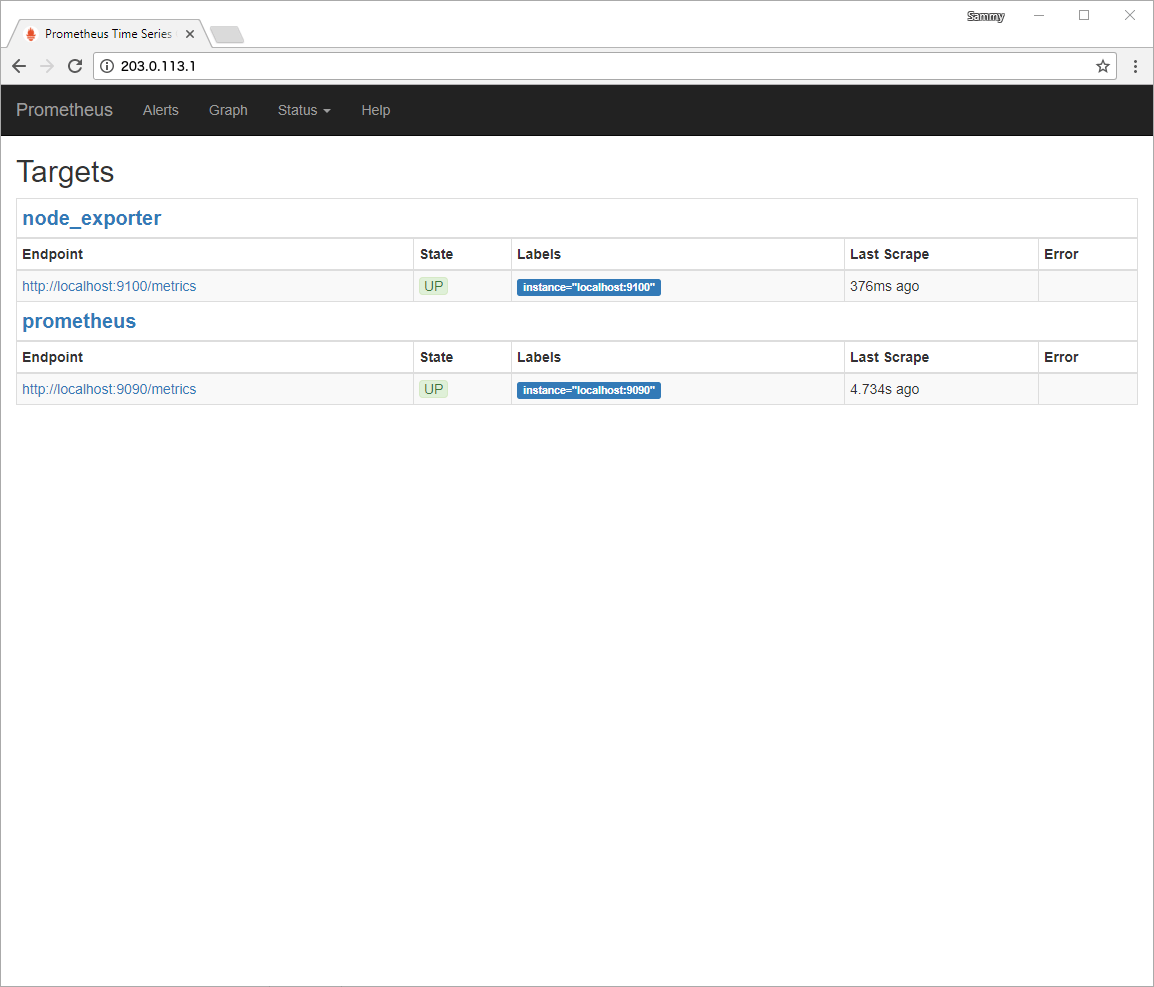
Before executing any expressions, verify the status of both Prometheus and Node Explorer by clicking first on the Status menu at the top of the screen and then on the Targets menu option. As we have configured Prometheus to scrape both itself and Node Exporter, you should see both targets listed in the UP state.
If either exporter is missing or displays an error message, check the service’s status with the following commands:
- sudo systemctl status prometheus
- sudo systemctl status node_exporter
The output for both services should report a status of Active: active (running). If a service either isn’t active at all or is active but still not working correctly, follow the on-screen instructions and re-trace the previous steps before continuing.
Next, to make sure that the exporters are working correctly, we’ll execute a few expressions against Node Exporter.
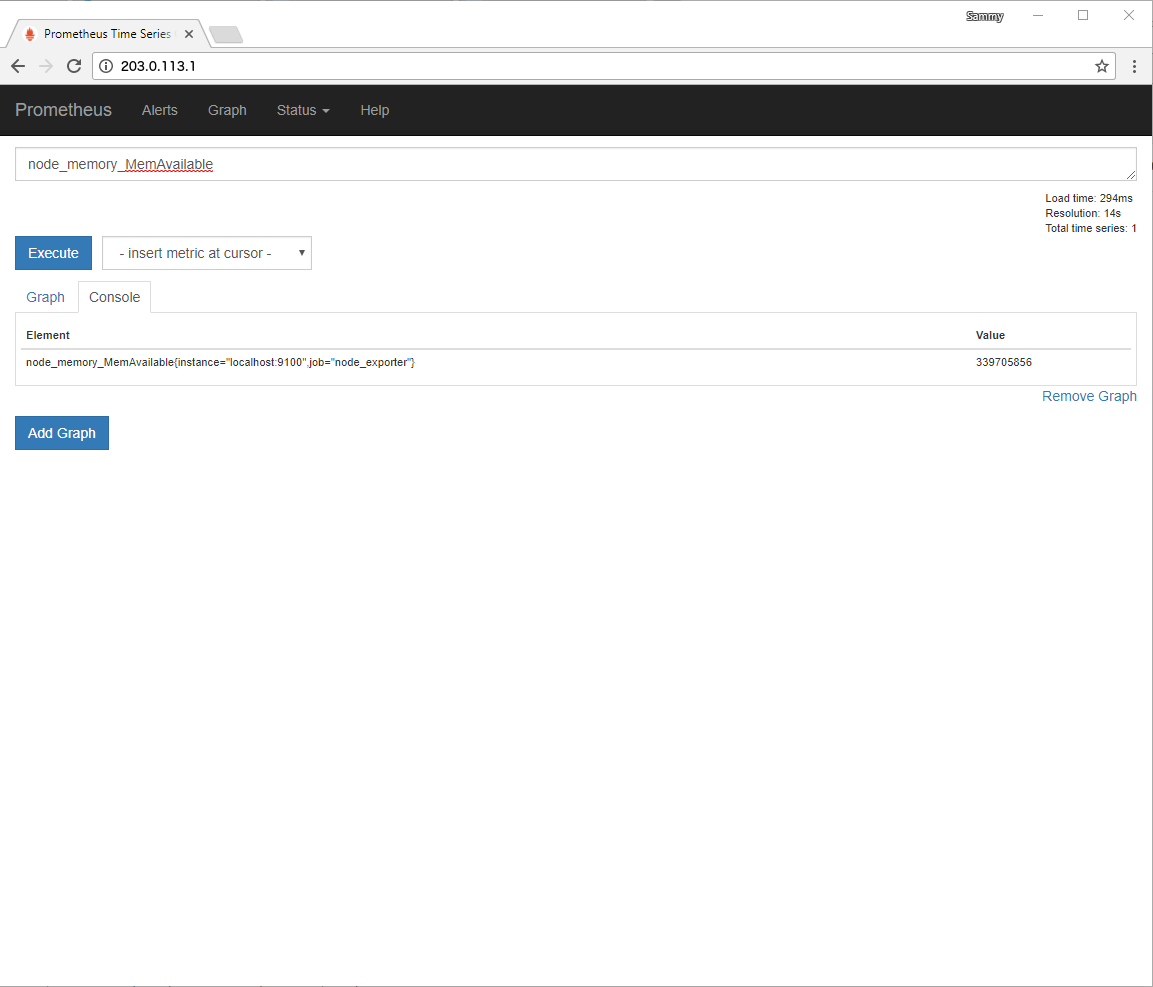
First, click on the Graph menu at the top of the screen to return to the Expression Browser.

In the Expression field, type node_memory_MemAvailable and press the Execute button to update the Console tab with the amount of memory your server has.
By default, Node Exporter reports this amount in bytes. To convert to megabytes, we’ll use math operators to divide by 1024 twice.
In the Expression field, enter node_memory_MemAvailable/1024/1024 and then press the Execute button.
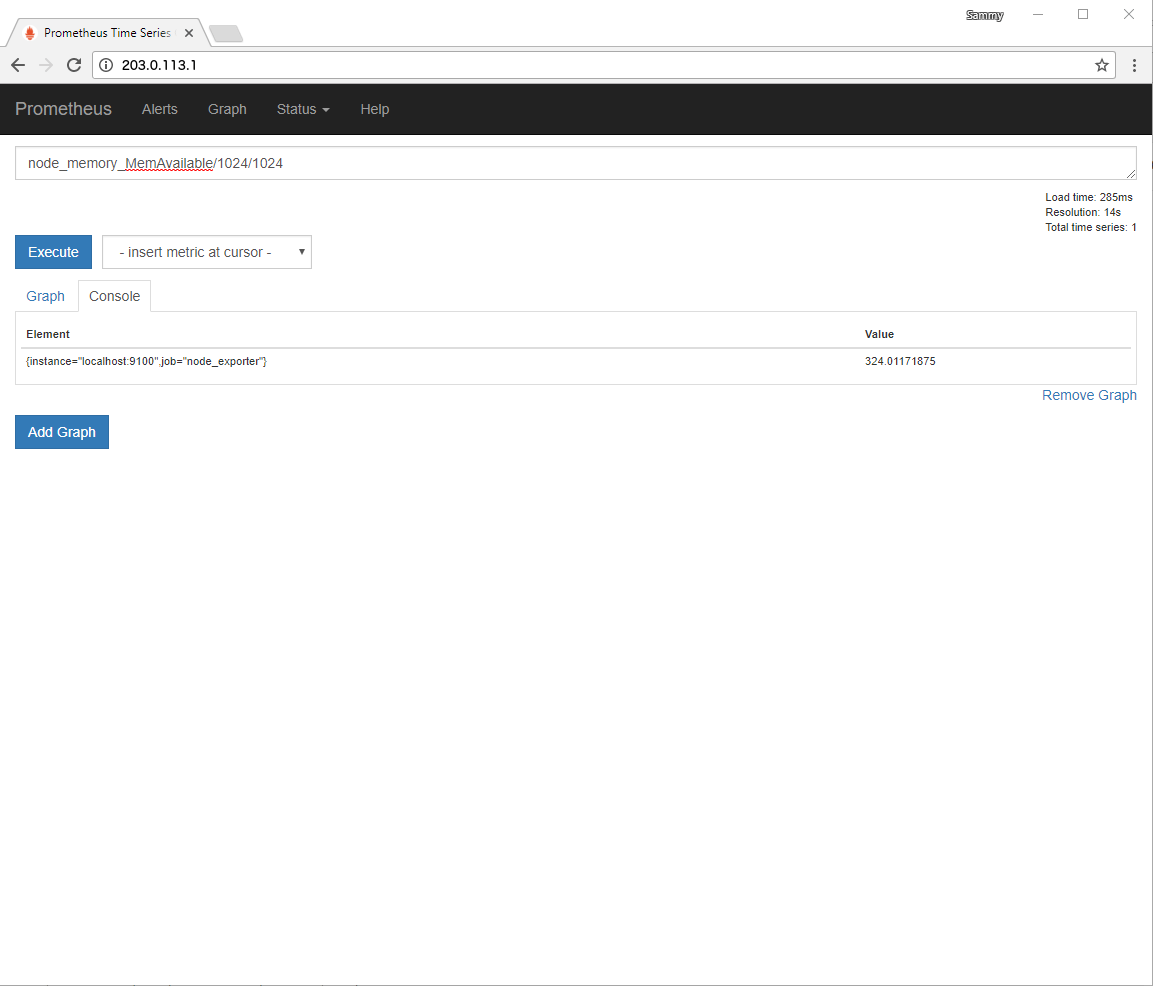
The Console tab will now display the results in megabytes.
If you want to verify the results, execute the free command from your terminal. (The -h flag tells free to report back in a human-readable format, giving us the amount in megabytes.)
- free -h
This output contains details about memory usage, including available memory displayed in the available column.
Output              total        used        free      shared  buff/cache   available
Mem:           488M        144M         17M        3.7M        326M        324M
Swap:            0B          0B          0B
In addition to basic operators, the Prometheus query language also provides many functions for aggregating results.
In the Expression field, type avg_over_time(node_memory_MemAvailable[5m])/1024/1024 and click on the Execute button. The result will be the average available memory over the last 5 minutes in megabytes.
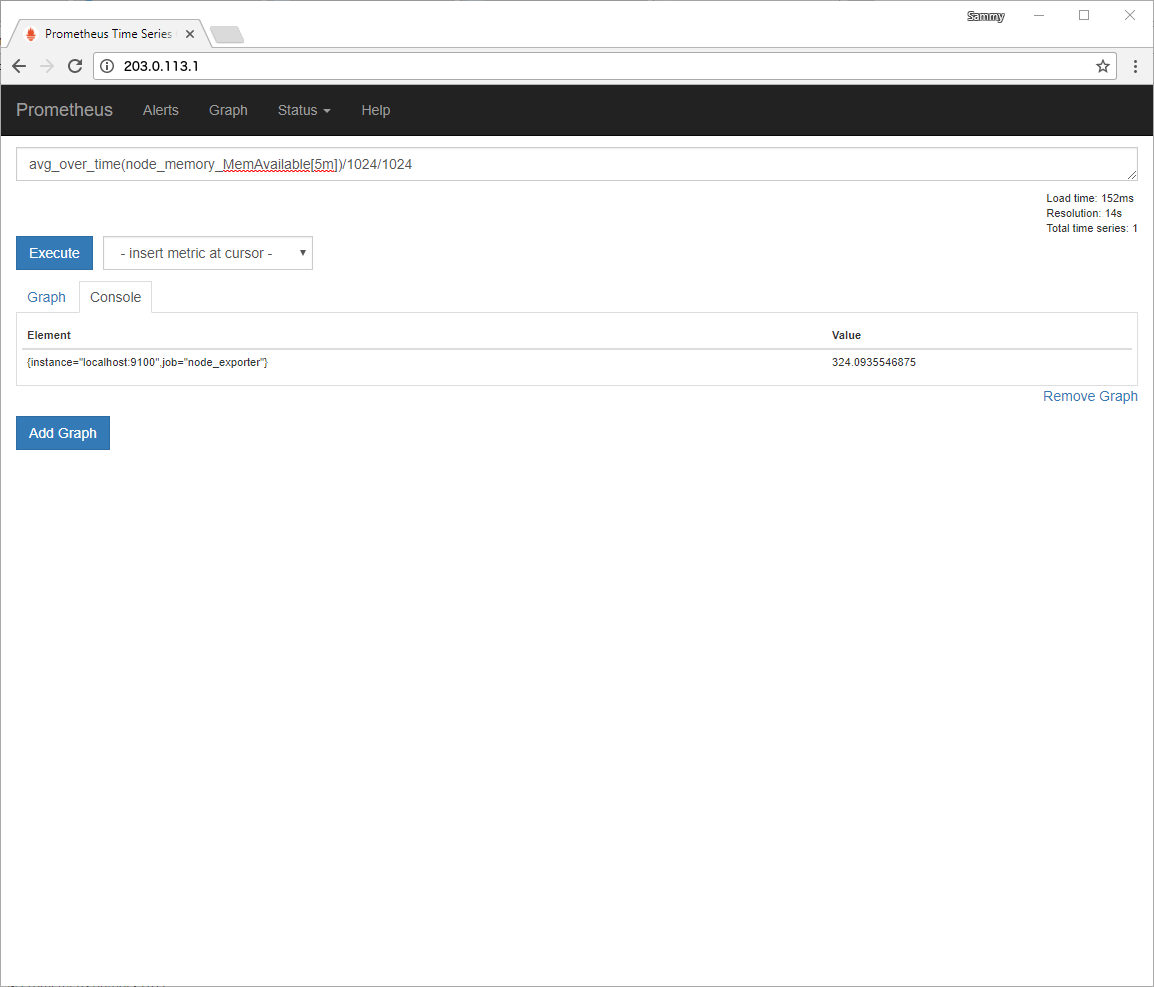
Now, click on the Graph tab to display the executed expression as a graph instead of as text.

Finally, while still on this tab, hover your mouse over the graph for additional details about any specific point along the graph’s X and Y axes.
If you’d like to learn more about creating expressions in Prometheus’ built-in web interface, see the Querying Prometheus portion of the official documentation.
Conclusion
In this tutorial we downloaded, configured, secured, and tested a complete Prometheus installation with one additional exporter.
If you’d like to learn more about how Prometheus works under the hood, take a look at How To Query Prometheus on Ubuntu 14.04. (Since you already have Prometheus installed, you can skip the first step.)
To see what else Prometheus can do, visit the official Prometheus documentation.
And, to learn more about extending Prometheus, check out the list of available exporters as well as the official Grafana website.
Thanks for learning with the DigitalOcean Community. Check out our offerings for compute, storage, networking, and managed databases.
About the author(s)
Software Developer @ Loodse. Former GSoC student with CNCF (Kubernetes). Kubicorn Project Maintainer. Gopher and student.
Technical Editor @ DigitalOcean
Still looking for an answer?
This textbox defaults to using Markdown to format your answer.
You can type !ref in this text area to quickly search our full set of tutorials, documentation & marketplace offerings and insert the link!
Awesome documentation! Here is some update for Prometheus >2.0 setup with Ubuntu 16.
$ sudo -u prometheus /usr/local/bin/prometheus \
–config.file=/etc/prometheus/prometheus.yml
–storage.tsdb.path=/var/lib/prometheus/
This is a great blog with entire setup + securing Prometheus dashboard. However, it is missing setting up consoles and console_libraries sections.
Due to lack of consoles folder we cannot access url like /consoles/node.html & /consoles/prometheus.html which comes default with Prometheus tar.gz.
Note - I was installing prometheus version 2.0.0 so setting for storage path in version 2.0.0 is storage.tsdb.path but in 1.x it was storage.local.path.
Before running delete command stated below -
rm -rf prometheus-2.0.0.linux-amd64.tar.gz prometheus-2.0.0.linux-amd64
Copy these folders -
- consoles
- console_libraries
to location that you want. For my ease i pasted them with my prometheus.yml file i.e /etc/prometheus by following commands -
sudo cp -R ~/prometheus-2.0.0.linux-amd64/consoles /etc/prometheus
sudo cp -R ~/prometheus-2.0.0.linux-amd64/console_libraries /etc/prometheus
After this we need to enhance run prometheus commands both manual and service to support following settings -
- web.console.templates
- web.console.libraries
for consoles and console_libraries folder respectively (related gtihub ticket)
Changes needed -
- Manual run Step 4 will change to -
sudo -u prometheus /usr/local/bin/prometheus \
--config.file=/etc/prometheus/prometheus.yml \
--storage.tsdb.path=/var/lib/prometheus/ \
--web.console.templates=/etc/prometheus/consoles \
--web.console.libraries=/etc/prometheus/console_libraries
- Service file
/etc/systemd/system/prometheus.servicewill change to -
[Unit]
Description=Prometheus
Wants=network-online.target
After=network-online.target

[Service]
User=prometheus
Group=prometheus
Type=simple
ExecStart=/usr/local/bin/prometheus --config.file=/etc/prometheus/prometheus.yml \
    --storage.tsdb.path=/var/lib/prometheus/ \
    --web.console.templates=/etc/prometheus/consoles \
    --web.console.libraries=/etc/prometheus/console_libraries

[Install]
WantedBy=multi-user.target
Now we are all set to access both http://<you_ip_address>/consoles/node.html & http://<you_ip_address>/consoles/prometheus.html pages.
Hi, how can I install blackbox exporter? is it the same with the way node exporter was done? a feedback would help a lot
Alertmanager is a tool developed by the same prometheus guys and in my vision is quite important. Based on this marvelous tutorial i have developed a set of commands to install alertmanager as well. Since i did not find this anywhere here goes:
#!/bin/bash sudo useradd --no-create-home --shell /bin/false alertmanager wget https://github.com/prometheus/alertmanager/releases/download/v0.12.0/alertmanager-0.12.0.linux-amd64.tar.gz tar xvf alertmanager-0.12.0.linux-amd64.tar.gz cd alertmanager-0.12.0.linux-amd64.tar.gz sudo cp alertmanager /usr/local/bin/ sudo cp amtool /usr/local/bin/ sudo chown alertmanager:alertmanager /usr/local/bin/alertmanager sudo chown alertmanager:alertmanager /usr/local/bin/amtool sudo mkdir /etc/alertmanager sudo mkdir /etc/alertmanager/data sudo mv simple.yml /etc/alertmanager/alertmanager.yml sudo chown alertmanager:alertmanager /etc/alertmanager/alertmanager.yml sudo chown alertmanager:alertmanager /etc/alertmanager/data cd /etc/systemd/system/ SCRIPT=“[Unit]\n Description=Alertmanager\n Wants=network-online.target\n After=network-online.target\n \n [Service]\n User=alertmanager\n Group=alertmanager\n Type=simple\n ExecStart=/usr/local/bin/alertmanager -config.file /etc/alertmanager/alertmanager.yml -storage.path /etc/alertmanager/data\n \n [Install]\n WantedBy=multi-user.target” echo -e $SCRIPT >> alertmanager.service sudo systemctl daemon-reload sudo systemctl enable alertmanager sudo systemctl start alertmanager
Please use this script as you wish. Probably some commands will have to be modified to fit one needs. So have fun ^^
P.S.: OP, can you update your documentation to add alertmanager? Thanks :D
Hello Marko,
Good job on this bootstrapping howto:)
One important note: when configuring Nginx [or any other web server/proxy for that matter] with basic auth to protect the Prometheus I/F, one should also pass along
--web.listen-address=127.0.0.1:9090
to the Prometheus daemon so that it binds on loopback only [default is 0.0.0.0]. Otherwise, while when making a request to the Nginx, you will indeed be prompted for a user and passwd, you could still reach Prometheus directly without auth over port 9090 [of course, 9090 is only the default port, can be anything].
I recommend adding --web.listen-address=127.0.0.1:9090 to your sample /etc/systemd/system/prometheus.service.
Same thing is true for the node_exporter which also uses the same flag.
I have a problem with step 4.
level=info ts=2018-02-05T08:59:41.45936827Z caller=main.go:486 msg="Server is ready to receive web requests."
level=info ts=2018-02-05T08:59:41.460060803Z caller=manager.go:59 component="scrape manager" msg="Starting scrape manager..."
Starting scrape manager complete never. The system hangs in this step. How i can fix it?
Hello,
I am just learning Prometheus, and I actually have one working, However I am confused about the exporters, Where do they get installed? I mean I understand grabbing metrics from the Prometheus server itself. But what if I want metrics from say a Cisco 3750 Switch? I know there is an SNMP Exporter but it can’t be installed on the Cisco. It appears that you install them on the Prometheus server thus far.
Sorry for the stupid question… Thanks, Michael
Hey, I’m trying to configure Prometheus to watch over my Kubernetes cluster on Digital Ocean. I’m playing around with this demo: https://github.com/microservices-demo/microservices-demo which has already configured Prometheus YAML files, and actually prometheus running as a Deployment. But, some of my targets are down and I’m too new to this area in general to figure out why. Could you please help me out, what should I look for? I’m getting errors with kubernetes-dashboard (port 8443/metrics --> malformed HTTP response), kubernetes-nodes (port 10250/metrics --> 403 forbidden), monitoring/ (port 80/metrics --> dial tcp… getsockopt conncetion refused), grafana ( port 3000/metrics --> 401 unauthorized), and also some others… Thanks in advance!
If anyone is interested in saving time, I’ve scripted the installation portion of this tutorial.
You can find my scripts here: https://github.com/icolwell/install_scripts
The following scripts may be of interest:
prometheus_install.bash
prometheus_node_exporter_install.bash
prometheus_apache_exporter_install.bash
You can download and run the scripts using the following:
wget https://raw.githubusercontent.com/icolwell/install_scripts/master/prometheus_install.bash
bash prometheus_install.bash
Note that any existing prometheus configuration will be overridden.
 This work is licensed under a Creative Commons Attribution-NonCommercial- ShareAlike 4.0 International License.
Become a contributor for community
Get paid to write technical tutorials and select a tech-focused charity to receive a matching donation.

DigitalOcean Documentation
Full documentation for every DigitalOcean product.

Resources for startups and AI-native businesses
The Wave has everything you need to know about building a business, from raising funding to marketing your product.
The developer cloud
Scale up as you grow — whether you're running one virtual machine or ten thousand.

Start building today
From GPU-powered inference and Kubernetes to managed databases and storage, get everything you need to build, scale, and deploy intelligent applications.
